The season of celebration is here! Christmas is just around the corner. And here is a beautiful self-similar Christmas tree that was created using SAS with the help of two fascinating features – matrix computations and ODS statistical graphics.
Experiencing self-similarity in Kronecker products
You might have come across blogposts highlighting how repeated Kronecker product of a binary matrix ushers us into self-similar structures. But this time, we are taking special care in introducing self-similarity in Kronecker products – like, if M is a binary matrix then Kronecker product happens to be M@M, which is a block matrix in which each 1 inside the original matrix is replaced by a copy of M, and each O is replaced with a zero block. In this blog, @ stands for the Kronecker product (or direct product) operator implemented in IML/SAS software).
Carry this process for three or more times and generate a heat map of the product matrix to help create a self-similar structure.
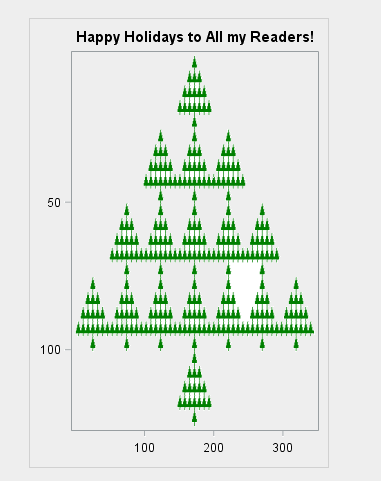
For an instance, the following 5×7 binary matrix possesses 1 in positions that resemble the shape of a Christmas tree. The direct product, M@M@M is a powerful matrix that includes 53 = 125 rows and 73 = 343 columns. The creation of a heat map of the direct product in SAS/IML is done by using HEATMAPDISC, in which a green cell represents a 1:
proc iml;
M = {0 0 0 1 0 0 0,
     0 0 1 1 1 0 0,
     0 1 1 1 1 1 0,
     1 1 1 1 1 1 1,
     0 0 0 1 0 0 0};
Tree = M @ M @ M;     /* M is 5 x 7, so Tree is 125 x 343 */

ods graphics / width=300px height=450px  ANTIALIASMAX=50000;
call heatmapdisc(Tree) title="Happy Holidays to All my Readers!"
     colorramp={White Green} displayoutlines=0 ShowLegend=0;
Now, that you can see the tree for yourself, you can also visualize a large tree with 17 smaller trees, each consisting of 17 mini trees.
How to add a star above?
Now, are you wondering about how to put a star up on the tree? The best way to do it is by using a scatter plot and drawing a special observation by implementing a star symbol – then unpack the 125×343 matrix into a list of (x,y) values (it’s a broad-and-long conversion of the matrix).
Another way is by using the NDX2SUB function to extract the column and row of each 1 in the matrix in the following manner:
/* extract (row, column) pairs for matrix elements that are '1' */
idx = loc(Tree = 1);                /* indices for the 1s */
s = ndx2sub(dimension(Tree), idx);  /* convert indices to subscripts */
create Tree from s[c={"RNames" "CNames"}];
append from s;
close;

call symputx("XPos", range(s[,2])/2); /* midrange = horiz position of star */
quit;
The before-mentioned points helped in creating a SAS data set known as TREE that includes the (x,y) positions of the 1s in the direct product matrix. The statements are also good to save midrange value to a macro variable.
Check out the following SAS procedures assist in creating the location of the star, link the two data sets, and draw a scatter plot of the outcome, which you will find at the beginning of this blog
data star;
x = &XPos; y = 0;
run;

data Tree2;
set Tree star;
run;

ods graphics / width=600px height=800px  ANTIALIASMAX=50000;
title "Happy Holidays";
proc sgplot data=Tree2 noborder noautolegend;
scatter x=CNames y=RNames / markerattrs=(color=ForestGreen symbol=SquareFilled size=3);
scatter x=x y=y / markerattrs=(symbol=StarFilled size=20)             /* yellow star */
                  filledoutlinedmarkers markerfillattrs=(color=yellow);
yaxis reverse display=none;
xaxis display=none;
run;
The article is sourced from – blogs.sas.com/content/iml/2017/12/11/self-similar-christmas-tree.html, and not contributed by our editorial team.
But, if you are seeking SAS training courses in Delhi NCR, DexLab Analytics is here! Their program-centric SAS courses are top-of-the-line, and are perfect to give a robust push to your career in analytics!
Interested in a career in Data Analyst?
To learn more about Machine Learning Using Python and Spark – click here.
To learn more about Data Analyst with Advanced excel course – click here.
To learn more about Data Analyst with SAS Course – click here.
To learn more about Data Analyst with R Course – click here.
To learn more about Big Data Course – click here.
sas analytics course, sas certification, Sas course, Sas training centre, SAS training courses, Sas training institute


