Software tools : SAS, R, Python etc Archives - DexLab Analytics | Big Data Hadoop SAS R Analytics Predictive Modeling & Excel VBA

Regular Expression in Python Part III: Learn To Substitute With Re

Regular Expression in Python Part III: Learn To Substitute With Re

This is the 3rd part of the ongoing Regex or, regular expression in Python series where we are discussing how to handle textual data. In the second part we introduced you to the re library and in this third segment, we are going to be discussing how to substitute characters or, words with re library.

Re library has a wide range of methods to deal with textual data, one such method is .sub() which helps us substitute alphabets or words based on the patterns we build. This method can be used with .match() method and .search() method, both having differences in the way they extract a pattern.

Difference between .match() & .search()

.match() :- This method extracts the required text only at the begging.

.search() :-This can extract the required string from the entire text but only at the first occurrence

In the above code you can see that even though the word “Hello” is in the middle of the text we are able to fetch it because of the special attribute of the .search() method. Here we are again using “Hello dexlab…!” as an example and .compile() is being used to create and apply our pattern.

Now suppose if we want to substitute the word “Hello” with another string “Hi” we will have to use .sub() method from the re library. But there are ways to use this method directly or indirectly.

 First let’s see the direct method.

In the above line of code we first mention what we want to substitute and with what and then we add the text.

Second way to do this is by first using .compile() method to build the pattern and then use that pattern to substitute the alphabet or word.

The above pattern in the .complie() method states that there is a word with the first alphabet in uppercase combined with lowercase alphabets to be substituted with the word “Hi”. This pattern can match any string with the same characteristics, for example:-

Look at the text used in the .sub() method, now instead of “Hello” we have “Pello” with the same characteristics substituted with the word “Hi”. But one must not forget this pattern can also be used in the .sub() method directly and the use of .compile() method is optional. .compile() method is used only to create an object based code.

So, this wraps up the discussion on how to substitute characters or, words with re library. Hopefully, you found this blog informative, if you wish to find more Python Certification course topics, keep following the Dexlab Analytics blog.


.

Bayes’ Theorem – Application in R and Python

Bayes’ Theorem – Application in R and Python

Bayes’ theorem, named after 18th century (1763) British mathematician Thomas Bayes, is a mathematical formula for determining conditional probability.  In the discussion of conditional probability we indicated that revising probability when new information is obtained is an important phase of probability analysis. Often, we begin our analysis with initial or prior probability estimates for specific events of interest. Then, from sources such as a sample, a special report, a product test, etc we obtain some additional information about the events. Given this new information, we update the prior probability values by calculating revised probabilities, referred to as posterior probabilities.

The steps involved in this probability revision process are depicted in the digram below:

  • Theorem:

An event A can occur only if one of the mutually exclusive and exhaustive set of events B1, B2,… ,Bn occurs. Suppose that the unconditional probabilities

And the conditional probabilities

are known. Then the conditional probability of a specified event Bi, when A is stated to have actually occurred, is given by

This is known as Bayes’ Theorem.

  • Proof:

An event A can happen in mutually exclusive ways, B1 A, B2A,… Bn A, i.e. either when has occurred, or. So by the theorem of total probability


Again,

Since the events ABi and BiA are equivalent, their probabilities are also equal.

Hence

So that

Substituting for P(A) from above, the theorem is proved.

Equation (1) is also known as “Bayes” formula for calculating probabilities of hypothesis. Because B1, B2,…Bn may be considered as hypothesis which account for the occurrence of A. The probabilities P(B1),P(B2 ),…P(Bn) are called ‘a prior’ probabilities of the hypothesis.

While are known as a‘a posteriori’ probabilities of the same hypothesis.

Data Science Machine Learning Certification

For more on this, do peruse the Dexlab Analytics website today. Dexlab Analytics is a premiere institute for R programming courses in Gurgaon.


.

Why Python is Preferred in AI and Machine Learning?

Why Python is Preferred in AI and Machine Learning?

Python has become one of the leading coding languages across the globe and for more reasons than one. In this article, we evaluate why Python is beneficial in the use of Machine Learning and Artificial Intelligence applications.

Artificial intelligence and Machine Learning are profoundly shaping the world we live in, with new applications mushrooming by the day. Competent designers are choosing Python as their go-to programming language for designing AI and ML programs.

Artificial Intelligence enables music platforms like Spotify to prescribe melodies to users and streaming platforms like Netflix to understand what shows viewers would like to watch based on their tastes and preferences. The science is widely being used to power organizations with worker efficiency and self-administration. 

Machine-driven intelligence ventures are different from traditional programming languages in that they have innovation stack and the ability to accommodate an AI-based experiment. Python has these features and more. It is a steady programming language, it is adaptable and has accessible instruments.

Here are some features of Python that enable AI engineers to build gainful products.

  • An exemplary library environment 

“An extraordinary selection of libraries is one of the primary reasons Python is the most mainstream programming language utilized for AI”, a report says. Python libraries are very extensive in nature and enable designers to perform useful activities without the need to code them from scratch.

Machine Learning demands incessant information preparation, and Python’s libraries allows you to access, deal with and change information. These are libraries can be used for ML and AI: Pandas, Keras, TensorFlow, Matplotlib, NLTK, Scikit-picture, PyBrain, Caffe, Stats models and in the PyPI storehouse, you can find and look at more Python libraries. 

  • Basic and predictable 

Python has on offer short and decipherable code. Python’s effortless built allows engineers to make and design robust frameworks. Designers can straightway concentrate on tackling an ML issue rather concentrating on the subtleties of the programming language. 

Moreover, Python is easy to learn and therefore being adopted by more and more designers who can easily construct models for AI. Also, many software engineers feel Python is more intuitive than other programming languages.

  • A low entry barrier 

Working in the ML and AI industry means an engineer will have to manage tons of information in a prodigious way. The low section hindrance or low entry barrier allows more information researchers to rapidly understand Python and begin using it for AI advancement without wasting time or energy learning the language.

Moreover, Python programming language is in simple English with a straightforward syntax which makes it very readable and easy to understand.

Data Science Machine Learning Certification

Conclusion

Thus, we have seen how advantageous Python is as a programming language which can be used to build AI models with ease and agility. It has a broad choice of AI explicit libraries and its basic grammar and readability make the language accessible to non-developers.

It is being widely adopted by developers across institutions working in the field of AI. It is no surprise then that artificial intelligence courses in Delhi and Machine Learning institutes in Gurgaon are enrolling more and more developers who want to be trained in the science of Python.


.

8 Skills a Python Programmer Should Master

8 Skills a Python Programmer Should Master

Python has become the lingua franca of the computing world. It has come to become the most sought after programming language for deep learning, machine learning and artificial intelligence. It is a favourite with programmers because it is easy to understand and learn and it achieves a lot more in terms of productivity as compared to other languages.

Python is a dynamic, high-level, general-purpose programming language that is useful for developing desktop, web and mobile applications that can also be used for complex scientific and numeric applications, data science, AI etc. Python focuses a lot on code readability.

From web and game development to machine learning, from AI to scientific computing and academic research, Data science and analysis, python is regarded as the real deal. Python is useful in domains like finance, social media, biotech etc. Developing large software applications in Python is also simpler due to its large amount of available libraries.

The Python developer usually deals with backend components, apps connection with third-party web services and giving support to frontend developers in web applications. Of course, one might create applications with use of different languages but pretty often Python is the language chosen for it – and there are several reasons for that.

In this article, we will walk through a structured approach to top 8 skills required to become a Python Developer. These skills are:

  • Core Python
  • Good grasp of Web Frameworks
  • Front-End Technologies
  • Data Science
  • Machine Learning and AI
  • Python Libraries
  • Multi-Process Architecture
  • Communication Skills

Core Python

This is the foundation of any Python developer. If one wants to achieve success in this career, he/she needs to understand the core python concepts. These include the following:

  • Iterators
  • Data Structures
  • Generators
  • OOPs concepts
  • Exception Handling
  • File handling concepts
  • Variables and data types

However, learning the core language (as mentioned above) is only the first step in mastering this language and becoming a successful Python developer.

Good grasp of Web Frameworks

By automating the implementation of redundant tasks, frameworks cut development time and enable developers to focus greatly on application logic rather than routine elements.

Because it is one of the leading programming languages, there is no scarcity of frameworks for Python. Different frameworks have their own set of advantages and issues. Hence, the selection needs to be made on the basis of project requirements and developer preference. There are primarily three types of Python frameworks, namely full-stack, micro-framework, and asynchronous.

A good Python web developer has incredible honing over either of the two web frameworks Django or Flask or both. Django is a high-level Python Web Framework that encourages a good, clean and pragmatic design and Flask is also widely used Python micro web framework.

Front-End Technologies (JavaScript, CSS3, HTML5)

Sometimes, Python developers must work with the frontend team to match together the server-side and the client-side. This means Python developers need a basic understanding of how the frontend works, what’s possible and what’s not, and how the application will appear.

While there is likely a UX team, SCRUM master, and project or product manager to coordinate the workflow, it’s still good to have a basic understanding of front-end tasks.

Data Science

Data science offers a world of new opportunities. Being a Python developer, there are several prerequisites you need to know starting with things you learn in high school mathematics, such as statistics, probability, etc. Some of the other parts of data science you need to understand, and use include SQL knowledge; the use of Python packages, data wrangling and data cleanup, analysis of data, and visualization of data.

Artificial Intelligence and Machine Learning

Artificial Intelligence and Machine Learning (as well as Deep Learning) are constantly growing. Python is the perfect programming language which is used in all the frameworks of Machine Learning and Deep Learning. This will be a huge plus for someone if he/she knows about this domain. If someone is into data science, then definitely digging in the Machine Learning topic would be a great idea.

Python Libraries

Python libraries certainly deserve a place in every Python Developer’s toolbox. Python has a massive collection of libraries, both native and third-party libraries. With so many Python libraries out there, though, it’s no surprise that some don’t get all the attention they deserve. Plus, programmers who work exclusively in one domain don’t always know about the goodies available to them for other kinds of work.

Python libraries are extensively used in simplifying everything from file system access, database programming, and working with cloud services to building lightweight web apps, creating GUIs, and working with images, ebooks, and Word files—and much more.

Multiprocessing Architecture

Multiprocessing refers to the ability of a system to support more than one processor at the same time. Applications in a multiprocessing system are broken to smaller routines that run independently. The operating system allocates these threads to the processors improving performance of the system. As a Python-Developer one should definitely know about the MVC (Model View Controller) and MVT (Model View Template) Architecture. Once you understand the Multi-Processing Architecture you can solve issues related to the core framework etc.

Communication Skills

In best software development firms the teams are made out of amazing programmers which work together to achieve the final goal – no matter if it means to finish the project, to create a new app or maybe to help a startup. However, working in a team means that a developer has to communicate well – not only to get the stuff done but also to keep the documentation clear so others can easily read and follow the thinking path to fully understand the idea.

Data Science Machine Learning Certification

Conclusion

In this write-up, we have elaborated on the top skills one needs to have to be a successful Python Developer. One must have a working knowledge of Core Python and a good grasp of Web Frameworks, Front-End Technologies, Data Science, Machine Learning and AI, Python Libraries, Multi-Process Architecture and Communication skills. Though there are a few more skills not listed in this blog, one can achieve success in developing large software applications by mastering all the above skills only.

As delineated in the article, Python is the new rage in the computing world. And it is no surprise then that more and more professionals are opting to take up courses teaching Machine learning using Python and python for data analysis.


Interested in a career in Data Analyst?

To learn more about Data Analyst with Advanced excel course – Enrol Now.
To learn more about Data Analyst with R Course – Enrol Now.
To learn more about Big Data Course – Enrol Now.

To learn more about Machine Learning Using Python and Spark – Enrol Now.
To learn more about Data Analyst with SAS Course – Enrol Now.
To learn more about Data Analyst with Apache Spark Course – Enrol Now.
To learn more about Data Analyst with Market Risk Analytics and Modelling Course – Enrol Now.

A Handbook of the Basic Data Types in Python 3: Strings

A Handbook of the Basic Data Types in Python 3: Strings

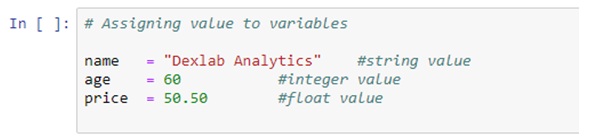
In general, a data type defines the format, sets the upper & lower bounds of the data so that a program could use it appropriately. Data types are the classification or categorization of data items which describes the character of a variable. The most used data types are numeric, non-numeric and Boolean (true/false).

Python has the following standard Data Types:

  • Booleans
  • Numbers
  • String
  • List
  • Tuple
  • Set
  • Dictionary

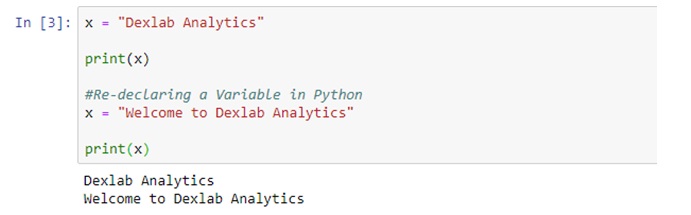
Mutable and Immutable Objects

Data objects of the above types are stored in a computer’s memory for processing. Some of these values can be modified during processing, but the contents of the others can’t be altered once they are created in the memory.

Number values, strings, and tuple are immutable, which means their contents can’t be altered after creation.

On the other hand, the collection of items in a List or Dictionary object can be modified. It is possible to add, delete, insert, and rearrange items in a list or dictionary. Hence, they are mutable objects.

Booleans

A Boolean is such a data type that almost every programming language has, and so does Python. Boolean in Python can have two values – True or False. These values can be used for assigning and comparison.

Numbers

Numbers are one of the most prominent Python data types. In Numbers, there are mainly 3 types which include Integer, Float, and Complex.

String

A sequence of one or more characters enclosed within either single quotes ‘or double quotes” is considered as String in Python. Any letter, a number or a symbol could be a part of the string. Multi-line strings can be represented using triple quotes,”’ or “””.

Data Science Machine Learning Certification

List

Python list is an array-like construct which stores a heterogeneous collection of items of varied data typed objects in an ordered sequence. It is very flexible and does not have a fixed size. The Index in a list begins with a zero in Python.

Tuple

A tuple is a sequence of Python objects separated by commas. Tuples are immutable, which means tuples once created cannot be modified. Tuples are defined using parentheses ().

Set

A set is an unordered collection of items. Set is defined by values separated by a comma inside braces { }. Amongst all the Python data types, the set is one which supports mathematical operations like union, intersection, symmetric difference etc. Since the set derives its implementation from the “Set” in mathematics, so it can’t have multiple occurrences of the same element.

Dictionary

A dictionary in Python is an unordered collection of key-value pairs. It’s a built-in mapping type in Python where keys map to values. These key-value pairs provide an intuitive way to store data. To retrieve the value we must know the key. In Python, dictionaries are defined within braces {}.

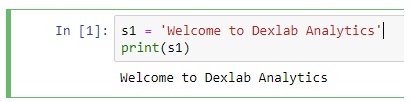
This article is about one specific data type, which is a string. The String is a sequence of characters enclosed in single (”) or double quotation (“”) marks.

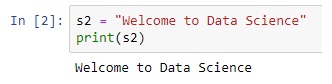
Here are examples of creating strings in Python.

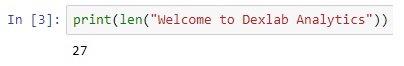
Counting Number of Characters Using LEN () Function

The LEN () built-in function counts the number of characters in the string.

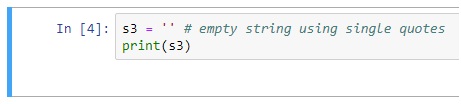
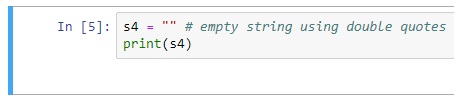
Creating Empty Strings

Although variables S3 and S4 do not contain any characters they are still valid strings. S3 and S4 both represent empty strings here.

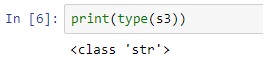
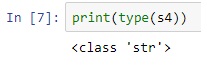
We can verify this fact by using the type () function.

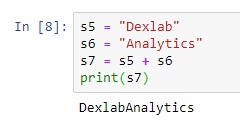
String Concatenation

String concatenation means joining one or more strings together. To concatenate strings in Python we use + operator.

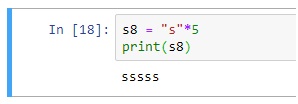
String Repetition Operator (*)

Just like in numbers, * operator can also be used with strings. When used with strings * operator repeats the string n number of times. Its general format is: 1 string * n,

where n is a number of type int.

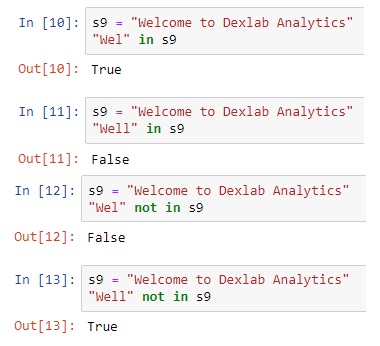
Membership Operators – in and not in

The in or not in operators are used to check the existence of a string inside another string. For example:

Indexing in a String

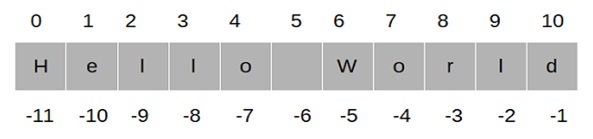
In Python, characters in a string are stored in a sequence. We can access individual characters inside a string by using an index.

An index refers to the position of a character inside a string. In Python, strings are 0 indexed. This means that the first character is at index 0; the second character is at index 1 and so on. The index position of the last character is one less than the length of the string.

To access the individual characters inside a string we type the name of the variable, followed by the index number of the character inside the square brackets [].

Instead of manually counting the index position of the last character in the string, we can use the LEN () function to calculate the string and then subtract 1 from it to get the index position of the last character.

We can also use negative indexes. A negative index allows us to access characters from the end of the string. Negative index starts from -1, so the index position of the last character is -1, for the second last character it is -2 and so on.
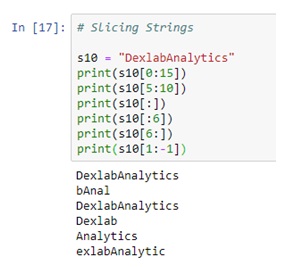
Slicing Strings

String slicing allows us to get a slice of characters from the string. To get a slice of string we use the slicing operator. Its syntax is:

str_name[start_index:end_index]

str_name[start_index:end_index] returns a slice of string starting from index start_index to the end_index. The character at the end_index will not be included in the slice. If end_index is greater than the length of the string then the slice operator returns a slice of string starting from start_index to the end of the string. The start_index and end_index are optional. If start_index is not specified then slicing begins at the beginning of the string and if end_index is not specified then it goes on to the end of the string. For example:

Apart from these functionalities, there are so many built-in methods for strings which make the string as the useful data type of Python. Some of the common built-in methods are as follows: –

capitalize ()

Capitalizes the first letter of the string

join (seq)

Merges (concatenates) the string representations of elements in sequence seq into a string, with separator string.

lower ()

Converts all the letters in a string that are in uppercase to lowercase.

max (str)

Returns the max alphabetical character from the string str.

min (str)

Returns the min alphabetical character from the string str.

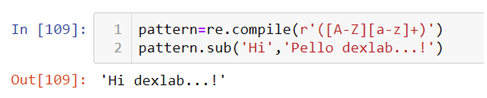
replace (old, new [, max])

Replaces all the occurrences of old in a string with new or at most max occurrences if max gave.

 split (str=””, num=string.count(str))

Splits string according to delimiter str (space if not provided) and returns list of substrings; split into at most num substrings if given.

upper()

Converts lowercase letters in a string to uppercase.

Conclusion

So in this article, firstly, we have seen a brief introduction of all the data types of python. Later in this article, we focused on the strings. We have seen several Python operations on strings as well as the most common useful built-in methods of strings.

Python is the language of the present age, wherein almost every field there is a need for Python. For example, Python for data analysisMachine Learning Using Python has been easy and comprehensible than they were ever before. Thus, if you are also interested in Python and looking for promising courses Computer Vision Course PythonRetail Analytics using PythonNeural Network Machine Learning Python, then get in touch with Dexlab Analytics now and step into the world of opportunities!


Interested in a career in Data Analyst?

To learn more about Data Analyst with Advanced excel course – Enrol Now.
To learn more about Data Analyst with R Course – Enrol Now.
To learn more about Big Data Course – Enrol Now.

To learn more about Machine Learning Using Python and Spark – Enrol Now.
To learn more about Data Analyst with SAS Course – Enrol Now.
To learn more about Data Analyst with Apache Spark Course – Enrol Now.
To learn more about Data Analyst with Market Risk Analytics and Modelling Course – Enrol Now.

Python Statistics Fundamentals: How to Describe Your Data? (Part II)

Python Statistics Fundamentals: How to Describe Your Data? (Part II)

In the first part of this article, we have seen how to describe and summarize datasets and how to calculate types of measures in descriptive statistics in Python. It’s possible to get descriptive statistics with pure Python code, but that’s rarely necessary.

Python is an advanced programming language extensively used in all of the latest technologies of Data Science, Deep Learning and Machine learning. Furthermore, it is particularly responsible for the growth of the Machine Learning course in IndiaMoreover, numerous courses like Deep Learning for Computer vision with Python, Text Mining with Python course and Retail Analytics using Python are pacing up with the call of the age. You must also be in line with the cutting-edge technologies by enrolling with the best Python training institute in Delhi now, not to regret it later.

In this part, we will see the Python statistics libraries which are comprehensive, popular, and widely used especially for this purpose. These libraries give users the necessary functionality when crunching data. Below are the major Python libraries that are used for working with data.

Data Science Machine Learning Certification

NumPy and SciPy – Fundamental Scientific Computing

NumPy stands for Numerical Python. The most powerful feature of NumPy is the n-dimensional array. This library also contains basic linear algebra functions, Fourier transforms, advanced random number capabilities. NumPy is much faster than the native Python code due to the vectorized implementation of its methods and the fact that many of its core routines are written in C (based on the CPython framework).

For example, let’s create a NumPy array and compute basic descriptive statistics like mean, median, standard deviation, quantiles, etc.

SciPy stands for Scientific Python, which is built on NumPy. NumPy arrays are used as the basic data structure by SciPy.

Scipy is one of the most useful libraries for a variety of high-level science and engineering modules like discrete Fourier transforms, Linear Algebra, Optimization and Sparse matrices. Specifically in statistical modelling, SciPy boasts of a large collection of fast, powerful, and flexible methods and classes. It can run popular statistical tests such as t-test, chi-square, Kolmogorov-Smirnov, Mann-Whitney rank test, Wilcoxon rank-sum, etc. It can also perform correlation computations, such as Pearson’s coefficient, ANOVA, Theil-Sen estimation, etc.

Pandas – Data Manipulation and Analysis

Pandas library is used for structured data operations and manipulations. It is extensively used for data preparation. The DataFrame() function in Pandas takes a list of values and outputs them in a table. Seeing data enumerated in a table gives a visual description of a data set and allows for the formulation of research questions on the data.

The describe() function outputs various descriptive statistics values, except for the variance. The variance is calculated using the var() function in Pandas.

The mean() function, returns the mean of the values for the requested axis.

Matplotlib – Plotting and Visualization

Matplotlib is a Python library for creating 2D plots. It is used for plotting a wide variety of graphs, starting from histograms to line plots to heat plots. One can use Pylab feature in IPython notebook (IPython notebook –pylab = inline) to use these plotting features inline. If the inline option is ignored, then pylab converts IPython environment to an environment, very similar to Matlab.

matplotlib.pylot is a collection of command style functions.

If a single list array is provided to the plot() command, matplotlib assumes it is a sequence of Y values and internally generates the X value for you.

Each function makes some change to a figure, like creating a figure, creating a plotting area in a figure, decorating the plot with labels, etc. Now, let us create a very simple plot for some given data, as shown below:

Scikit-learn – Machine Learning and Data Mining

Scikit-learn built on NumPy, SciPy and matplotlib. Scikit-learn is the most widely used Python library for classical machine learning. But, it is necessary to include it in the discussion of statistical modeling as many classical machine learning (i.e. non-deep learning) algorithms can be classified as statistical learning techniques. This library contains a lot of efficient tools for machine learning and statistical modeling including classification, regression, clustering and dimensional reduction.

Conclusion

In this article, we covered a set of Python open-source libraries that form the foundation of statistical modelling, analysis, and visualization. On the data side, these libraries work seamlessly with the other data analytics and data engineering platforms, such as Pandas and Spark (through PySpark). For advanced machine learning tasks (e.g. deep learning), NumPy knowledge is directly transferable and applicable in popular packages such as TensorFlow and PyTorch. On the visual side, libraries like Matplotlib, integrate nicely with advanced dashboarding libraries like Bokeh and Plotly.


https://pandas.pydata.org/pandas-docs/stable/reference/api/pandas.DataFrame.html


Interested in a career in Data Analyst?

To learn more about Data Analyst with Advanced excel course – Enrol Now.
To learn more about Data Analyst with R Course – Enrol Now.
To learn more about Big Data Course – Enrol Now.

To learn more about Machine Learning Using Python and Spark – Enrol Now.
To learn more about Data Analyst with SAS Course – Enrol Now.
To learn more about Data Analyst with Apache Spark Course – Enrol Now.
To learn more about Data Analyst with Market Risk Analytics and Modelling Course – Enrol Now.

Python Statistics Fundamentals: How to Describe Your Data? (Part I)

Python Statistics Fundamentals: How to Describe Your Data?

Statistics is a branch of mathematics which deals with the collection, analysis, interpretation and presentation of masses of numerical data. Statistics is a tool used to communicate our understanding of data. It helps us understand the world better, make assertions, and communicate our confidence in the statements we are making.

Two main statistical methods are used in data analysis:

  1. Descriptive statistics: This method is used to summarize data from a sample using measures such as the mean or standard deviation
  2. Inferential statistics: With this method, you can conclude data that are subject to random variation (e.g., observational errors, sampling variation).

This article is about the descriptive statistics which are used to describe and summarize the datasets. We are also going to see the available Python libraries to get those numerical quantities.

This whole topic will be covered in a series of two blogs. This first blog is about the types of measures in descriptive statistics. Furthermore, we will also see the built-in Python “Statistics” library, which has a relatively small number of the most important statistics functions.

Descriptive statistics can be defined as the measures that summarize a given data, and these measures can be broken down further into the measures of central tendency and the measures of dispersion. Measures of central tendency include mean, median, and the mode, while the measures of dispersion include standard deviation and variance.

We will cover the following topics in descriptive statistics:

  • Measures of Central Tendency
  1. Mean
  2. Median
  3. Mode
  • Measures of Dispersion
  1. Variation
  2. Standard Deviation

First, we need to import the Python statistics module.

Mean

The arithmetic mean is the sum of data divided by the number of data-points. It is a measure of the central location of data in a set of values that vary in range. In Python, we usually do this by dividing the sum of given numbers with the count of the number present. Python mean function can be used to calculate the mean/average of the given list of numbers. It returns the mean of the data set passed as parameters.

mean( ): Arithmetic mean (“average”) of data.

harmonic_mean( ): It is the reciprocal of the arithmetic mean of the reciprocals of the data (say for three numbers a, b and c, 1/mean = 3/(1/a + 1/b + 1/c)).

Median

median( ): Median or middle value of data is calculated as the mean of middle two. When the number of data points is odd, the middle data point is returned. The median is a robust measure of a central location and is less affected by the presence of outliers in your data compared to the mean.

median_low( ): Low median of data is calculated when the number of data points is odd. Here the middle value is usually returned. When it is even, the smaller of the two middle values is returned.

median_high( ): High median of data is calculated when the number of data points is odd. Here, the middle value is usually returned. When it is even, the larger of the two middle values is returned.

Mode

mode( ): Mode (most common value) of discrete data. The mode (when it exists) is the most typical value and is a robust measure of central location.

Measures of Dispersion

Measures of dispersion are statistics that describe how data varies, usually relative to the typical value. While measures of centre give us an idea of the typical value, measures of spread give us a sense of how much the data tends to diverge from the typical value.

These following functions (from the statistics module in python) calculate a measure of how much the population or sample tends to deviate from the typical or average values.

Data Science Machine Learning Certification

Population Variance

pvariance( ): Returns the population variance of data. Use this function to calculate the variance from the entire population. To estimate the variance from a sample, the variance ( ) function is usually a better choice. When called with the entire population, this gives the population variance σ². When called on a sample instead, this is the biased sample variance s², also known as variance with N degrees of freedom.

Population Standard Deviation

pstdev( ): Return the population standard deviation (the square root of the population variance)

Sample Variance

variance ( ): Returns the sample variance of data, an iterable of at least two real-valued numbers. Variance, or second moment about the mean, is a measure of the variability (spread or dispersion) of data. A large variance indicates that the data is spread out; a small variance indicates it is clustered closely around the mean. If the optional second argument is given to the function, it should be the mean of data. This is the sample variance s² with Bessel’s correction, also known as variance with N-1 degrees of freedom.

Sample Standard Deviation

stdev( ): Returns the sample standard deviation (the square root of the sample variance)

Conclusion

So, this article focuses on describing and summarizing the datasets, also helping you to calculate numerical quantities in Python. It’s possible to get descriptive statistics with pure Python code, but that’s rarely necessary. In the next series of this blog we will see the Python statistics libraries which are comprehensive, popular, and widely used especially for this purpose.


Interested in a career in Data Analyst?

To learn more about Data Analyst with Advanced excel course – Enrol Now.
To learn more about Data Analyst with R Course – Enrol Now.
To learn more about Big Data Course – Enrol Now.

To learn more about Machine Learning Using Python and Spark – Enrol Now.
To learn more about Data Analyst with SAS Course – Enrol Now.
To learn more about Data Analyst with Apache Spark Course – Enrol Now.
To learn more about Data Analyst with Market Risk Analytics and Modelling Course – Enrol Now.

A Step-by-Step Guide on Python Variables

A Step-by-Step Guide on Python Variables

Variable is the name given to the memory location where data is stored. Once a variable is stored, space is allocated in memory. Variables are named locations that are used to store references to the object stored in memory.

With the rapid rise of the advanced programming techniques, matching with the pacing advancements of Machine Learning and Artificial Intelligence, the need for Python for Data Analysis an Machine Learning Using Python is growing. However, when it comes to trustworthy courses, it is better to go for the best Python Certification Training in Delhi.

Now, coming to this article, here are some of the topics that will be covered in this article:

  • Rules to Define a Variable
  • Assigning Values to a Variable
  • Re-declaring a Variable in Python
  • Variable Scope
  • Deleting a Variable

Data Science Machine Learning Certification

Rules to Define a Variable

These are the few rules to define a python variable:

  1. Python variable name can contain small case letters (a-z), upper case letters (A-Z), numbers (0-9), and underscore (_).
  2. A variable name can’t start with a number.
  3. We can’t use reserved keywords as a variable name.
  4. The variable name can be of any length.
  5. Python variable can’t contain only digits.
  6. The variable names are case sensitive.

Assigning Values to a Variable

There is no need for an explicit declaration to reserve memory. The assignment is done using the equal to (=) operator.

Multiple Assignment in Python

Multiple variables can be assigned to the same variable.

Multi-value Assignment in Python

Multiple variables can be assigned to multiple objects.

Re-declaring a Variable in Python

After declaring a variable, one can again declare it and assign a new value to it. Python interpreter discards the old value and only considers the new value. The type of the new value can be different than the type of the old value.

Variable Scope

A variable scope defines the area of accessibility of the variable in the program. A Python variable has two scopes:

  1. Local Scope
  2. Global Scope

Python Local Variable

When a variable is defined inside a function or a class, then it’s accessible only inside it. They are called local variables and their scope is only limited to that function or class boundary.

If we try to access a local variable outside its scope, we get an error that the variable is not defined.

Python Global Variable

When the variable is not inside a function or a class, it’s accessible from anywhere in the program. These variables are called global variables.

Deleting a Variable

One can delete variable using the command “del”.

In the example below, the variable “d” is deleted by using command Del and when it is further proceeded to print, we get an error “variable name is not defined” which means the variable is already deleted.

Conclusion

In this article we have learned the concepts of Python variables which are used in every program. We also learned the rules associated to the naming of a variable, assigning value to a variable, scope of a variable and deleting a variable.

So, if you are also hooked into Python and looking for the best courses, Python course in Gurgaon is certainly a gem of a course!


This technical blog is sourced from: www.askpython.com and intellipaat.com


Interested in a career in Data Analyst?

To learn more about Data Analyst with Advanced excel course – Enrol Now.
To learn more about Data Analyst with R Course – Enrol Now.
To learn more about Big Data Course – Enrol Now.

To learn more about Machine Learning Using Python and Spark – Enrol Now.
To learn more about Data Analyst with SAS Course – Enrol Now.
To learn more about Data Analyst with Apache Spark Course – Enrol Now.
To learn more about Data Analyst with Market Risk Analytics and Modelling Course – Enrol Now.

Statistical Application in R & Python: Negative Binomial Distribution

Statistical Application in R & Python: Negative Binomial Distribution

Negative binomial distribution is a special case of Binomial distribution. If you haven’t checked the Exponential Distribution, then read through the Statistical Application in R & Python: EXPONENTIAL DISTRIBUTION.

It is important to know that the Negative Binomial distribution could be of two different types, i.e. – Type 1 and Type 2. In many ways, it could be seen as a generalization of the geometric distribution. The Negative Binomial Distribution essentially operates on the same principals as the binomial distribution but the objective of the former is to model for the success of an event happening in “n” number of trials. Here it is worth observing that the Geometric distribution models for the first success whereas a Negative Binomial distribution models for the Kth 

Data Science Machine Learning Certification

This is explained below.

Type 1 Binomial distribution  aims to model the trails up to and including the “kth success” in “n number of trials”. To give a simple example, imagine you are asked to predict the probability that the fourth person to hear a gossip will believe that! This kind of prediction could be made using the negative binomial type 1 distribution. 

Conversely, Type 2 Binomial distribution is used to model the number of failures before the “kth success”. To give an example, imagine you are asked about how many penalty kicks it will take before a goal is scored by a particular football player. This could be modeled using a negative binomial type 2 distribution, which might be pretty tricky or almost impossible with any other methods.

The probability distribution function is given below: 

In the next section, we will take you through its practical application in Python and R. 

Application:

Mr. Singh works in an Insurance Company where his target is to sale a minimum of five policies in a day. On a particular day, he had already sold 2 policies after numerous attempts. The probability of sales on each policy is 0.6. Now, if the policies may be considered as independent Bernoulli trials, then:

  1. What is the probability that he has exactly 4 failed attempts before his 3rd successful sales of the day?
  2. What is the probability that he was fewer than 4 failed attempts before his 3rd successful sales of the day?

So, the number of sales = 3.

The probability of failed attempts is 4.

The success of each sale is 0.6.

Calculate Negative Binomial Distribution in R:

In R, we calculate negative binomial distribution to find the probability of insurance sales. Thus, we get,

  1. The probability that he has exactly 4 failed attempts before his 3rd successful sales are 8.29%.
  2. The probability that he has fewer than 4 failed attempts before his 3rd successful sales is 82.08%.

Hence, we can see that chances are quite high that Mr. Singh will succeed in making a sale after 4 failed attempts.

Calculate Negative Binomial Distribution in Python:

In Python, we get the same results as above.

Conclusion:

Negative Binomial distribution is the discrete probability distribution that is actually used for calculating the success and failure of any observation. When applied to real-world problems, the outcomes of the successes and failures may or may not be the outcomes we ordinarily view as good and bad, respectively.

Suppose we used the negative binomial distribution to model the number of days a certain machine works before it breaks down. In this case, “success” would be the days that the machine worked properly, whereas the day when the machine breaks down would be a “failure”. Another example would be, if we used the negative binomial distribution to model the number of attempts an athlete makes on goal before scoring r goals, though, then each unsuccessful attempt would be a “success”, and scoring a goal would be “failure”.

This blog will surely aid in developing a better understanding of how negative binomial distribution works in practice. If you have any comments please leave them below. Besides, if you are interested in catching up with the cutting edge technologies, then reach the premium training institute of Data Science and Machine Learning leading the market with the top-notch Machine Learning course in India.


Interested in a career in Data Analyst?

To learn more about Data Analyst with Advanced excel course – Enrol Now.
To learn more about Data Analyst with R Course – Enrol Now.
To learn more about Big Data Course – Enrol Now.

To learn more about Machine Learning Using Python and Spark – Enrol Now.
To learn more about Data Analyst with SAS Course – Enrol Now.
To learn more about Data Analyst with Apache Spark Course – Enrol Now.
To learn more about Data Analyst with Market Risk Analytics and Modelling Course – Enrol Now.

Call us to know more