Analytics Archives - DexLab Analytics | Big Data Hadoop SAS R Analytics Predictive Modeling & Excel VBA

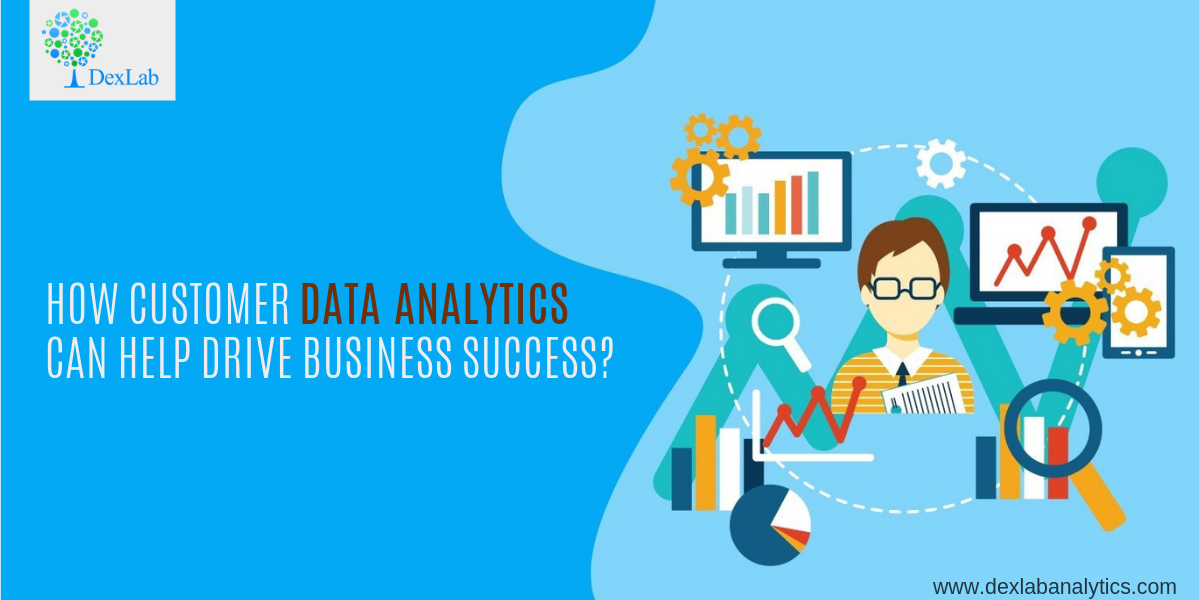
How Customer Data Analytics Can Help Drive Business Success?

How Customer Data Analytics Can Help Drive Business Success?

The customers are the backbone of a successful organization. No longer does one-size-fits-all kind of advertising or price-based competition reap results. Today, if you want a thriving business, customer interaction is the key. Building relationships based on that interaction will get you going.

Nevertheless, this isn’t enough. To survive in this contemporary competitive world, enterprises need data-driven, powerful insights that will help them comprehend their customers’ needs. The world is rapidly developing and so is the technology domain. Tech bigwigs, including Airbnb and Uber, are utilizing the nuanced concept of data analysis to reshape their way of interaction with the customers; so let’s dive down to know how they are putting their customer’s first and leveraging data analytics in a collective manner.

2

Segmentation

This step divides customer data into segments, for example, age, location, buying pattern, product usage, etc. It helps in messaging information to particular groups interested in particular activities. Tailor-made marketing strategies are in demand.

Segmentation also helps you decide which group is profitable and which isn’t. This way, you and your organization won’t end up wasting money on sections that are not likely to yield conversions.

Product Development

To stay ahead of the curve, your products need to be customized. This is done by gathering customer data from detailed reports or with the help of A/B testing.  You can also look up to customer feedback. It helps in determining chances for innovation and gauges the efficacy levels of the products.

Companies, such as Amazon and Netflix use data analytics effectively to understand the preferences of customers and craft recommendation list accordingly.

Agility

Instead of finding new customers, the companies are now focusing more on customer retention. In order to do so, the company executives are channelizing resources to keep their existing customers loyal to them. Nevertheless, this is no mean feat. A recent report has found out that two-thirds of the B2B customer base or even more are currently at risk. Hence, customer retention is a better alternative than luring newer customers.  

Innovation

For data-obsessed people, innovation is the lifeblood for their success. However, it has resulted in disrupting several established companies and industries. Use of chatbots, AI and apps has sparked a phenomenal change in the technology landscape.  Autonomous Vehicles are one of the best examples of disruptive technology, which is a brainchild of Tesla, Google and other path-breaking companies.

Insights Turned into Actions

Irrespective of the industry you work at, customer data analytics helps you tap into your customer’s choices and behaviors and predict how that pattern is going to modify in the future. It might aid you in understanding why customers leave giving you enough room to target retention programs at those who are at more risk of leaving.

No wonder, more and more companies are becoming data-centric. Nevertheless, out of all, very few have actually worked out the best way to use the data and hit notes of business success. Remember, insights are only effective when they trigger change!

Are you interested in customer analytics? Want to enroll in a good marketing analytics certification course? DexLab Analytics is here for help! Feel free to drop by their website and send enquiries. The expert team of the institute will be happy to guide you.


The blog first appeared in ― www.entrepreneur.com/article/310001


Interested in a career in Data Analyst?

To learn more about Data Analyst with Advanced excel course – Enrol Now.
To learn more about Data Analyst with R Course – Enrol Now.
To learn more about Big Data Course – Enrol Now.

To learn more about Machine Learning Using Python and Spark – Enrol Now.
To learn more about Data Analyst with SAS Course – Enrol Now.
To learn more about Data Analyst with Apache Spark Course – Enrol Now.
To learn more about Data Analyst with Market Risk Analytics and Modelling Course – Enrol Now.


Demand for Data Analysts is Skyrocketing – Explained

Demand for Data Analysts is Skyrocketing - Explained

The salary of analytics professionals outnumbers that of software engineers by more than 26%. The wave of big data analytics is taking the world by storm. If you follow the latest studies, you will discover that there has been a prominent growth in median salary over several experience levels in the past three years (2016 to 2018). In 2019, the average analytics salary has been capped at 12.6 lakh per annum.

The key takeaway is that the salary structure of analytics professionals continues to beat other tech-related job roles. In fact, data analysts are found out-earning their Java correspondents by nearly 50% in India alone. A latest survey provides an encompassing view of base and compensation salaries in data science along with median salaries followed across diverse job categories, regions, education profiles, experience, tools and skills.

In this regard, a spokesperson of a prominent data analytics learning institute was found saying, “The demand for AI skills is expected to increase rapidly, which is also reflected by the fact that AI engineers command a higher salary than peers.” She further added, “Many of our clients have realized that investing in data-driven skills at the leadership level is a determining factor for the success of digital and AI initiatives in the organization. With the increasing adoption of digital technologies, we expect an enduring growth of Data Science and AI initiatives to offer exciting and lucrative career options to new age professionals,”

Over time, we are witnessing how markets are evolving while the demand for skilled data scientists is following an upward trend. It is not only the technology firms that are posting job offers, but the change is also evident across industries, like retail, medical, retail and CPG amongst others. These sectors are enhancing their analytical capabilities implying an automatic increase in the number of data-centric jobs and recruitment of data scientists.

Points to Consider:

  • In the beginning, nearly 76% of data analysts earn 6-lakh figure per annum.
  • The average analytics salary observed in 2018-19 is 12.6 lakh.
  • In terms of analytics career, Mumbai offers the highest compensation of 13.7 lakh yearly, followed by Bangalore at 13 lakh.
  • Mid-level professionals proficient in data analytics are more in demand.
  • Knowing Python is an added advantage; Python Programming training will help you earn more. Expect a package of 15.1 lakh.
  • Nevertheless, we often see a pay disparity for female data scientists against their male counterparts. While women’s take-home salary is 9.2 lakh, male from the same designation and profession earns 13.7 lakh per annum.

2

As endnotes, the demand for data science skills is skyrocketing. If you want to enter into this flourishing job market, this is the best time! Enroll in a good data analyst course in Delhi and mould your career in the shape of success! DexLab Analytics is a top-notch data analyst training institute that offers a plethora of in-demand skill training courses. Reach us for more.


This article has been sourced fromwww.tribuneindia.com/news/jobs-careers/data-analytics-professionals-ride-the-big-data-wave/759602.html


Interested in a career in Data Analyst?

To learn more about Data Analyst with Advanced excel course – Enrol Now.
To learn more about Data Analyst with R Course – Enrol Now.
To learn more about Big Data Course – Enrol Now.

To learn more about Machine Learning Using Python and Spark – Enrol Now.
To learn more about Data Analyst with SAS Course – Enrol Now.
To learn more about Data Analyst with Apache Spark Course – Enrol Now.
To learn more about Data Analyst with Market Risk Analytics and Modelling Course – Enrol Now.

Transforming Construction Industry With Big Data Analytics

Transforming Construction Industry With Big Data Analytics

Big Data is reaping benefits in the construction industry, especially across four domains – decision-making, risk reduction, budgeting and tracking and management. Interestingly, construction projects involve a lot of data. Prior to big data, the data was mostly siloed, unstructured and gathered on paper.

However, today, the companies are better equipped to utilize the power of big data and employ it in a better way. They can now easily capture data with the help of numerous high-end devices and transform the processes. In a nutshell, the result of implementing big data analytics is positive and everybody involved is enjoying the benefits – namely improved decision-making, higher productivity, better jobsite safety and minimum risks.

Moreover, using the previous data, construction companies now can predict future outcomes and focus on projects that are expected to be successful. All this makes big data the most trending tool of the construction industry and for all the right reasons. The sole challenge is, however, how businesses adopt these robust changes.

2

Reduce Costs via Optimization

To stay relevant and maintain a competitive edge, continuous optimization of numerous processes is important. Big data lends a helping hand to ensure the efficacy of such processes by keeping a track of all the processes from first to the very last step – making them quick and productive. With big data technology, companies can easily understand the areas where improvements are required and devise the best strategy.

Needless to say, the primary focus of optimization is to reduce costs and unnecessary downtime. Big Data is by far tackling this concern well.

Worker’s Productivity is Important

Generally, when we discuss productivity in the construction industry, it mostly concerns technology and machines – leaving behind a crucial factor, humans. Big data takes into account each worker’s productivity. It is no big deal to track their work progress. In fact, it will help increase their productivity and boost efficiency.

Furthermore, when a lot of data is at hand, companies can even analyze how their workers are interacting to discover ways to enhance their efficiency levels by replacing tools and technologies.

The Role of Data Sharing

The construction industry is brimming with data. There is so much data here that it needs another capable organization to handle such vast piles of information. Among other things, companies need to share information with their stakeholders. They also need to strategize this data for better accessibility.

Ultimately, the main task of these companies is to eliminate data silos if they really want to savor the potentials of this powerful technology to the fullest. Till date, they have been successful.

In a nutshell, we can say that big data is positively impacting the whole construction industry and is more likely to expand its horizons in the next few years. However, the companies need to learn how to imbibe this cutting edge technology to enjoy its enormous benefits and sail towards the tides of success – because big data is here to stay for long!

DexLab Analytics is a phenomenal Big Data Hadoop institute in Delhi NCR that is well-known for its in-demand skill training courses. If you are thinking of getting your hands on Hadoop certification in Delhi, this is the place to go. For more details, drop by our website.


The blog has been sourced from —  www.analyticsinsight.net/how-big-data-is-changing-construction-industry

Interested in a career in Data Analyst?

To learn more about Data Analyst with Advanced excel course – Enrol Now.
To learn more about Data Analyst with R Course – Enrol Now.
To learn more about Big Data Course – Enrol Now.

To learn more about Machine Learning Using Python and Spark – Enrol Now.
To learn more about Data Analyst with SAS Course – Enrol Now.
To learn more about Data Analyst with Apache Spark Course – Enrol Now.
To learn more about Data Analyst with Market Risk Analytics and Modelling Course – Enrol Now.
Big Data Enhances Remote IT Support: Here’s How

Big Data Enhances Remote IT Support: Here’s How

Big data is the backbone of modern businesses. All their decisions are data driven. Firstly, information is aggregated from various sources, like customer viewing pattern and purchasing behavior. After this, the data is analyzed and then actionable insights are generated. Nowadays, most companies rely on some type of business intelligence tool. All in all, information collection is increasing exponentially.

However, in many cases the desire for information has gone too far. The recent scandal involving Facebook and Cambridge Analytica stands as an example. It has left people very insecure about their online activities. Fears regarding violation of privacy are rising; people are worried that their data is being monitored constantly and even used without their awareness. Naturally, everyone is pushing for improved data protection. And we’re seeing the results too – General Data Protection Regulation (GDPR) in EU and the toughening of US Data Regulations is only the beginning.

Although data organization and compliance have always been the foundation of IT’s sphere of activity, still businesses are lagging behind in utilizing big data in remote IT support. They have started using big data to enhance their services only very recently.

2

Advantages of data-directed remote IT support

The IT landscape has undergone a drastic change owing to the rapid advancement of technology. The rate at which devices and software packages are multiplying, Desktop Management is turning out to be a nightmarish task. Big data can help IT departments manage this situation better.

Managing complexity and IT compliance

The key reasons behind maximum number of data breaches are user errors and missing patches. Big data is very useful in verifying if endpoints are on conformity with IT policies, which in turn can help prevent such vulnerabilities and keep a check on networks.

Troubleshooting and minimizing time-to-resolution

Data can be utilized to develop a holistic picture of network endpoints, ensuring the helpdesk process is more competent. By offering deeper insight into networks, big data allows technicians to locate root causes behind ongoing issues instead of focusing on recurring symptoms. The direct effect of this is an increase in first-call-resolution. It also helps technicians to better diagnose user problems.

Better end-user experience

Having in-depth knowledge about all the devices of a network means that technicians don’t have to control an end-user’s system to solve the issue. Also, this enables the user to continue working uninterrupted while the technician takes care of the problem from behind-the-scene. Thus, IT can offer a remedy even before the user recognizes there’s a problem. For example, a team engaged in collection of network data may notice that few devices need to be updated, which they can perform remotely.

Better personalization without damaging control

IT teams have always found it difficult to manage provisioning models, like BYOD (bring your own device) and COPE (corporate owned, personally enabled). But with the help of big data, IT teams can divide end users based on their job roles and also support the various provisioning models without compromising with control. Moreover, they constantly receive feedback, allowing them keep to a check on any form of abuse, unwanted activities and any changes in the configuration of a system.

Concluding:

In short, the organization as a whole benefits from data-directed remote support. IT departments can improve on their delivery service as well as enhance end-user experience. It gives users more flexibility, but doesn’t hamper security of IT teams. Hence, in this age of digital revolution, data-driven remote support can be a powerful weapon to improve a company’s performance.

Knowing how to handle big data is the key to success in all fields of work. That being said, candidates seeking excellent Big Data Hadoop training in Gurgaon should get in touch with DexLab Analytics right away! This big data training center in Delhi NCR offer courses with comprehensive syllabus focused on practical training and delivered by professionals with excellent domain experience.

 
Reference: https://channels.theinnovationenterprise.com/articles/how-big-data-is-improving-remote-it-support
 

Interested in a career in Data Analyst?

To learn more about Data Analyst with Advanced excel course – Enrol Now.
To learn more about Data Analyst with R Course – Enrol Now.
To learn more about Big Data Course – Enrol Now.

To learn more about Machine Learning Using Python and Spark – Enrol Now.
To learn more about Data Analyst with SAS Course – Enrol Now.
To learn more about Data Analyst with Apache Spark Course – Enrol Now.
To learn more about Data Analyst with Market Risk Analytics and Modelling Course – Enrol Now.
Big Data and Its Use in the Supply Chain

Big Data and Its Use in the Supply Chain

Data is indispensable, especially for modern business houses. Every day, more and more businesses are embracing digital technology and producing massive piles of data within their supply chain networks. But of course, data without the proper tools is useless; the emergence of big data revolution has made it essential for business honchos to invest in robust technologies that facilitate big data analytics, and for good reasons.

Quality Vs Quantity

The overwhelming volumes of data exceed the ability to analyze that data in a majority of organizations. This is why many supply chains find it difficult to gather and make sense of the voluptuous amount of information available across multiple sources, processes and siloed systems. As a result, they struggle with reduced visibility into the processes and enhanced exposure to cost disruptions and risk.

To tackle such a situation, supply chains need to adopt comprehensive advanced analytics, employing cognitive technologies, which ensure improved visibility throughout their enterprises. An initiative like this will win these enterprises a competitive edge over those who don’t.

2

Predictive Analytics

 A striking combination of AI, location intelligence and machine learning is wreaking havoc in the data analytics industry. It is helping organizations collect, store and analyze huge volumes of data and run cutting edge analytics programs. One of the finest examples is found in drone imagery across seagrass sites.

Thanks to predictive analytics and spatial analysis, professionals can now realize their expected revenue goals and costs from a retail location that is yet to come up. Subject to their business objectives, consultants can even observe and compare numerous potential retail sites, decrypting their expected sales and ascertain the best possible location. Also, location intelligence helps evaluate data, regarding demographics, proximity to other identical stores, traffic patterns and more, and determine the best location of the new proposed site.

The Future of Supply Chain

Talking from a logistic point of view, AI tools are phenomenal – IoT sensors are being ingested with raw data with their aid and then these sensors are combined with location intelligence to formulate new types of services that actually help meet increasing customer demands and expectations. To prove this, we have a whip-smart AI program, which can easily pinpoint the impassable roads by using hundreds and thousands of GPS points traceable from an organization’s pool of delivery vans. As soon as this data is updated, route planners along with the drivers can definitely avoid the immoderate missteps leading to better efficiency and performance of the company.

Moreover, many logistics companies are today better equipped to develop interesting 3D Models highlighting their assets and operations to run better simulations and carry a 360-degree analysis. These kinds of models are of high importance in the domain of supply chains. After all, it is here that you have to deal with the intricate interplay of processes and assets.

Conclusion

 Since the advent of digital transformation, organizations face the growing urge to derive even more from their big data. As a result, they end up investing more on advanced analytics, local intelligence and AI across several supply chain verticals. They make such strategic investments to deliver efficient service across the supply chains, triggering higher productivity and better customer experience.

With a big data training center in Delhi NCR, DexLab Analytics is a premier institution specializing in in-demand skill training courses. Their industry-relevant big data courses are perfect for data enthusiasts.

 
The blog has been sourced from ―  www.forbes.com/sites/yasamankazemi/2019/01/29/ai-big-data-advanced-analytics-in-the-supply-chain/#73294afd244f
 

Interested in a career in Data Analyst?

To learn more about Data Analyst with Advanced excel course – Enrol Now.
To learn more about Data Analyst with R Course – Enrol Now.
To learn more about Big Data Course – Enrol Now.

To learn more about Machine Learning Using Python and Spark – Enrol Now.
To learn more about Data Analyst with SAS Course – Enrol Now.
To learn more about Data Analyst with Apache Spark Course – Enrol Now.
To learn more about Data Analyst with Market Risk Analytics and Modelling Course – Enrol Now.
Big Data to Cure Alzheimer’s Disease

Big Data to Cure Alzheimer’s Disease

Almost 44 million people across the globe suffer from Alzheimer’s disease. The cost of the treatment amounts to approximately one percent of the global GDP. Despite cutting-edge developments in medicine and robust technology upgrades, prior detection of neurodegenerative disorder, such as Alzheimer’s disease remains an upfront challenge. However, a breed of Indian researchers has assayed to apply big data analytics to look for early signs of the Alzheimer’s in the patients.

The whip-smart researchers from the NBRC (National Brain Research Centre), Manesar have come up with a fierce big data analytics framework that will implement non-invasive imaging and other test data to detect diagnostic biomarkers in the early stages of Alzheimer’s.

The Hadoop-powered data framework integrates data from brain scans in the format of non-invasive tests – magnetic resonance spectroscopy (MRS), magnetic resonance imaging (MRI) and neuropsychological test results – by employing machine learning, data mining and statistical modeling algorithms, respectively.

2

The framework is designed to address the big three Vs – Variety, Volume and Velocity. The brain scans conducted using MRS or MRI yields vast amounts of data that is impossible to study manually or analyze data of multiple patients to determine if any pattern is emerging. As a result, machine learning is the key. It boosts the process, says Dr Pravat Kumar Mandal, a chief scientist of the research team.

To know more about the machine learning course in India, follow DexLab Analytics. This premier institute also excels in offering state of the art big data courses in Delhi – take a look at their course itinerary and decide for yourself.

The researchers are found using data about diverse aspects of the brain – neurochemical, structural and behavioural – accumulated through MRS, MRI and neuropsychological mediums. These attributes are ascertained and classified into collectives for clear diagnosis by doctors and pathologists. The latest framework is regarded as a multi-modalities-based decision framework for early detection of Alzheimer’s, clinicians have noted in their research paper published in journal Frontiers in Neurology. The project has been termed BHARAT and has been dealing with the brain scans of Indians.

The new framework integrates unstructured and structured data, processing, storage, and possesses the ability to analyze volumes and volumes of complex data. For that, it leverages the skills of parallel computing, data organization, scalable data processing and distributed storage techniques, besides machine learning. Its multi-modal nature helps in classifying between healthy old patients with mild cognitive impairment and those suffering from Alzheimer’s.

Other such big data tools for early diagnostics are only based on MRI images of patients. Our model incorporates neurochemical-like antioxidant glutathione depletion analysis from brain hippocampal regions. This data is extremely sensitive and specific. This makes our framework close to the disease process and presents a realistic approach,” says Dr Mandal.

As endnotes, the research team comprises of Dr Mandal, Dr Deepika Shukla, Ankita Sharma and Tripti Goel, and the research is supported by the adept Ministry of Department of Science and Technology. The forecast predicts the number of patients diagnosed with Alzheimer is expected to cross 115 million-mark by 2050. Soon, this degenerative neurological disease will pose a huge burden on the economies of various countries; hence it’s of paramount importance to address the issue now and in the best way possible.


The blog has been sourced from www.thehindubusinessline.com/news/science/big-data-may-help-get-new-clues-to-alzheimers/article26111803.ece


Interested in a career in Data Analyst?

To learn more about Data Analyst with Advanced excel course – Enrol Now.
To learn more about Data Analyst with R Course – Enrol Now.
To learn more about Big Data Course – Enrol Now.

To learn more about Machine Learning Using Python and Spark – Enrol Now.
To learn more about Data Analyst with SAS Course – Enrol Now.
To learn more about Data Analyst with Apache Spark Course – Enrol Now.
To learn more about Data Analyst with Market Risk Analytics and Modelling Course – Enrol Now.

Introducing Scala and Spark for Seamless Big Data Analysis

Introducing Scala and Spark for Seamless Big Data Analysis

Application of Big Data through network clusters has become the order of the day. Multiple industries are embracing this new trend. The elaborate use of Hadoop and MapReduce justifies the popularity of this evolving phenomenon. What’s more, the rise of Apache Spark, an incredible data processing engine written in Scala programming language also lends proof.

Introducing Scala

Somewhat similar to Java programming, Scala is a generic object-oriented programming language. Also known as Scalable Language, Scala is a multi-purpose language with capabilities to grow along the lines of many requirements. The capabilities range from an ordinary scripting language to a mission-critical language for complex applications. A wide number of technologies are being built on this robust platform.

2

Why Scala?

  • It supports functional programming equipped with features, such as immutability, pattern matching, type interference, lazy evaluation and currying.
  • It includes an advanced type system – with algebraic data types.
  • It helps you explore features that are not available in Java, including raw strings, operator overloading and named parameters.

Besides, Scala runs on Java Virtual Machine (JVM) and endorses cluster computing on Spark.

Introducing Apache Spark

An open source big data processing framework, Apache Spark offers a sound interface for fast processing of huge datasets. It aids in programming data clusters using fault tolerance and data parallelism.

Since 2009, more than 200 companies and 1000 developers have been leveraging Apache Spark and the numbers are still on the rise.

Features of Spark

Comprehensive Framework

Apache Spark is a unified framework ideal for managing big data processing. It also aids a diverse range of datasets, such as batch data, text data, graphical data and real-time streaming data.

Easy to Use

Spark lets programmers write Scala, Java or Python applications – thanks to its built-in set of more than 80 A-grade operators.

Fast and Effective

Talking of speed, Spark runs programs up to 100 X faster than Hadoop clusters in memory and 10 X quicker while running on disk. Powered by a cutting-edge DAG (Directed Acrylic Graph) execution engine, Spark enhances cyclic data flow and in-memory data sharing across DAGs for smoother execution of different jobs but with similar data.

Robust Support

Along with managing MapReduce operations, Spark offers support for streaming data, graphic data processing, SQL queries and machine learning.

Flexibility

Besides Scala programming language, programmers can leverage Python, R, Java and Clojure for developing ace applications using Spark.

Platform-independent

Spark applications are run either in the cloud or on a distinctive cluster mode. Spark can be employed as an individual server or as a part of the distributed framework, like YARN or MESOS. It gives access to versatile data structures, such as HBase, HDFS, Hive, Cassandra and similar Hadoop data sources.

Encompassing Library Support

Are you a Spark programmer? Fuse together additional libraries within the same application and enhance big data and analytics capabilities.

Some of the supported libraries are as follows:

  • Spark SQL
  • Spark GraphX
  • BlinkDB
  • Spark MLib
  • Tachyon
  • Spark R
  • Spark Cassandra Connector

As parting thoughts, Apache Spark is the perfect alternative to MapReduce – for installations. The former effortlessly tackles humongous volumes of data that need low latency processing.

DexLab Analytics is a refined Apache Spark training institute in Gurgaon. The comprehensive courses, on-point faculty and flexible batch timings make this institute the best pick for Apache Spark training Gurgaon. For more information, reach us at dexlabanalytics.com.


The blog has been sourced from  —  www.knowledgehut.com/blog/big-data/analysis-of-big-data-using-spark-and-scala


Interested in a career in Data Analyst?

To learn more about Data Analyst with Advanced excel course – Enrol Now.
To learn more about Data Analyst with R Course – Enrol Now.
To learn more about Big Data Course – Enrol Now.

To learn more about Machine Learning Using Python and Spark – Enrol Now.
To learn more about Data Analyst with SAS Course – Enrol Now.
To learn more about Data Analyst with Apache Spark Course – Enrol Now.
To learn more about Data Analyst with Market Risk Analytics and Modelling Course – Enrol Now.

What Does a Business Analyst Do: Job Responsibilities and More!

What Does a Business Analyst Do: Job Responsibilities and More!

A flamboyant, sophisticated technology lashed with a heavy stroke of sci-fi, AI and machine learning – is today’s data science. To manage, control and understand such an elusive concept, we need highly skilled data specialists – they must have mastered thoroughly the art and science of machine learning, analytics and statistics.

As the world is becoming more dynamic, the roles of data analysts and professionals are found to be increasingly inclined towards precision, versatility and eccentricity. More and more, they are expected to do things differently, posing as catalysts for change. They play an incredible role in inspiring others and bringing accuracy and accountability within an organization.

2

Data Analysts Facilitate Solutions for Stakeholders

“Business analysis involves understanding how organizations function to accomplish their purposes and defining the capabilities an organization requires to provide products and services to external stakeholders,” shares International Institute of Business Analysis in its BABOK Guide.

The main job of a business analyst is to understand the current situation of a company and facilitate a respective solution to the problem. Mostly, a team of analysts work with the stakeholders to define their business goals and extract what they expect to be delivered. They gather a long range of business-fulfilled conditions and capabilities, document them in a collection and then eventually frame and strategize a plausible solution.

Analysts Have a Multifaceted Job Role

Mostly, they wear many hats as the tasks of analysts are widely versatile and always changing. Below, we have mentioned a few most common job responsibilities they have to perform every day:

  • Understand and analyze business needs
  • Address a business problem
  • Construe information from stakeholders
  • Fulfill model requirements
  • Facilitate solutions
  • Project management
  • Project development
  • Ensure quality testing

Enjoy a smooth learning experience from a reputed analytics training institute in DelhiDexLab Analytics!

The Title ‘Business Analyst’ Hardly Matters

As a matter of fact, the title ‘business analyst’ doesn’t matter much. To fulfill the role of a ‘business analyst’, you don’t have to an analyst at the first place. Many execute the tasks as part of their existing role – data analysts, user experience specialists, change managers and process analysts – each one of them can feature business analyst behaviour.

Put simply, you don’t have to be a business analyst to do the job of a business analyst.

Business Analysts Act As Interpreters

As always, different stakeholders have different goals, needs and knowledge regarding their businesses. Stakeholders can be anyone – managers to end users, vendors to customers, developers to testers, subject matter experts, architects and more. So, it depends on the analysts to bring together all this knowledge and analyze the information gathered. This, in turn, offers a clear understanding of company goals and vision. It bridges the gap between the business and IT.

For this and more, business analysts are often compared with interpreters. Just the way the latter translates French into English – analysts too translate their stakeholders’ query and needs into a language that IT professionals can easily grasp.

Hope this comprehensive list of thoughts has helped you understand what analysts do in general!

If you want to become a data analyst or interested in the study of analytics, drop by DexLab Analytics. They are a one-stop-destination to grab data analyst certification. For more, reach us at dexlabanalytics.com


 The blog has been sourced from ― elabor8.com.au/what-does-a-business-analyst-actually-do


Interested in a career in Data Analyst?

To learn more about Data Analyst with Advanced excel course – Enrol Now.
To learn more about Data Analyst with R Course – Enrol Now.
To learn more about Big Data Course – Enrol Now.

To learn more about Machine Learning Using Python and Spark – Enrol Now.
To learn more about Data Analyst with SAS Course – Enrol Now.
To learn more about Data Analyst with Apache Spark Course – Enrol Now.
To learn more about Data Analyst with Market Risk Analytics and Modelling Course – Enrol Now.

Private Banks, Followed by E-commerce and Telecom Industry Shows High Adoption Rates for Data Analytics

Private Banks, Followed by E-commerce and Telecom Industry Shows High Adoption Rates for Data Analytics

Are you looking for a data analyst job? The chances of bagging a job at a private bank are more than that a public bank. The former is more likely to hire you than the latter.

As a matter of fact, data analytics is widely being used in the private banking and e-commerce sectors – according to a report on the state of data analytics in Indian business. The veritable report was released last month by Analytics India Magazine in association with the data science institute INSOFE. Next to banking and ecommerce, telecom and financial service sectors have started to adopt the tools of data analytics on a larger scale, the report mentioned.

The report was prepared focusing on 50 large firms across myriad sectors, namely Maruti Suzuki and Tata Motors in automobiles, ONGC and Reliance Industries under oil-drilling and refineries, Zomato and Paytm under e-commerce tab, and HDFC and the State Bank of India in banking.

2

If you follow the study closely, you will discover that in a nutshell, data analytics and data science boasts of a healthy adoption rate all throughout – 64% large Indian firms has started implementing this wonder tool at their workplaces. As a fact, if a firm is found to have an analytics penetration rate of minimum 0.75% (which means, at least one analytics professional is found out of 133 employees in a company), we can say the company has adopted analytics.

Nevertheless, the rate of adoption was not universal overall. We can see that infrastructure firms have zero adoption rates – this might be due to a lack of resources to power up a robust analytics facility or whatever. Also, steel, power and oil exhibited low adoption rates as well with not even 40% of the surveyed firms crossing the 0.75% bar. On contrary, private banks and telecom industry showed a total 100% adoption rates.

Astonishingly, public sector banks showed a 50% adoption rate- almost half of the rate in the private sector.

The study revealed more and more companies in India are looking forward to data analytics to boost sales and marketing initiatives. The tools of analytics are largely employed in the sales domain, followed by finance and operations.

Apparently, not much of the results were directly comparable with that of the last year’s study. Interestingly, one metric – analytics penetration rate – was measured last year as well, which is nothing but the ratio of analytics-oriented employees to the total. Also, last year, you would have found one out of 59 employees in an average organization, which has now reached one data analyst for every 36 employees.

For detailed information, read the full blog here: qz.com/india/1482919/banks-telcos-e-commerce-firms-hire-most-data-analysts-in-india

If you are interested in following more such interesting blogs and technology-related updates, follow DexLab Analytics, a premium analytics training institute headquartered in Gurgaon, Delhi. Grab a data analyst certification today and join the bandwagon of success.


Interested in a career in Data Analyst?

To learn more about Data Analyst with Advanced excel course – Enrol Now.
To learn more about Data Analyst with R Course – Enrol Now.
To learn more about Big Data Course – Enrol Now.

To learn more about Machine Learning Using Python and Spark – Enrol Now.
To learn more about Data Analyst with SAS Course – Enrol Now.
To learn more about Data Analyst with Apache Spark Course – Enrol Now.
To learn more about Data Analyst with Market Risk Analytics and Modelling Course – Enrol Now.

Call us to know more