Advanced Analytics and Data Science Archives - DexLab Analytics | Big Data Hadoop SAS R Analytics Predictive Modeling & Excel VBA

ARMA- Time Series Analysis Part 4

ARMA Time series DexLab Analytics

ARMA(p,q) model in time series forecasting is a combination of Autoregressive  Process also known as AR Process and Moving Average (MA) Process where p corresponds to the autoregressive part and q corresponds to the moving average part.


Autoregressive Process (AR) :- When the value of Yt in a time series data is regressed over its own past value then it is called an autoregressive process where p is the order of lag into consideration.

Where,

Yt = observation which we need to find out.

α1= parameter of an autoregressive model

Yt-1= observation in the previous period

ut= error term

The equation above follows the first order of autoregressive process or AR(1) and the value of p is 1. Hence the value of Yt in the period ‘t’ depends upon its previous year value and a random term.

Moving Average (MA) Process :- When the value of Yt  of order q in a time series data depends on the weighted sum of current and the q recent errors i.e. a linear combination of error terms then it is called a moving average process which can be written as :-

yt = observation which we need to find out

α= constant term

βut-q= error over the period q .

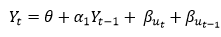
ARMA (Autoregressive Moving Average) Process :-

The above equation shows that value of Y in time period ‘t’ can be derived by taking into consideration the order of lag p which in the above case is 1 i.e. previous year’s observation and the weighted average of the error term over a period of time q which in case of the above equation is 1.

How to decide the value of p and q?

Two of the most important methods to obtain the best possible values of p and q are ACF and PACF plots.

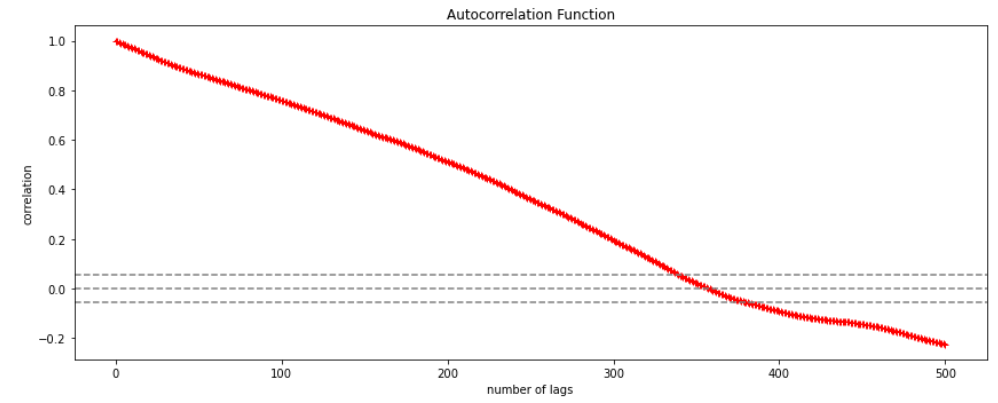
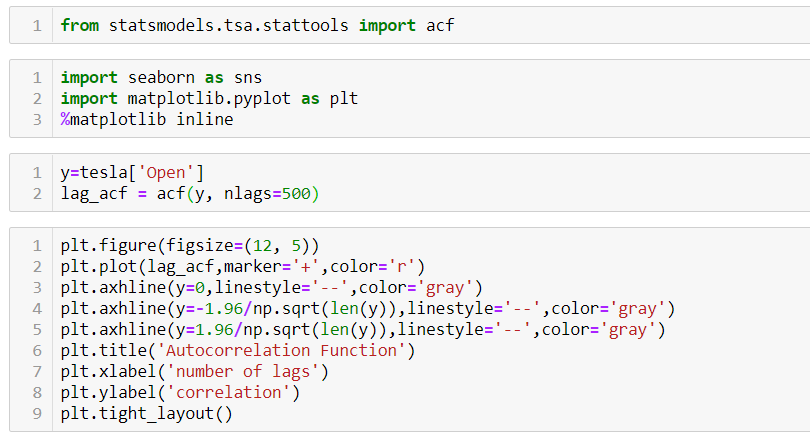
ACF (Auto-correlation function) :- This function calculates the auto-correlation of the complete data on the basis of lagged values which when plotted helps us choose the value of q that is to be considered to find the value of Yt. In simple words how many years residual can help us predict the value of Yt can obtained with the help of ACF, if the value of correlation is above a certain point then that amount of lagged values can be used to predict Yt.

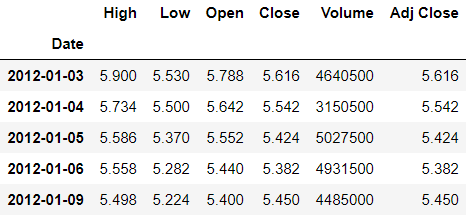
Using the stock price of tesla between the years 2012 and 2017 we can use the .acf() method in python to obtain the value of p.

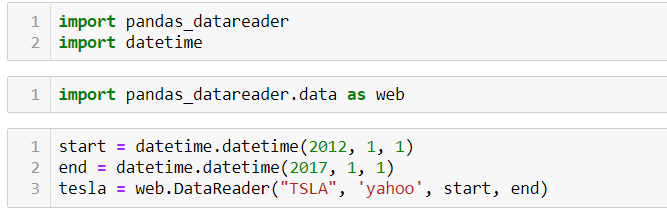
.DataReader() method is used to extract the data from web.

The above graph shows that beyond the lag 350 the correlation moved towards 0 and then negative.

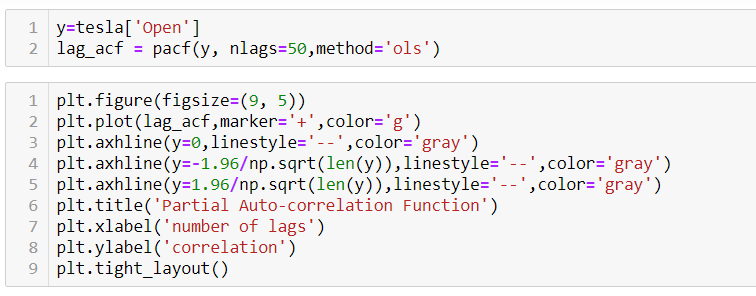
PACF (Partial auto-correlation function) :- Pacf helps find the direct effect of the past lag by removing the residual effect of the lags in between. Pacf helps in obtaining the value of AR where as acf helps in obtaining the value of MA i.e. q. Both the methods together can be use find the optimum value of p and q in a time series data set.

Lets check out how to apply pacf in python.

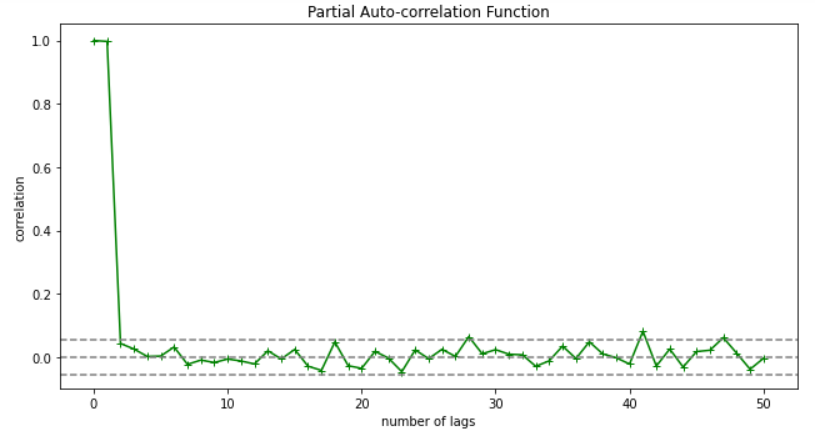
As you can see in the above graph after the second lag the line moved within the confidence band therefore the value of p will be 2.


So, with that we come to the end of the discussion on the ARMA Model. Hopefully it helped you understand the topic, for more information you can also watch the video tutorial attached down this blog. The blog is designed and prepared by Niharika Rai, Analytics Consultant, DexLab Analytics DexLab Analytics offers machine learning courses in Gurgaon. To keep on learning more, follow DexLab Analytics blog.


.

Time Series Analysis & Modelling with Python (Part II) – Data Smoothing

dexlab_time_series

Data Smoothing is done to better understand the hidden patterns in the data. In the non- stationary processes, it is very hard to forecast the data as the variance over a period of time changes, therefore data smoothing techniques are used to smooth out the irregular roughness to see a clearer signal.

In this segment we will be discussing two of the most important data smoothing techniques :-

  • Moving average smoothing
  • Exponential smoothing

Moving average smoothing

Moving average is a technique where subsets of original data are created and then average of each subset is taken to smooth out the data and find the value in between each subset which better helps to see the trend over a period of time.

Lets take an example to better understand the problem.

Suppose that we have a data of price observed over a period of time and it is a non-stationary data so that the tend is hard to recognize.

QTR (quarter)Price
110
211
318
414
515
6?


In the above data we don’t know the value of the 6th quarter.

….fig (1)

The plot above shows that there is no trend the data is following so to better understand the pattern we calculate the moving average over three quarter at a time so that we get in between values as well as we get the missing value of the 6th quarter.

To find the missing value of 6th quarter we will use previous three quarter’s data i.e.

MAS =  = 15.7

QTR (quarter)Price
110
211
318
414
515
615.7

MAS =  = 13

MAS =  = 14.33

QTR (quarter)PriceMAS (Price)
11010
21111
31818
41413
51514.33
615.715.7


….. fig (2)

In the above graph we can see that after 3rd quarter there is an upward sloping trend in the data.

Exponential Data Smoothing

In this method a larger weight ( ) which lies between 0 & 1 is given to the most recent observations and as the observation grows more distant the weight decreases exponentially.

The weights are decided on the basis how the data is, in case the data has low movement then we will choose the value of  closer to 0 and in case the data has a lot more randomness then in that case we would like to choose the value of  closer to 1.

EMA= Ft= Ft-1 + (At-1 – Ft-1)

Now lets see a practical example.

For this example we will be taking  = 0.5

Taking the same data……

QTR (quarter)Price

(At)

EMS Price(Ft)
11010
211?
318?
414?
515?
6??


To find the value of yellow cell we need to find out the value of all the blue cells and since we do not have the initial value of F1 we will use the value of A1. Now lets do the calculation:-

F2=10+0.5(10 – 10) = 10

F3=10+0.5(11 – 10) = 10.5

F4=10.5+0.5(18 – 10.5) = 14.25

F5=14.25+0.5(14 – 14.25) = 14.13

F6=14.13+0.5(15 – 14.13)= 14.56

QTR (quarter)Price

(At)

EMS Price(Ft)
11010
21110
31810.5
41414.25
51514.13
614.5614.56

In the above graph we see that there is a trend now where the data is moving in the upward direction.

So, with that we come to the end of the discussion on the Data smoothing method. Hopefully it helped you understand the topic, for more information you can also watch the video tutorial attached down this blog. The blog is designed and prepared by Niharika Rai, Analytics Consultant, DexLab Analytics DexLab Analytics offers machine learning courses in Gurgaon. To keep on learning more, follow DexLab Analytics blog.


.

ANOVA Part-II: What is Two-way ANOVA?

ANOVA Part-II What is Two-way ANOVA

In my previous blog, I have already introduced you to a statistical term called ANOVA and I have also explained you what one-way ANOVA is? Now in this particular blog I will explain the meaning of two-way ANOVA.

The below image shows few tests to check the relationship/variation among variables or samples. When it comes to research analysis the first thing that we should do is to understand the sample which we have and then try to disintegrate the dataset to form and understand the relationship between two or more variables to derive some kind of conclusion. Once the relation has been established, our job is to test that relationship between variables so that we have a solid evidence for or against them. In case we have to check for variation among different samples, for example if the quality of seed is affecting the productivity we have to test if it is happening by chance or because of some reason. Under these kind of situations one-way ANOVA comes in handy (analysis on the basis of a single factor).

Two-way ANOVA

Two-way ANOVA is used when we are testing the variations among samples on the basis two factors. For example testing variation on the basis of seed quality and fertilizer.

Hopefully you have understood what Two-way ANOVA is. If you need more information, check out the video tutorial attached down the blog. Keep on following the DexLab Analytics blog, to find more information about Data Science, Artificial Intelligence. DexLab Analytics offers data Science certification courses in gurgaon.


.

What Role Does A Data Scientist Play In A Business Organization?

What Role Does A Data Scientist Play In A Business Organization?

The job of a data scientist is one that is challenging, exciting and crucial to an organization’s success.  So, it’s no surprise that there is a rush to enroll in a Data Science course, to be eligible for the job. But, while you are at it, you also need to have the awareness regarding the job responsibilities usually bestowed upon the data scientists in a business organization and you would be surprised to learn that the responsibilities of a data scientist differs from that of a data analyst or, a data engineer.

So, what is the role and responsibility of a data scientist?  Let’s take a look.

The common idea regarding a data scientist role is that they analyze huge volumes of data in order to find patterns and extract information that would help the organizations to move ahead by developing strategies accordingly. This surface level idea cannot sum up the way a data scientist navigates through the data field. The responsibilities could be broken down into segments and that would help you get the bigger picture.

Data management

The data scientist, post assuming the role, needs to be aware of the goal of the organization in order to proceed. He needs to stay aware of the top trends in the industry to guide his organization, and collect data and also decide which methods are to be used for the purpose. The most crucial part of the job is the developing the knowledge of the problems the business is trying solve and the data available that have relevance and could be used to achieve the goal. He has to collaborate with other departments such as analytics to get the job of extracting information from data.

Data analysis

Another vital responsibility of the data scientist is to assume the analytical role and build models and implement those models to solve issues that are best fit for the purpose. The data scientist has to resort to data mining, text mining techniques. Doing text mining with python course can really put you in an advantageous position when you actually get to handle complex dataset.

Developing strategies

The data scientists need to devote themselves to tasks like data cleaning, applying models, and wade through unstructured datasets to derive actionable insight in order to gauge the customer behavior, market trends. These insights help a business organization to decide its future course of action and also measure a product performance. A Data analyst training institute is the right place to pick up the skills required for performing such nuanced tasks.

Collaborating

Another vital task that a data scientist performs is collaborating with others such as stakeholders and data engineers, data analysts communicating with them in order to share their findings or, discussing certain issues. However, in order to communicate effectively the data scientists need to master the art of data visualization which they could learn while pursuing big data courses in delhi along with deep learning for computer vision course.  The key issue here is to make the presentation simple yet effective enough so that people from any background can understand it.

Data Science Machine Learning Certification

The above mentioned responsibilities of a data scientist just scratch the surface because, a data scientist’s job role cannot be limited by or, defined by a couple of tasks. The data scientist needs to be in synch with the implementation process to understand and analyze further how the data driven insight is shaping strategies and to which effect. Most importantly, they need to evaluate the current data infrastructure of the company and advise regarding future improvement. A data scientist needs to have a keen knowledge of Machine Learning Using Python, to be able to perform the complex tasks their job demands.


.

The Data Science Life Cycle

The Data Science Life Cycle

Data Science has undergone a tremendous change since the 1990s when the term was first coined. With data as its pivotal element, we need to ask valid questions like why we need data and what we can do with the data in hand.

The Data Scientist is supposed to ask these questions to determine how data can be useful in today’s world of change and flux. The steps taken to determine the outcome of processes applied to data is known as Data Science project lifecycle. These steps are enumerated here.

  • Business Understanding

Business Understanding is a key player in the success of any data science project. Despite the prevalence of technology in today’s scenario it can safely be said that the “success of any project depends on the quality of questions asked of the dataset.”One has to properly understand the business model he is working under to be able to effectively work on the obtained data.

  • Data Collection

Data is the raison detre of data science. It is the pivot on which data science functions. Data can be collected from numerous sources – logs from webservers, data from online repositories, data from databases, social media data, data in excel sheet format. Data is everywhere. If the right questions are asked of data in the first step of a project life cycle, then data collection will follow naturally.

  • Data Preparation

The available Data set might not be in the desired format and suitable enough to perform analysis upon readily. So the data set will have to be cleaned or scrubbed so to say before it can be analyzed. It will have to be structured in a format that can be analyzed scientifically. This process is also known as Data cleaning or data wrangling. As the case might be, data can be obtained from various sources but it will need to be combined so it can be analyzed.

For this, data structuring is required. Also, there might me some elements missing in the data set in which case model building becomes a problem. There are various methods to conduct missing value and duplicate value treatment.

“Exploratory Data Analysis (EDA) plays an important role at this stage as summarization of clean data helps in identifying the structure, outliers, anomalies and patterns in the data.

These insights could help in building the model.”

  • Data Modelling

This stage is the most, we can say, magical of all. But ensure you have thoroughly gone through the previous processes before you begin building your model. “Feature selection is one of the first things that you would like to do in this stage. Not all features might be essential for making the predictions. What needs to be done here is to reduce the dimensionality of the dataset. It should be done such that features contributing to the prediction results should be selected.”

“Based on the business problem models could be selected. It is essential to identify what is the task, is it a classification problem, regression or prediction problem, time series forecasting or a clustering problem.” Once problem type is sorted out the model can be implemented.

“After the modelling process, model performance measurement is required. For this precision, recall, F1-score for classification problem could be used. For regression problem R2, MAPE (Moving Average Percentage Error) or RMSE (Root Mean Square Error) could be used.”The model should be a robust one and not an overfitted model that will not be accurate.

Data Science Machine Learning Certification

  • Interpreting Data

This is the last and most important step of any Data Science project. Execution of this step should be as good and robust as to produce what a layman can understand in terms of the outcome of the project.“The predictive power of the model lies in its ability to generalise.” 


.

How Company Leaders and Data Scientists Work Together

How Company Leaders and Data Scientists Work Together

Business leaders across platforms are hungrily eyeing data-driven decision making for its ability to transform businesses. But what needs to be taken into account is the opinion of data scientists in the core company teams for they are the experts in the field and whatever they have to say regarding data driven decisions should be the final word in these matters.

“The ideal scenario is all parties in complete alignment. This can be envisioned as a perfect rectangle, with business leaders’ expectations at the top, fully supported by a foundation of data science capabilities — for example, when data science and AI can achieve management’s goal of reducing customer retention costs by automating identification and outreach to at-risk customers,”says a report.

The much sought after rectangle, however, is rarely achieved. “A more workable shape is the rhombus, depicting the push-and-pull of expectations and deliverables.”

Using the power of your company’s data.

Business leaders must have patience with developments on the part of data scientists for what they expect is usually not in sync with the deliverables on the ground.

“Over the last few years, an automaker, for example, dove into data science on leadership’s blind faith that analytics could revolutionize the driver experience. After much trial and error, the results fell far short of adding anything meaningful to what drivers found valuable behind the wheel of a car.”

Appreciate Small Improvements

Also, what must be appreciated are small improvements made impactful. For instance, “slight increases in profitability per customer or conversion rates” are things that should be taken into account despite the fact that they might be modest gains in comparison to what business leaders had invested in analytics. “Applied over a large population of customers, however, those small improvements can yield big results. Moreover, these improvements can lead to gains elsewhere, such as eliminating ineffective business initiatives.”

Healthy Competition

However, it is advisable for business leaders to constantly push their data scientists to strive for more deliverables and improve their tally with a framework of healthy competition in place. In fact, big companies form data science centers of excellence, “while also creating a healthy competitive atmosphere that encourages data scientists to push each other to find the best tools, strategies, and techniques for solving problems and implementing solutions.”

Data Science Machine Learning Certification

Here are three ways to inspire data scientists

  1. Both sides must work togetherTake the example of a data science team with expertise in building models to improve customers’ shopping experiences. “Business leaders might assume that a natural next step is to use AI to enhance all customer service needs.”However, AI and machine learning cannot answer the ‘why’ or ‘how’ of the data insights. Human beings have to delve into those aspects by studying the AI output. And on the other hand, data scientists also must understand why business leaders expect so much from them and how to achieve a middle path with regard to expectations and deliverables.
  2. Gain from past successes and achievements – “There is value in small data projects to build capabilities and understanding and to help foster a data-driven culture.”The best policy for firms to follow is to initially keep modest expectations. After executing and implementing the analytics projects, they should conduct a brutally honest anatomy of the successes and failures, and then build business expectations at the same time as analytics investment.
  3. Let data scientists spell out the delivery of analytics results “Communication around what is reasonable and deliverable given current capabilities must come from the data scientists — not the frontline marketing person in an agency or the business unit leader.” Before signing any contract or deal with a client, it is advisable to allow the client to have a discussion with the data scientists so that there is no conflict of ideas between what the data science team spells out and what the marketing team has in mind. For this, data scientists will have to work on their soft skills and improve their ability to “speak business” regarding specific projects.


.

The link between AI, ML and Data Science

The link between AI, ML and Data Science

The fields of Artificial Intelligence, Machine Learning and Data Science cover a vast area of study and they should not be confused with each other. They are distinct branches of computational sciences and technologies.

Artificial Intelligence

Artificial intelligence is an area of computer science wherein the computer systems are built such that they can perform tasks with the same agility as that done through human intelligence. These tasks range from speech recognition to image recognition and decision making systems among others.

This intelligence in computer systems is developed by human beings using technologies like Natural Processing Language (NLP) or computer vision among others. Data forms an important part of AI systems. Big Data, vast stashes of data generated for computer systems to analyze and study to find patterns in is imperative to Artificial Intelligence. 

Machine learning

Machine learning is a subset of artificial intelligence. Machine learning is used to predict future courses of action based on historical data. It is the computer system’s ability to learn from its environment and improve on its findings.

For instance, if you have marked an email as spam once, the computer system will automatically learn to mark as spam all future emails from that particular address. To construct these algorithms developers need large amounts of data. The larger the data sets, the better the predictions. A subset of Machine Learning is Deep Learning, modeled after the neural networks of the human brain.

Data Science Machine Learning Certification

Data Science:

Data science is a field wherein data scientists derive valuable and actionable insights from large volumes of data. The science is based on tools developed with the knowledge of various subjects like mathematics, computer programming, statistical modeling and machine learning.

The insights derived by data scientists help companies and business organizations grow their business. Data science involves analysis of data and modelling of data among other techniques like data extraction, data exploration, data preparation and data visualization. As data volumes grow more and more vast, the scope of data science is also growing each passing day, data that needs to be analyzed to grow business.

Data Science, Machine Learning and Artificial Intelligence

Data Science, Artificial Intelligence and Machine Learning are all related in that they all rely on data. To process data for Machine Learning and Artificial Intelligence, you need a data scientist to cull out relevant information and process it before feeding it to predictive models used for Machine Learning. Machine Learning is the subset of Artificial Intelligence – which relies on computers understanding data, learning from it and making decisions based on their findings of patterns (virtually impossible for the human eye to detect manually) in data sets. Machine Learning is the link between Data Science and Artificial Intelligence. Artificial Intelligence uses Machine Learning to help Data Science get solutions to specific problems.

The three technological fields are thus, closely linked to each other. For more on this, do not forget to check-out the artificial intelligence certification in Delhi NCR from DexLab Analytics.


.

Skills Data Scientists Must Master in 2020

Skills Data Scientists Must Master in 2020

Big data is all around us, be it generated by our news feed or the photos we upload on social media. Data is the new oil and therefore, today, more than ever before, there is a need to study, organize and extract knowledgeable and actionable insights from it. For this, the role of data scientists has become even more crucial to our world. In this article we discuss the various skills, both technical and non-technical a data scientist needs to master to acquire a standing in a competitive market.

Technical Skills

Python and R

Knowledge of these two is imperative for a data scientist to operate. Though organisations might want knowledge of only one of the two programming languages, it is beneficial to know both. Python is becoming more popular with most organisations. Machine Learning using Python is taking the computing world by storm.

GitHub

Git and GitHub are tools for developers and data scientists which greatly help in managing various versions of the software. “They track all changes that are made to a code base and in addition, they add ease in collaboration when multiple developers make changes to the same project at the same time.”

Preparing for Production

Historically, the data scientist was supposed to work in the domain of machine learning. But now data science projects are being more often developed for production systems. “At the same time, advanced types of models now require more and more compute and storage resources, especially when working with deep learning.”

Cloud

Cloud software rules the roost when it comes to data science and machine learning. Keeping your data on cloud vendors like AWS, Microsoft Azure or Google Cloud makes it easily accessible from remote areas and helps quickly set up a machine learning environment. This is not a mandatory skill to have but it is beneficial to be up to date with this very crucial aspect of computing.

Deep Learning

Deep learning, a branch of machine learning, tailored for specific problem domains like image recognition and NLP, is an added advantage and a big plus point to your resume. Even if the data scientist has a broad knowledge of deep learning, “experimenting with an appropriate data set will allow him to understand the steps required if the need arises in the future”. Deep learning training institutes are coming up across the globe, and more so in India.

Math and Statistics

Knowledge of various machine learning techniques, with an emphasis on mathematics and algebra, is integral to being a data scientist. A fundamental grounding in the mathematical foundation for machine learning is critical to a career in data science, especially to avoid “guessing at hyperparameter values when tuning algorithms”. Knowledge of Calculus linear algebra, statistics and probability theory is also imperative.

SQL

Structured Query Language (SQL) is the most widely used database language and a knowledge of the same helps data scientist in acquiring data, especially in cases when a data science project comes in from an enterprise relational database. “In addition, using R packages like sqldf is a great way to query data in a data frame using SQL,” says a report.

AutoML

Data Scientists should have grounding in AutoML tools to give them leverage when it comes to expanding the capabilities of a resource, which could be in short supply. This could deliver positive results for a small team working with limited resources.

Data Visualization

Data visualization is the first step to data storytelling. It helps showcase the brilliance of a data scientist by graphically depicting his or her findings from data sets. This skill is crucial to the success of a data science project. It explains the findings of a project to stakeholders in a visually attractive and non-technical manner.

Non-Technical Skills

Ability to solve business problems

It is of vital importance for a data scientist to have the ability to study business problems in an organization and translate those to actionable data-driven solutions. Knowledge of technical areas like programming and coding is not enough. A data scientist must have a solid foundation in knowledge of organizational problems and workings.

Effective business communication

A data scientist needs to have persuasive and effective communication skills so he or she can face probing stakeholders and meet challenges when it comes to communicating the results of data findings. Soft skills must be developed and inter personal skills must be honed to make you a creatively competent data scientist, something that will set you apart from your peers.

Data Science Machine Learning Certification

Agility

Data scientist need to be able to work with Agile methodology in that they should be able to work based on the Scrum method. It improves teamwork and helps all members of the team remain in the loop as does the client. Collaboration with team members towards the sustainable growth of an organization is of utmost importance.

Experimentation

The importance of experimentation cannot be stressed enough in the field of data science. A data scientist must have a penchant for seeking out new data sets and practise robustly with previously unknown data sets. Consider this your pet project and practise on what you are passionate about like sports.


.

Netflix develops in own data science management tool and open sources it

Netflix develops in own data science management tool and open sources it

Netflix in December last year introduced its own python framework called Metaflow. It was developed to apply to data science with a vision to make scalability a seamless proposition. Metaflow’s biggest strength is that it makes running the pipeline (constructed as a series of steps in a graph) easily movable from a stationary machine to cloud platforms (currently only the Amazon Web Services (AWS)).

What does Metaflow really do? Well, it primarily “provides a layer of abstraction” on computing resources. What it translates to is the fact that a programmer can concentrate on writing/working code while Metaflow will handle the aspect which ensures the code runs on machines.

Metaflow manages and oversees Python data science projects addressing the entire data science workflow (from prototype to model deployment), works with various machine learning libraries and amalgamates with AWS.

Machine learning and data science projects require systems to follow and track the trajectory and development of the code, data, and models. Doing this task manually is prone to mistakes and errors. Moreover, source code management tools like Git are not at all well-suited to doing these tasks.

Metaflow provides Python Application Programming Interfaces (APIs) to the entire stack of technologies in a data science workflow, from access to the data, versioning, model training, scheduling, and model deployment, says a report.

Netflix built Metaflow to provide its own data scientists and developers with “a unified API to the infrastructure stack that is required to execute data science projects, from prototype to production,” and to “focus on the widest variety of ML use cases, many of which are small or medium-sized, which many companies face on a day to day basis”, Metaflow’s introductory documentation says.

Data Science Machine Learning Certification

Metaflow is not biased. It does not favor any one machine learning framework or data science library over another. The video-streaming giant deploys machine learning across all aspects of its business, from screenplay analysis, to optimizing production schedules and pricing. It is bent on using Python to the best limits the programming language can stretch. For the best Data Science Courses in Gurgaon or Python training institute in Delhi, you can check out the Dexlab Analytics courses online.


Interested in a career in Data Analyst?

To learn more about Data Analyst with Advanced excel course – Enrol Now.
To learn more about Data Analyst with R Course – Enrol Now.
To learn more about Big Data Course – Enrol Now.

To learn more about Machine Learning Using Python and Spark – Enrol Now.
To learn more about Data Analyst with SAS Course – Enrol Now.
To learn more about Data Analyst with Apache Spark Course – Enrol Now.
To learn more about Data Analyst with Market Risk Analytics and Modelling Course – Enrol Now.

Call us to know more