Understanding Credit Risk: Definition and Types
Introduction
In March 2021, a little-known family office called Archegos Capital Management defaulted on margin calls from its banks. Within days, Credit Suisse lost $5.5 billion. Nomura lost close to $2.5 billion. Morgan Stanley and UBS lost roughly $1 billion and $774 million. Combined, global banks lost more than $10 billion — not because of a market crash, but because of one counterparty’s concentrated, hidden leverage.
That’s credit risk in its purest form. It’s the possibility that someone you’ve extended money or exposure to won’t pay it back, and the cascading damage that follows when large exposures go bad at once.
Most people equate credit risk with loan defaults. That’s only part of the picture. Credit risk shows up in derivatives, trade settlements, corporate bonds, and interbank lending. It appears anywhere one party depends on another to deliver.
This guide breaks down what credit risk actually means. It covers the distinct types every risk professional needs to recognize, and how banks measure and manage it in practice, in India and globally.
What is Credit Risk?
Credit risk is the possibility that a borrower or counterparty fails to meet a financial obligation, causing a loss to the lender. That’s the formal definition. In plain terms: it’s the risk that you lend money, extend credit, or enter a contract with someone, and they don’t hold up their end.
The Reserve Bank of India’s Guidance Note on Credit Risk Management frames it more precisely. Credit risk can be an individual transaction risk — the chance that one specific loan goes bad. Or it can be a portfolio risk, which looks at how credit losses behave in aggregate across a bank’s book. A single bad loan is a manageable, expected cost of doing business. Thousands of correlated bad loans, going bad at once because they share a common vulnerability, is a solvency event.
Credit risk isn’t limited to banks lending to individuals or businesses. It appears in:
- Loans and advances — the most familiar form, where a borrower fails to repay principal or interest
- Bonds and fixed-income securities — where an issuer defaults on coupon payments or principal at maturity
- Derivatives contracts — where a counterparty can’t meet its obligations under a swap, option, or forward
- Trade finance and settlement — where one party in a transaction fails to deliver cash or securities as agreed
- Guarantees and letters of credit — where a bank stands behind another party’s obligation and gets called on to pay
Under the Basel framework, credit risk-weighted assets typically make up the largest share of the capital a bank must hold. That’s larger than market risk or operational risk combined, for most commercial banks. This is why understanding credit risk isn’t a niche specialty. It’s the foundation most of banking risk management sits on.
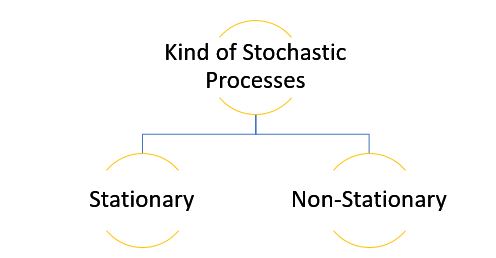
Types of Credit Risk
Credit risk isn’t one uniform threat. RBI’s own framework splits transaction-level credit risk into default risk and rating migration risk. It splits portfolio-level risk into intrinsic risk and concentration risk. Layered on top of that, banking practice recognizes several distinct sub-types worth understanding individually. Three matter most for anyone building a working knowledge of the field: counterparty risk, concentration risk, and settlement risk.
The distinction isn’t academic. Each type demands a different measurement approach, a different mitigation strategy, and often a different team within a bank’s risk function. A credit officer underwriting a retail loan thinks primarily about default risk on that single borrower. A treasury desk trading derivatives thinks primarily about counterparty risk and daily mark-to-market exposure. A chief risk officer reviewing the whole institution thinks about concentration across the entire book. Does the bank have too much riding on one sector, one region, or one large group of related borrowers? Confusing these categories, or managing them with a single generic framework, is exactly how risks that look small individually compound into something systemic.
Counterparty Risk
Counterparty risk is the risk that the other party in a financial contract fails to fulfill their side of the deal. This isn’t a traditional borrower — it’s a trading or derivatives counterparty. It’s especially relevant in derivatives, securities lending, and prime brokerage relationships. There, exposure isn’t a fixed loan amount. It’s a fluctuating mark-to-market value.
The Archegos collapse is the clearest recent illustration. Archegos used total return swaps to build enormous, concentrated positions in a small number of stocks. It never owned the shares directly, and never disclosed the size of its bets. Its prime brokers — Credit Suisse, Nomura, Morgan Stanley, Goldman Sachs, and UBS — each saw only their own slice of Archegos’s exposure. None had visibility into the full picture. When the fund’s portfolio value fell roughly 30% in four days in March 2021, it couldn’t meet margin calls. Its brokers had to liquidate billions of dollars in positions simultaneously. Those unable to exit fast enough absorbed massive losses.
Analysts who studied the collapse point to a specific, technical failure mode: wrong-way risk. This occurs when a bank’s exposure to a counterparty grows precisely as that counterparty’s ability to pay deteriorates. Archegos’s swap exposure ballooned in tandem with its portfolio’s decline. The worse things got, the more the banks were owed, and the less able Archegos was to cover it. The European Central Bank later reviewed 23 major banks’ derivatives exposures. It found “material shortcomings” in how counterparty credit risk was governed across the industry.
Concentration Risk
Concentration risk arises when a bank’s credit exposure clusters too heavily around a single borrower, sector, geography, or risk factor. Diversification is supposed to protect a lender. If one borrower fails, the loss should be a small fraction of the total book. Concentration undermines that protection entirely.
Archegos illustrates this too, in a second way. The fund’s own portfolio was concentrated in a handful of technology and media stocks. When those specific names fell, there was no offsetting position to cushion the blow. The losses hit every position at once. Banks face the mirror image of this problem in lending. Heavy exposure to one industry, real estate for instance, or one large corporate group, means a single sector downturn can impair a disproportionate share of the loan book. RBI’s prudential framework directly addresses this. It sets single-borrower and group-borrower exposure limits specifically to prevent Indian banks from building the kind of concentrated exposure that made Archegos so dangerous to its lenders.
Settlement Risk
Settlement risk is sometimes called Herstatt risk, after the 1974 collapse of Bankhaus Herstatt. It’s the risk that one party in a transaction delivers its side — cash or securities — while the counterparty fails to deliver theirs. This typically happens because of timing gaps, or the counterparty’s failure between trade execution and final settlement. Herstatt was shut down by German regulators mid-day. By then it had already received Deutsche Mark payments from counterparties, but it hadn’t yet sent back the US dollars it owed in return. Banks on the other side of those foreign exchange trades lost their payments outright.
That single event reshaped global payments infrastructure. It led directly to the creation of CLS Bank, a settlement system designed specifically to eliminate this timing gap in foreign exchange transactions. CLS does this by settling both legs of a trade simultaneously. Settlement risk remains a live concern anywhere payment and delivery aren’t simultaneous. It’s a reminder that credit risk isn’t only about long-term loans — it can materialize in a transaction that’s supposed to finish within hours.
Default Risk Explained
Default risk sits at the center of every credit risk framework. It’s the risk that a borrower simply stops paying. Understanding what causes defaults, and how professionals frame the probability of one occurring, is foundational to everything else in credit risk modeling.
It’s also the oldest form of credit risk banks have grappled with. Long before derivatives, prime brokerage, or cross-border settlement systems existed, lenders were already trying to predict which borrowers would repay and which wouldn’t. Every other risk type covered in this guide is, in some sense, a more specialized variant of the same underlying question: will the party on the other side of this transaction deliver what they owe? Default risk asks that question in its most direct form, applied to a straightforward loan or credit exposure.
What Causes Defaults
Defaults rarely happen for one isolated reason. They typically result from a mix of factors:
- Cash flow deterioration. A borrower’s income or business revenue falls below what’s needed to service debt. For individuals, this might mean job loss. For corporates, it might mean a demand shock or margin compression.
- Over-leverage. A borrower takes on more debt than their income can realistically support, leaving no buffer when conditions turn even mildly unfavorable.
- Macroeconomic shocks. Recessions, interest rate spikes, or sector-wide downturns push otherwise healthy borrowers into distress simultaneously — the mechanism behind concentration risk turning into realized losses.
- Governance and fraud. Misrepresented financials, diverted funds, or outright fraud can turn an apparently strong borrower into a default risk overnight. Archegos itself is a governance case as much as a market one — Bill Hwang was later convicted on fraud and racketeering charges tied to how the fund misled its own counterparties about position size and concentration.
- Willful default. Occasionally, a borrower who can pay simply chooses not to, usually when the cost of default (reputational or legal) is judged lower than the cost of repayment.
The Probability Framework
Rather than treating default as a binary surprise, credit risk professionals model it as a probability. A Probability of Default (PD) is expressed as a percentage likelihood that a borrower defaults within a defined time horizon, typically 12 months for regulatory purposes. A PD of 2% doesn’t mean a specific borrower is “slightly risky.” It means that, across a large pool of similar borrowers, roughly 2 in 100 are expected to default within that window.
This probabilistic framing matters. It converts an unpredictable individual event into something a bank can price, provision for, and manage at portfolio scale. Building a reliable PD estimate is a discipline in its own right — deciding which borrower characteristics matter, which statistical technique to use, and how to validate the result. We cover the full methodology, including logistic regression and survival analysis, in our detailed guide to PD estimation.
What matters at this stage is the underlying logic: default isn’t modeled as a yes/no outcome for an individual borrower. It’s modeled as a rate across a population, calibrated against historical data and adjusted for current conditions.
Credit Risk in International Banking
Credit risk doesn’t stop at national borders, and neither does its regulation. Two frameworks matter most for anyone working in or around Indian banking. One is the International Accounting Standards Board’s approach to credit loss recognition. The other is RBI’s domestic prudential framework.
Why does a domestic Indian bank need to care about an international accounting standard? Because capital markets are global, even when a bank’s loan book isn’t. Foreign investors, rating agencies, and cross-border lenders all benchmark a bank’s provisioning and capital adequacy against international norms, whether or not that bank operates outside India. A framework that looks conservative by domestic standards can still look under-provisioned by global standards. That gap shows up directly in borrowing costs, credit ratings, and investor confidence.
The IASB and IFRS 9
The International Accounting Standards Board (IASB) issued IFRS 9 specifically to fix a weakness exposed by the 2008 financial crisis. The old “incurred loss” model only recognized credit losses after a default had already happened — by which point it was too late for provisions to cushion the blow. IFRS 9 replaced that with an Expected Credit Loss (ECL) model. It requires banks to recognize losses based on forward-looking estimates, before default occurs. IFRS 9 has been adopted across more than 140 jurisdictions worldwide, making it one of the most widely applied accounting standards in global banking.
RBI’s Framework and India’s ECL Transition
India has historically run on a different system: the Income Recognition and Asset Classification (IRAC) norms. These classify loans as standard, sub-standard, doubtful, or loss, based on how many days they’re overdue, and provision accordingly. That’s closer to the old “incurred loss” approach IFRS 9 was designed to replace.
That’s now changing. RBI has confirmed that an ECL-based provisioning framework, with prudential floors, will apply to all Scheduled Commercial Banks from April 1, 2027. Under the new norms, banks will classify financial assets into Stage 1, Stage 2, or Stage 3. That classification depends on assessed credit losses at initial recognition, and at each subsequent reporting date — directly mirroring the IFRS 9 structure used globally.
RBI has also been actively updating its credit risk rules to align with Basel Committee on Banking Supervision (BCBS) standards. In 2026, it revised its counterparty credit risk framework specifically to bring India’s derivatives exposure measurement closer to global norms. That’s a change regulators internationally have prioritized in the years following the Archegos collapse. India’s Capital-to-Risk-Weighted-Assets Ratio (CRAR) requirement of 9% for scheduled commercial banks also exceeds the 8% global Basel III minimum. That reflects RBI’s consistently more conservative capital stance relative to international baselines.
Measuring Credit Risk
Defining and categorizing credit risk only gets a risk team so far. Managing it requires quantifying it — turning a qualitative concern into numbers that inform pricing, provisioning, and capital decisions. Four metrics form the core toolkit.
Probability of Default (PD)
As covered above, PD is the percentage likelihood that a borrower defaults within a set time horizon. It’s typically estimated through logistic regression or survival analysis, using historical repayment data, bureau scores, and financial ratios as inputs. PD is the starting point for nearly every downstream credit risk calculation.
Loss Given Default (LGD)
Default doesn’t automatically mean total loss. LGD measures the proportion of exposure a lender expects to actually lose after accounting for recoveries — collateral liquidation, guarantees, or restructuring. Getting LGD right requires more care than it first appears. It has to reflect the economic recovery rate, discounted for the time value of money and net of recovery costs — not just the raw cash eventually collected. A recovery that takes three years to materialize is worth meaningfully less than the same amount recovered immediately.
Credit Ratings
Credit ratings translate a borrower’s creditworthiness into a standardized letter grade, from investment-grade (AAA down to BBB-) to speculative or junk grades below that. In India, these come from agencies like CRISIL, ICRA, and CARE; internationally, from S&P, Moody’s, and Fitch. Ratings aren’t a substitute for internal PD modeling. But they serve two practical purposes. They give banks an independent, externally validated view of risk. And they directly feed into regulatory risk-weighting under the Basel Standardised Approach, where a lower rating translates into a higher capital charge against that exposure.
Expected Loss and Exposure at Default (EAD)
Exposure at Default (EAD) measures how much a lender is actually on the hook for at the moment a default happens. For revolving credit like credit cards, this can run higher than the current outstanding balance, since distressed borrowers often draw down more of their available limit before defaulting. Combining EAD with PD and LGD produces Expected Loss (EL) — the amount a bank should provision for a given exposure on average. It’s worth noting this combined figure is a standard industry simplification. It assumes PD, LGD, and EAD move independently, which understates risk in downturns, when all three tend to move against the lender simultaneously. Regulators address this specific gap by requiring “downturn” LGD and EAD estimates, rather than accepting benign-cycle averages alone.
Used together, these four metrics let a bank move from “this borrower feels risky” to a specific number. That number can be priced into a loan, provisioned for on the balance sheet, and reported to regulators with a defensible methodology behind it.
Conclusion
Credit risk is broader and more structured than “will this loan get repaid.” It spans counterparty exposure in derivatives, concentration across a portfolio, settlement timing in payments, and default at the level of an individual borrower. Each has distinct causes, distinct historical failures, and distinct measurement approaches. Understanding what is credit risk at this level of detail is the foundation every subsequent risk modeling technique builds on, from PD estimation through to full expected-loss calculation.
The Archegos collapse, the 2027 shift to ECL-based provisioning in India, and RBI’s ongoing alignment with Basel counterparty risk standards all point to the same conclusion. Credit risk management is not static. It evolves in direct response to the failures that expose its gaps.
Explore our Credit Risk Modeling Certification Training to master Risk Analytics. Build the PD, LGD, and EAD models covered here from scratch. Work through India’s transition to ECL provisioning, and learn the model validation techniques practicing risk teams use every day.
.