
We have discussed several times the efficiency of various techniques for selecting a simple random sample from an expansive dataset. With PROC SURVEYSELECT will do the job easily…
proc surveyselect data=large out=sample
	 method=srs   /* simple random sample */
	 rate=.01;   /* 1% sample rate       */
run;
However, let us assume that our data includes a STATE variable, and one would want to guarantee that a random sample includes the precise proportion of observations from each of the states of America.
Basically, one would need a stratified random sample. Yet, again WITH PROC SURVEYSELECT the job can be done easily:
proc surveyselect data=large out=sample1
	method=srs    		/* simple random sample      */
	rate=.01;	 		/* 1% sample rate     */
	strata state  		/* sorted data required      */
	/ alloc=proportional;
run;
When one uses the STRATA statement, the PROC SURVEYSELECT needs the input dataset to be sorted as per the strata column.
If one possesses a SAS/STAT license, one can enjoy the ease of use and flexibility of the PROC SURVEYSELECT. And if that does not satisfy you, then you can also write a little code (if you are an efficiency hog like us), and you can choose a stratified random sample with a highly efficient 2-step BASE SAS program.
Here is how to do so:
With a SAS analytics course one will be able to do a lot more with optimum efficiency.
Step 1:
The PROC FREQ step mentioned herein, reads the LARGE dataset and builds a tiny output dataset, which is named COUNTS and has one column, of the name COUNT and with that 50 rows which is one for each state of US that will be sorted by STATE:
proc freq data=large (keep=state);
	table state / noprint out=Counts (keep=Count);
run;
The LARGE dataset contains 100 million rows and four columns as mentioned below:
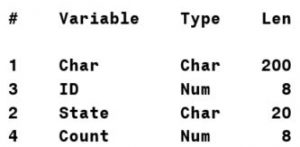
The STATE variable is distributed in almost similar proportions, as is the actual population for each of the state of US. Moreover, the LARGE dataset will be sorted by STATE.
To understand create a LARGE dataset; refer to the end of this blog:
Step 2:
The step of DATA mentioned below will choose a stratified random sample of precisely 1 million rows (1%) from the LARGE dataset, it will be reading only the selected rows and will be bypassing the several other 99 million rows (which is 99 percent), for highly fast performance. As it is with PROC SURVEYSELECT, the LARGE dataset needs to be sorted by the strata column (STATE). And the result will be comparable to PROC SURVEYSELECT outputs:
data sample2; drop Need Pool Ratio Row Jump; set Counts; * One row per strata (US state); Need=round(Count*.01); * 1% sample from each strata; Pool=Count; * Available observations per strata; Jump+Count; * Cumulative count per strata; do until (Need=0); * Continue until no additional rows needed; Row+1; * Row number. Every row is considered; Ratio=Need/Pool; * 1 percent, continuously adjusted; if rand('uniform') < ratio then do; * Random selection; set large point=Row; * Jump to and read selected row; output; * Output selected row; Need=Need-1; * Subtract 1 from needed rows; end; Pool=Pool-1; * Subtract 1 from pool of remaining rows; end; Row=Jump; * JUMP (created above) to the last ROW of the strata; run; |
Running efficiency comparison:
The times mentioned below showcases the averages that are rounded to the nearest second:
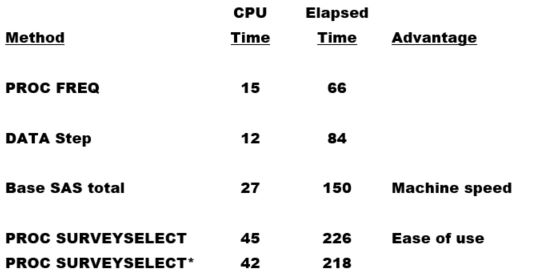
Note that we ran a PROC SURVEYSELECT which is a second time, thereby adding the DROP = option below with the SAMPLE1 output dataset, to lower the variables which have been otherwise created automatically by the PROC SURVEYSELECT.
(drop=AllocProportion SampleSize ActualProportion
 SelectionProb SamplingWeight)
The step of DATA mentioned below will create the LARGE dataset from the dataset STATES.
data large;

	keep ID State Count Char;
	length Char $ 200;
	set states(keep=state percent);

	do ID=1 to 100000000*percent until(count=100000000); * 100M;
		Count+1;
		output;
	end;

run;
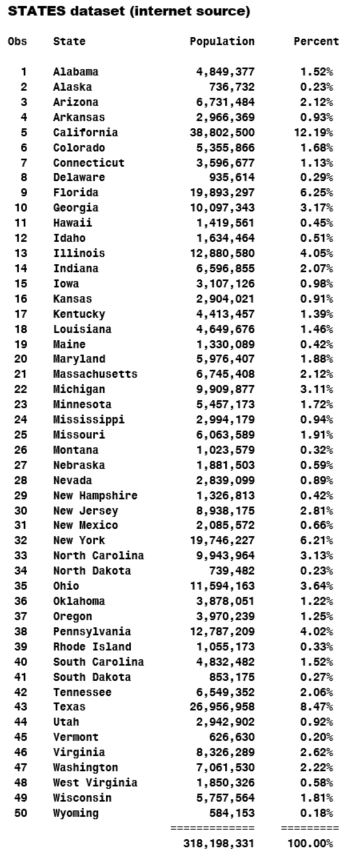
With the DATA step below one can create the STATES dataset:
data states;

   input
   @8 State & : $20.
   Population : comma13.
   Percent    : percent8.;

   format Population comma13. Percent percent9.2;

datalines;
       Copy and paste the below data here.
;
For pursuing a SAS certification for predictive modelling, get in touch with us at DexLab Analytics and get a comprehensive training with the best in industry SAS course.
Interested in a career in Data Analyst?
To learn more about Machine Learning Using Python and Spark – click here.
To learn more about Data Analyst with Advanced excel course – click here.
To learn more about Data Analyst with SAS Course – click here.
To learn more about Data Analyst with R Course – click here.
To learn more about Big Data Course – click here.
online certification, online courses, sas certification, Sas course, SAS Predictive Modelling, SAS training courses, Sas training institute