NBA Finals 1997/98, fought between the Chicago Bulls and Utah Jazz have left many eight-year old boys fantasizing about playing in the championship, some day or the other. Michael Jordan’s legendary shot in game 6 deserved much appreciation.

Though I never dreamt playing in the NBA, but the very thought of how well a player can play under pressure have always caught my attention. I was always inquisitive about how the throwing position of the basketball player Steph Curry affected the level of accuracy. In this blog on predictive modelling, we will discuss about the two of Michael Jordan’s phases, 1996/1997 and 1997/1998 and evaluate how his hit rate was influenced due to pressure.
Also read: SAS Still Dominates the Market After Decades of its Inception
A large pool of data to analyze
The shotchart sheds some light on the statistics of individual players, along with providing access to the so-called “play-by-play” details (Get Game), both of which helps in analyzing individual performances in a game. By merging both the source information, we can conclude how Jordan performed under pressure.
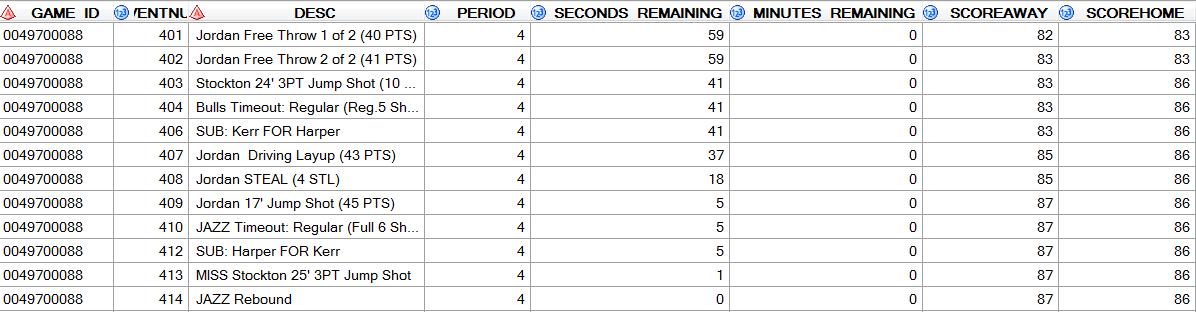
Figure 1: Last minute of the NBA Finals 1997/1998
How to calculate the hit rate under pressure
The main objective of predictive modelling is to develop a model that makes it easier to determine and predict accurately the values of a target or probabilities for events based on numerous factors, like angle, distance, remaining time and score.
Also read: How to Code Colour Values Within SAS Enterprise Guide
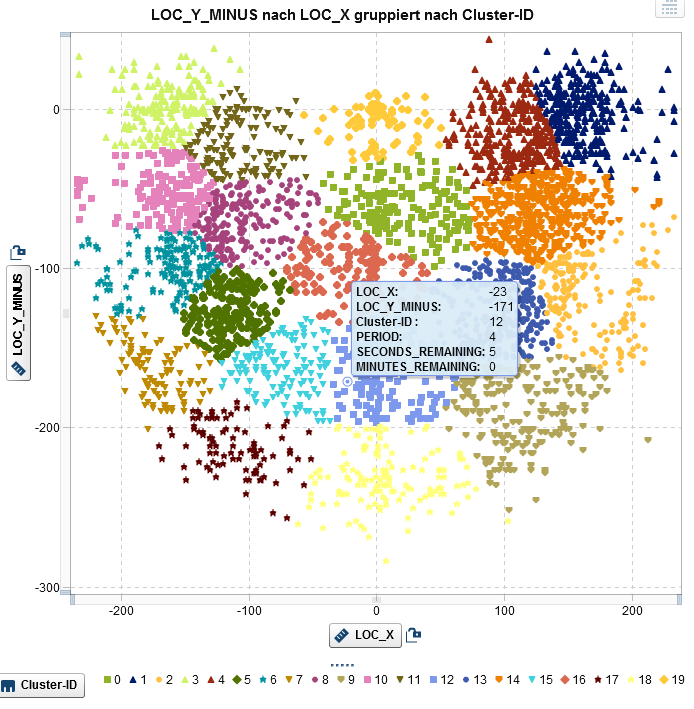
A simple way to determine the throwing position is to divide the playing field into respective segments. Here, we have divided the playing field into 20 clusters using k-means. However, outliers (throws of more than 30 ft) are not included. Each segment can be integrated into the model as input factors.
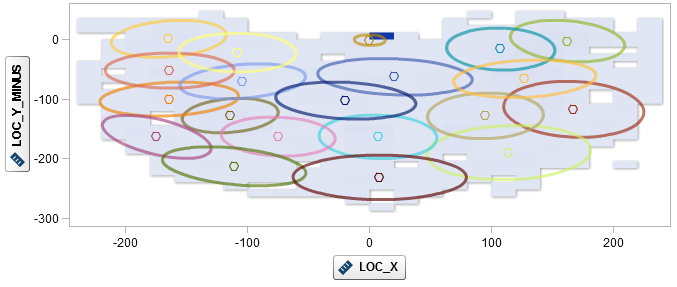
Figure 2: Throwing tests results of Jordan in the 1996/97 and 1997/98 season
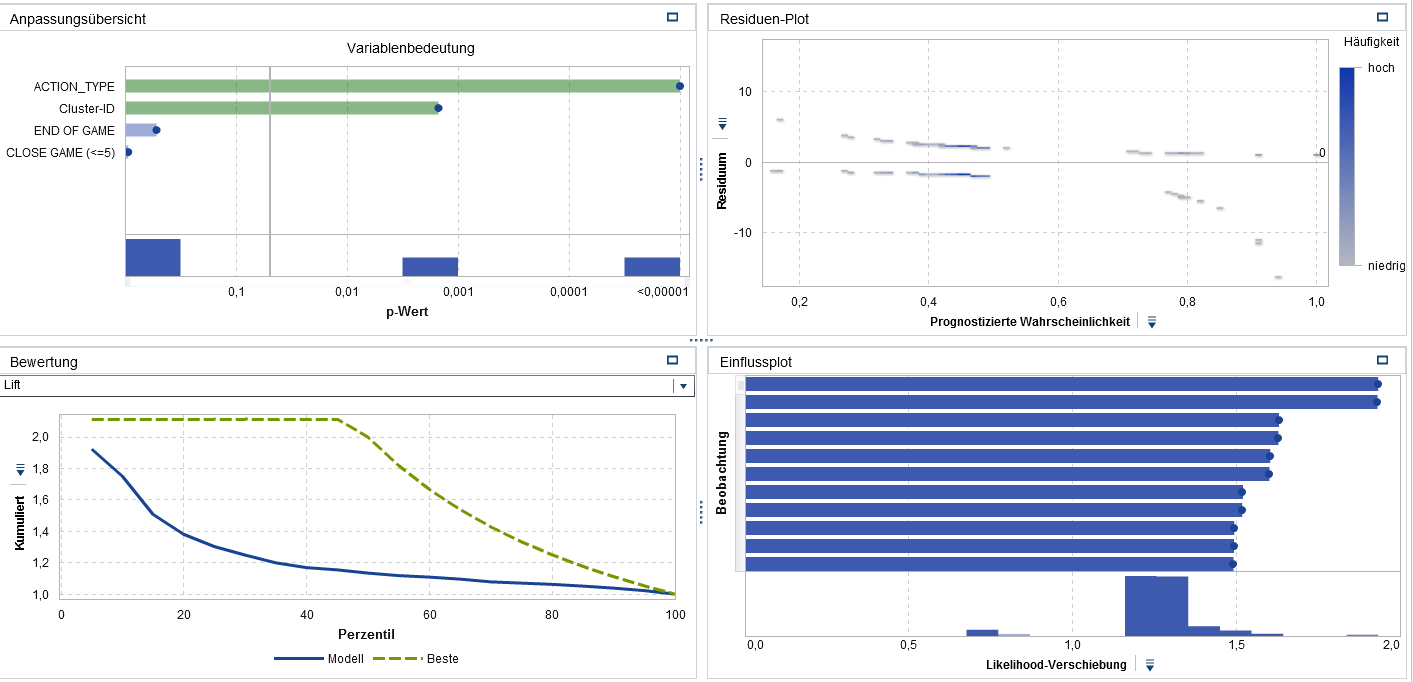
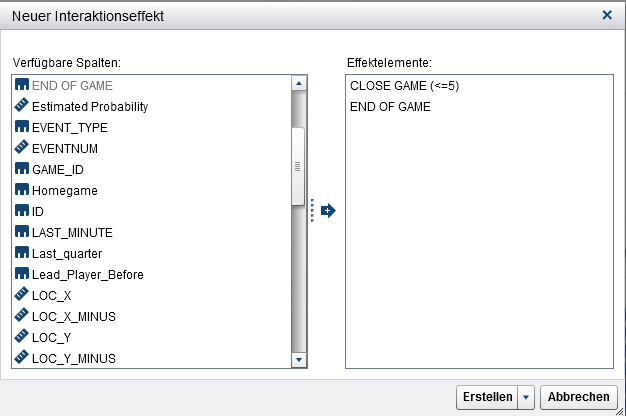
The simple logistic regression model signifies the type of throw and the playing field position are integral influencing elements for Jordan’s scoring success. On taking closer looks, it reveals that his accuracy doesn’t vary till the end of the game or when the score is closest. By this, we can analyse whether and how Jordan’s hit rate pressure could be a synergy between close games and the last few important minutes in a game.
In drawing conclusions, can we say pressure affected Jordan’s performance? Well, it doesn’t matter if Jordan performed better or worse under pressure, but the crux is whether he was the best choice for the decisive shot.
Also read: How to Use PUT and %PUT Statements in SAS: 6 Tips
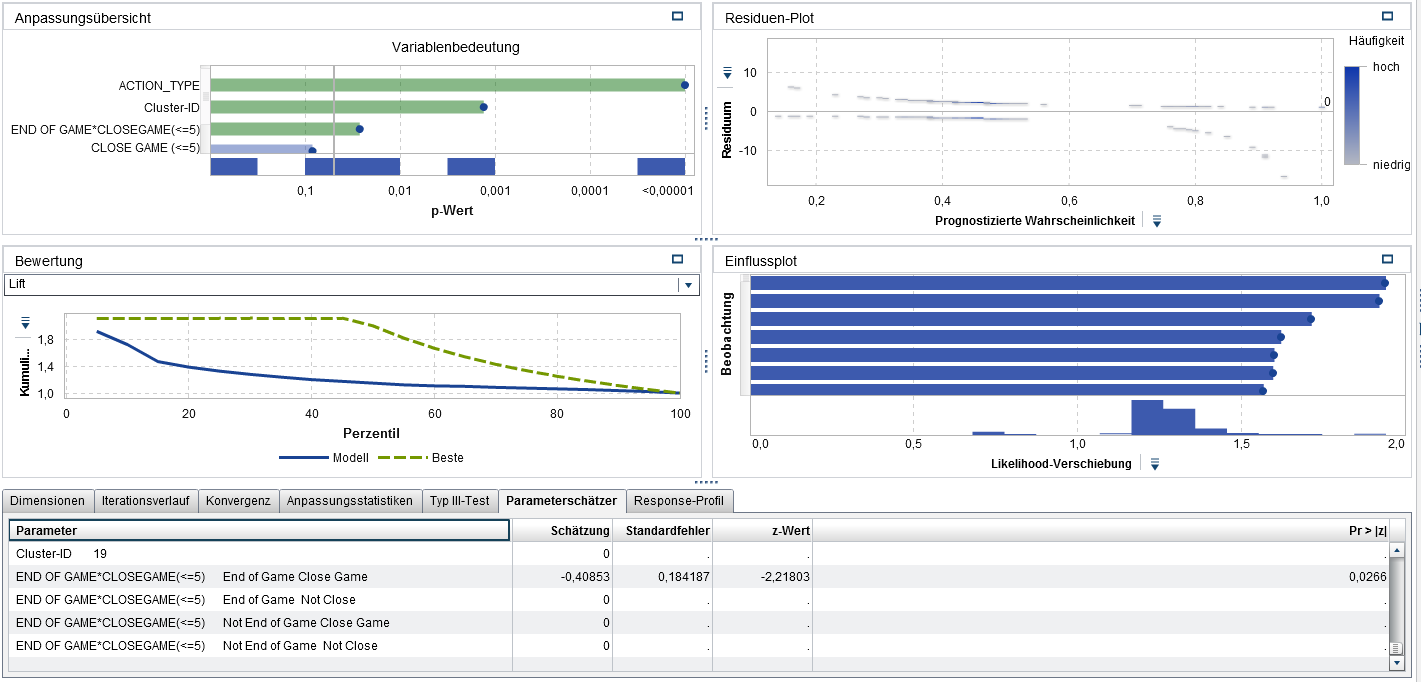
The parameter estimator is -0.41, a substantial shift from zero. By looking closely at the throwing position and shot, we can say that Jordan has a decreasing hit rate at the end of the game when the score is close. But how to interpret this? Let’s the last shot in our model as an example – here it predicts a probability of about 36% that the ball will land in the basket. A shot in similar situations with a distance of more than 5 points is given a probability of 45%.
May be, Jordan can put it best in words: “I’ve missed more than 9,000 shots in my career. I’ve lost almost 300 games. 26 times, I’ve been trusted to take the game winning shot and missed. I’ve failed over and over in my life and that is why I succeeded.”
Want to gain better insights on SAS Predictive Modelling? Consult us at DexLab Analytics. Our SAS analytics course in Pune and Gurgaon is intensive and extremely helpful.
Sources: blogs.sas.com
Interested in a career in Data Analyst?
To learn more about Machine Learning Using Python and Spark – click here.
To learn more about Data Analyst with Advanced excel course – click here.
To learn more about Data Analyst with SAS Course – click here.
To learn more about Data Analyst with R Course – click here.
To learn more about Big Data Course – click here.
online certification, online courses, sas certification, Sas course, SAS Predictive Modelling, SAS training courses, Sas training institute