Tableau Training Institute Archives - DexLab Analytics | Big Data Hadoop SAS R Analytics Predictive Modeling & Excel VBA

Not to Miss: The Startup India tableau at Republic Day 2020 parade

Not to Miss: The Startup India tableau at Republic Day 2020 parade

The commerce and industry ministry recently, in a written press briefing, said that it will showcase a tableau on Startup India, with an aim to promote innovation and entrepreneurship in the nation. The tableau will be displayed at the Republic Day Parade this year, in a first.

The name of the tableau is ‘Startups: Reach for the Sky’. It is themed on the stages of the life-cycle of a startup and the multifarious elements of support provided by the government, the ministry said in a press statement.

“The front of the tableau depicts a creative mind, full of ideas to solve real world problems. The Startup India Tree, in the middle will represent different kinds of support given,” a government official from the Department of Promotion of Industry & Internal Trade (DPIIT), said in the statement.

The staircase will stand for the various stages of growth – those are – coming up with a concept, creating a prototype, preparing a business plan, building a team, launching into markets and eventually scaling up, an Economic Times report said.

The wheel will denote sectors of economy where Indians have driven and given a fillip to economic growth and created employment opportunities on a big scale, the statement read. The wheel and the map of India together depict the width and the depth of the Startup India movement in the country.

Startup India is a flagship initiative of the Narendra Modi government, conceived with the intention of building a strong environment to nurture innovation, drive sustainable economic growth and generate large scale employment opportunities and job openings.

“We have a million problems, but at the same time we have over a billion minds,” Prime Minister Narendra Modi had said about the flagship programme started in January, 2016. In October, 2019 Prime Minister Narendra Modi said that the Indian startup ecosystem will help India achieve the $5 trillion target for the economy set by the government.  

The objective is to inspire and motivate youth to follow their dreams to generate wealth and become job creators and not just job seekers. Under the Startup India Scheme, eligible companies can get recognised as startups by the ministry in order to access a host of tax benefits, easier compliance, IPR fast tracking and other incentives.

More than 26,000 startups from 551 districts of 28 States and 7 Union Territories have been recognized so far. “Working across IT, Industry 4.0, education, healthcare, agriculture, energy, finance, space, defence and all other sectors of economy, Indian startups have attracted substantial global investments and created more than 2,91,000 jobs,” it added.

Besides DPIIT, the Department of Financial Services, Department of Drinking Water and Sanitation, NDRF Ministry of Home Affairs, CPWD Ministry of Housing and Urban Affairs, and Ministry of Shipping will also participate in the Republic Day parade.


Interested in a career in Data Analyst?

To learn more about Data Analyst with Advanced excel course – Enrol Now.
To learn more about Data Analyst with R Course – Enrol Now.
To learn more about Big Data Course – Enrol Now.

To learn more about Machine Learning Using Python and Spark – Enrol Now.
To learn more about Data Analyst with SAS Course – Enrol Now.
To learn more about Data Analyst with Apache Spark Course – Enrol Now.
To learn more about Data Analyst with Market Risk Analytics and Modelling Course – Enrol Now.

Top 3 Data Visualization Tools Trending Now

Top 3 Data Visualization Tools Trending Now

The wave of digital transformation is ravaging all industry verticals. Big Data coupled with AI and ML is driving the force, with data being at the bull’s eye.

But, what if we say most of the data in the world is hardly used? What if it becomes a hefty liability? Yes, data can become a liability if we fail to understand it properly. For that, we’ve data visualization – it’s the best way to present your data to the world in order to gain meaningful insights.

Fortunately, data visualization is evolving rapidly. Charts, graphs, infographics, videos and AR/VR presentations have taken the channels of communication to an entirely different level. In this blog, we’ve compiled tip 3 most popular and effective data visualization tools – they are easy to use, do their job well and highly compatible with major software and programming languages. However, they are all paid, although they offer free-trials.

Tableau

With a huge customer base of 57000+accounts spread across diverse industry verticals, Tableau is the father of data visualization software and for the right reasons! Along with having the ability to generate interactive visualizations, Tableau is relatively easy to use and offers more than generic BI solutions.

Tableau is ideal for handling vast and fast-changing datasets that are used mainly for Big Data operations, such as ML applications and AI implementations. Developers and data scientists look up to Tableau as it integrates seamlessly with high-end database solutions, including My SQL, Hadoop, SAP, Amazon AWS and Teradata. Also, a wide number of third-party resources online are on offer plus a powerful community to aid and assist new users about how to integrate the tool seamlessly with their projects.

Interested in arming yourself with the skills of Tableau? Worry not; DexLab Analytics is a top-notch Tableau training institute in the heart of Delhi excelling in many other in-demand skill training courses.

Plotly

For highly advanced and complex data visualizations, Plotly is the key. All thanks to how well it homogenizes with cutting-edge programming languages, such as Matlab, Python and R! All of them being extremely analytics oriented.

Developed above the open source d3.js visualization libraries for JavaScript, this high-valued commercial package is extremely user-friendly, along with providing inbuilt support for APIs, like Salesforce.

Data Science Machine Learning Certification

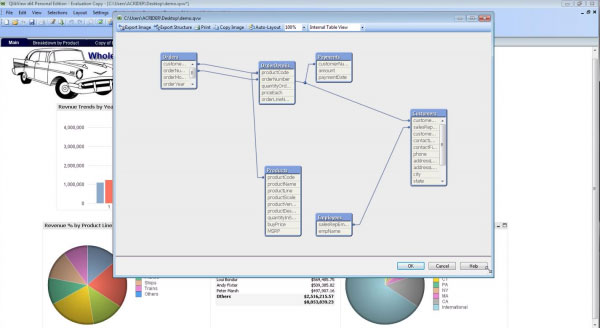
QlikView

Touted as the biggest rival of Tableau, QlikView boasts of 40000 clients’ accounts across 100 countries. It is one of the most terrific players in the space of data visualization, and why not?! The customers who have used it have lauded QlikView because of its customized setup and versatile range of functionalities. However, this could also mean it takes some time to be familiar with entirely and then only it can be leveraged to its full potential.

Along with providing superior data viz capabilities, the tool excels in some of the best BI and analytics reporting capabilities. It’s simple, effective and non-clumsy user interface scores extra brownie points. Interestingly, customers use it in collaboration with its sister package, QlikSense – it manages data discovery and exploration to derive maximum benefits.

For more information on Tableau BI training courses, drop by DexLab Analytics! They are experts in everything DATA!


The blog has been sourced from:

www.forbes.com/sites/bernardmarr/2017/07/20/the-7-best-data-visualization-tools-in-2017/#6fdf13cf6c30


.

Most Popular Tableau Interview Questions with Answers to Learn Right Now

Most Popular Tableau Interview Questions with Answers to Learn Right Now

Tableau is dominating the business intelligence industry. It’s a powerful and fastest growing data viz tool used to simplify complicated raw data. It helps break the data into easy-to comprehend formats.

In this blog, we’ve compiled down the most popular Tableau Interview questions with their answers. The sample questions are framed by seasoned experts, who have encompassing knowledge on the subject matter – they have taken needed care and effort to help you get the correct answers. This will help you on your endeavor of job hunting!

2

Mention top 5 main products offered by Tableau.

Tableau specializes in these 5 products – Tableau Server, Tableau Desktop, Tableau Reader, Tableau Online and Tableau Public.

Name the latest version of Tableau Desktop.

Tableau Desktop Version 10.5.

Explain data visualization, and the use of Tableau.

Data visualization is an umbrella term referring to a set of well-defined techniques used for data communication through proper presentation and graphics (such as bars, diagrams, lines or points).

Tableau helps analyze data in an on-premise database, a cloud application, a normal database, a data warehouse or an Excel file – create interesting representations of data and share with your colleagues, friends and clients. You can also use Tableau to include other data too, and help keep your data up-to-date regularly.

Define filters. How many types of filters exist in Tableau?

In Tableau, there are several ways to filter and restrict your data – the outcome may be oriented towards improving performance, helping viewer get the right information or for highlighting something critical.

Three types of filters are as follows:

  • Context Filter
  • Quick Filter
  • Datasource Filter

Do you know how to remove all options from a Tableau auto-filter?

  1. Right click filter
  2. Customize
  3. Uncheck show all option

Why Tableau Extract is better over live connection?

Tableau Extract is easy to use, anywhere, anytime. For this, you don’t need any connection and can construct your own visualizations without connecting yourself with any database.

How many tables can you join in Tableau at the most?

Up to 32 tables can be joined in Tableau, but not more than that.

Define dimensions and facts.

To put simply, dimensions denotes text columns, while facts refer to measures, meaning numerical values.

Examples of dimensions – product name, city

Examples of facts – profit or sales

Highlight the difference between heat map and tree map.

Well, a heat map is an ideal method for comparing groups using size and color. Here, you can easily compare two distinct measures. On the other hand, a tree map is one of the most robust visualization, especially for graphically representing hierarchical data. 

For more in-depth knowledge on Tableau and its related applications, we recommend good Tableau training institutes in Delhi. Tableau certification Delhi is gaining a lot of prominence amidst the data analytics circuit. Hope this helps build a fine career for you!


The blog has been sourced fromintellipaat.com/interview-question/tableau-interview-questions


Interested in a career in Data Analyst?

To learn more about Data Analyst with Advanced excel course – Enrol Now.
To learn more about Data Analyst with R Course – Enrol Now.
To learn more about Big Data Course – Enrol Now.

To learn more about Machine Learning Using Python and Spark – Enrol Now.
To learn more about Data Analyst with SAS Course – Enrol Now.
To learn more about Data Analyst with Apache Spark Course – Enrol Now.
To learn more about Data Analyst with Market Risk Analytics and Modelling Course – Enrol Now.

3 Most Used Data Science Tools in 2018

The humongous amount of data calls for advanced data science tools – to completely understand and analyze the information.

Data analytics fuels digital transformation. The best way to do this is by arming an expert pool of statisticians, math pundits and business analysts with suitable data science tools with which they can squelch out crucial insights from the ever-growing silos of corporate data. This kind of initiatives promote a data-driven business culture, which acts as a present prerequisite – and this why here we’ve jotted down top 3 data science tools that’s weaving wonders with the new oil of the world, data:

2

Python

Both, well-performing software and a powerful programming language perfect for developing custom algorithms, Python is the most must-have tool for all data scientists. In a recent KDnuggets survey of 2052 users, Python language was recommended by 65.6% of respondents.

“We use Python both for data science and back end, which provides us with rapid development and machine learning model deployment,” shared Alexander Osipenko, lead data scientist at Cindicator Inc. “It’s also of great importance for us to ensure the security of implemented tools.”

Leslie De Jesus, innovation director and lead data scientist at Wovenware emphasized on the importance of Python libraries. “[We use] Python Libraries, including Scrapy, for web scraping and being able to extract data from the internet and upload it into a data frame for analysis,” said De Jesus.

Few others vouched for Python because of its multifaceted nature and strong optimization skills.

For Python Certification Training in Delhi, drop by DexLab Analytics.

R

Quite similar to Python, R is the go-to programming language for many data scientists and they depend on it wholly because it’s simpler and more specifically-built for data science. According to the KDnuggets poll, 48.5% respondents voted it to be one of the leading data science tools.

As for all, R programming language is blessed with cultivated capabilities for machine learning and statistics, and professionals love using it. It’s another favorite of data analysts, especially those who deals with a lot of data exploration.

“I can quickly see summary stats like mean, median and quartiles; quickly create different graphs; and create test data sets, which can be easily shared and exported to CSV format,” said Jon Krohn, chief data scientist at Untapt Inc.

Seeking R language certification in Delhi? We have DexLab Analytics for you!

Tableau

Bridging the gap between skilled data science teams and more business-oriented analytics consultants, Tableau Software is the fastest data visualization and dashboard tool. “It is a fantastic tool for data scientists and noobs working on data science,” said Pooja Pandey, senior executive for SEO at Entersoft Security. “[It’s a] quick dashboarding tool to visualize insights and analytical data with a very short learning curve.”

The lightening speed of Tableau’s visualization and reporting functions is commendable. It’s easy to learn, quick to implement and intuitive to use. Moreover, it helps different segments of a company to customize exhaustive reports according to their requirements.

Now, if you are looking for ways to hone your visualization skills, we would recommend Tableau BI training courses from DexLab Analytics. Their training courses are comprehensive, well-research and as per industry standards.


The blog has been sourced fromsearchbusinessanalytics.techtarget.com/feature/Data-scientists-weigh-in-5-data-science-tools-to-consider


Interested in a career in Data Analyst?

To learn more about Data Analyst with Advanced excel course – Enrol Now.
To learn more about Data Analyst with R Course – Enrol Now.
To learn more about Big Data Course – Enrol Now.

To learn more about Machine Learning Using Python and Spark – Enrol Now.
To learn more about Data Analyst with SAS Course – Enrol Now.
To learn more about Data Analyst with Apache Spark Course – Enrol Now.
To learn more about Data Analyst with Market Risk Analytics and Modelling Course – Enrol Now.
Step-by-Step Guide on Calculated Fields-String Functions in Tableau

Step-by-Step Guide on Calculated Fields-String Functions in Tableau

This blog is an easy-to-read article on String Functions in Tableau’s Calculated Field. Previously, we have covered many other functions in Calculated Fields, like Logical Functions, Date Function and Aggregate Functions. These step-by-step articles are meant for beginners who wish to be well acquainted with functions in Tableau. In fact, these blogs are great for all Tableau enthusiasts who want to explore the numerous amazing features available in Tableau.

So, let’s begin exploring String Functions.

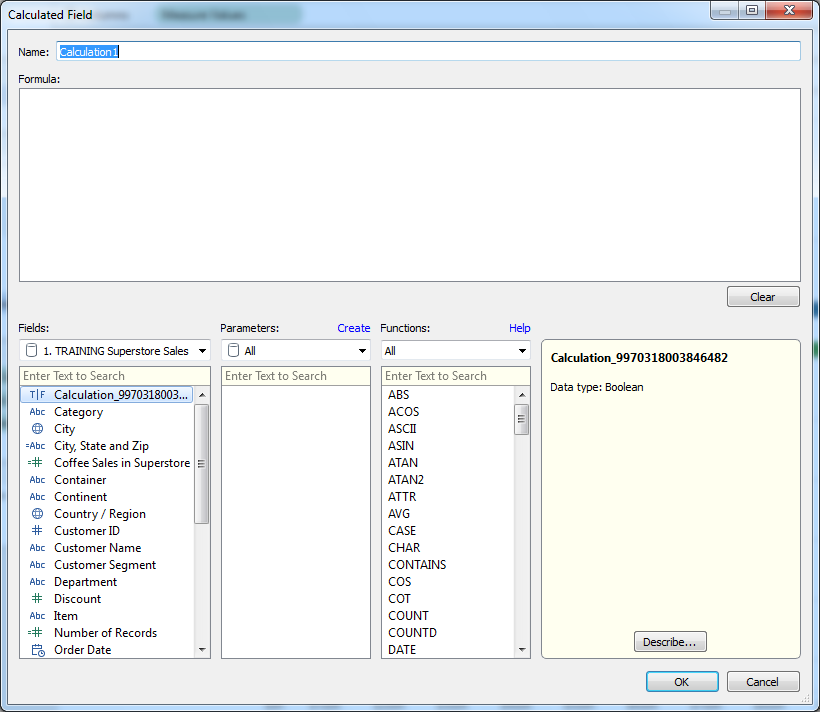
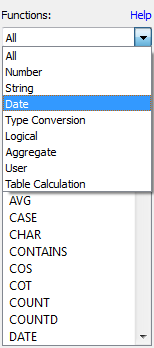
Firstly, get to the Calculated Field window following the steps explained in the previous blog posts. Next, select the option ‘’String’’ from the Functions drop-down menu to view all the string functions.

ASCII Function

ASCII(string)

This function is used to return the ASCII code for the first character in a string. Example:

CHAR Function

CHAR(integer)

This function works in the reverse of ASCII function. CHAR function is used to change an integer ASCII code to a character. Example:

CONTAINS Function

CONTAINS(string, substring)

The CONTAINS function gives back the value TRUE if a string contains a specific substring and FALSE if it doesn’t contain it. Example:

ENDSWITH Function

ENDSWITH(string, substring)

This works in a similar way to the function described above. The function is used to indicate if a string ends with a selected substring or not, returning either TRUE or FALSE. Example:

FIND Function

FIND(string, substring, [start])

The FIND function is used to get the starting position of a substring within a string. The first character of the string is position 1. In case the substring is not located, then it returns the value 0. Example:

If the start argument is defined, any instance of the substring appearing before the start shall be ignored. Here’s an example:

ISDATE Function

ISDATE(string)

This function performs a logical test and is also included in the set of logical functions and date functions. It is used to test a string and determine if it is a valid date or not. Example:

LEFT Function

LEFT(string, num_chars)

A number is specified and using that this function returns the characters in the string. Example:

Incase start_of_week is excluded then it is determined based on the data source.

LEN Function

LEN(string)

This is the length function that is used to return the number of characters in a given string field. Example:

LOWER Function

LOWER(string)

This function is used to convert each and every character in a given string into lower case letters. Example:

LTRIM Function

LTRIM(string)

This function is used to remove spaces at the beginning of a string. Example:

MAX Function

MAX(a, b)

The Max function is included in many categories of functions. When used as a string function, the MAX function gives back the value that is highest in the sort sequence, which is defined by the database for that field’s column. If the field is NULL, then the function returns the value NULL. Example:

MID Function

MID(string, start, [length])

The MID function is used for obtaining characters from the middle of a text string. The start argument states the beginning of the returned value and the length argument gives the number of characters that is to be returned. In case the length isn’t included, then all the characters from the start position is considered. The first character in a string position is 1. Example:

MIN Function

MIN(a, b)

Works similary as the MAX function; the MIN function returns the minimum between a and b. Both must be of identical data type. With strings, the MIN function returns the lower value as per the sort sequence defined in the database. In case either of the argument is null, the function returns the value NULL. Example:

REPLACE Function

REPLACE(string, substring, replacement)

This function finds the occurrence of substring in a string and replaces them with the replacement string. If the substring cannot be located in the string then there’s no replacement. Example:

RIGHT Function

RIGHT(string, num_chars)

This works in reverse of the LEFT function. It gives back the characters starting at the end of a given string. And the amount of characters is determined by the argument giving the number of characters. Example:

RTRIM Functon

RTRIM(string)

This is similar to the LTRIM function and removes trailing spaces at the end of a string. Example:

SPACE Function

SPACE(number)

The SPACE function returns a string of spaces and the number of spaces is mentioned in the number argument. Example:

STARTSWITH Function

STARTSWITH(string, substring)

This works in reverse of the ENDSWITH function and returns TRUE or FALSE depending on whether a string starts with the given substring or not. Example:

TRIM Function

TRIM(string)

The TRIM function removes any leading or trailing spaces in a particular string. Example:

UPPER Function

UPPER(string)

The last function in the list of string function- the UPPER function works in reverse of the LOWER function. It is used to convert all the characters in the string to uppercase characters. Example:

This brings us to an end of the String functions. If you want to learn about the other functions in calculated fields then you must follow DexLab Analytics and check back for our previous blog posts.

This is the concluding blog of the blog series on Tableau’s Calculated Field functions. If you want to learn more about Tableau’s fantastic features then enroll for Tableau BI training courses. We offer professional Tableau certification in Delhi.

 
This article has been sourced from:
https://www.interworks.com/blog/ccapitula/2015/04/22/tableau-essentials-calculated-fields-string-functions
 

Interested in a career in Data Analyst?

To learn more about Data Analyst with Advanced excel course – Enrol Now.
To learn more about Data Analyst with R Course – Enrol Now.
To learn more about Big Data Course – Enrol Now.

To learn more about Machine Learning Using Python and Spark – Enrol Now.
To learn more about Data Analyst with SAS Course – Enrol Now.
To learn more about Data Analyst with Apache Spark Course – Enrol Now.
To learn more about Data Analyst with Market Risk Analytics and Modelling Course – Enrol Now.

Guide on Tableau Essentials: Get Started with Calculated-Field User Functions

Guide on Tableau Essentials: Get Started with Calculated-Field User Functions

We are back with another article on Calculated Fields in Tableau! These step-by-step guides are for helping Tableau rookies master the basics of Tableau software. Not just beginners, these articles are suitable for all Tableau enthusiasts who want to explore the multiple cool features available in Tableau’s Calculated Field.

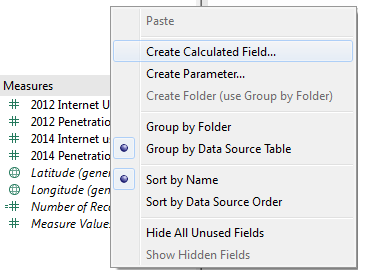
In today’s blog, we are discussing User Functions. User functions can generate filters depending on the data source. It is used to reference the identity, domain and membership of the current user on Tableau Server or Tableau Online. To access the User Functions window, right click on the Measure or Dimension window and select the option ‘’Create Calculated Field’’. Next select the option ‘’User’’ from the function drop-down menu.

Now, let’s examine the different User Functions one by one.

FULLNAME Function

FULLNAME()

The FULLNAME Function is used to return the full name of the current user. The full name is the Tableau Server or Tableau Online name used to sign in. Except for that, the Tableau Desktop user’s local or network full name is used. Example:

ISFULLNAME Function

ISFULLNAME(string)

This function gives back the value ‘’TRUE’’ if the user’s full name matches the specified string and returns ‘’FALSE” if it doesn’t match. Example:

ISMEMBEROF Function

ISMEMBEROF(string)

If the logged-in person currently using Tableau is a member of the group that matches the string then the ISMEMBEROF function gives back ‘’TRUE’’.  It returns ‘’FALSE’’ if the member is not signed in. Example:

ISUSERNAME Function

ISUSERNAME(string)

The ISUSERNAME Function is used to perform a true/false test where it returns ‘’TRUE’’ when the logged-in user’s name matches the string. Example:

USERDOMAIN Function

USERDOMAIN()

Once the user is signed into Tableau Server, the USERDOMAIN function may be used to return his/her domain. It returns the Windows domain when the user is on a domain. If not, then the function returns a null string. Example:

USERNAME Function

USERNAME()

The USERNAME function returns the username of the current tableau desktop user, which is the Tableau Server or Tableau Online username if the user is signed in. In case the user isn’t signed in, the local or network username is shown. Example:

This brings us to a close on user functions. These functions are one of the many amazing features of Tableau Software that offer users high-level of flexibility. They are very useful for developing customized views on Tableau server or Tableau Online, as the functions work like filters that limit what is visible to users depending on their username and domain.

Calculated fields make Tableau dashboards way more functional. In these blogs, we are covering the basics so you understand how to apply the functions. If you are interested to learn more about Tableau, then you must follow DexLab Analytics. We are a leading Tableau training institute in Delhi. Check back for our previous blogs on Tableau’s Calculated Field functions and definitely go through the details of Tableau BI training courses, which are available on our website.


This article has been sourced from: https://www.interworks.com/blog/ccapitula/2015/05/14/tableau-essentials-calculated-fields-user-functions


Interested in a career in Data Analyst?

To learn more about Data Analyst with Advanced excel course – Enrol Now.
To learn more about Data Analyst with R Course – Enrol Now.
To learn more about Big Data Course – Enrol Now.

To learn more about Machine Learning Using Python and Spark – Enrol Now.
To learn more about Data Analyst with SAS Course – Enrol Now.
To learn more about Data Analyst with Apache Spark Course – Enrol Now.
To learn more about Data Analyst with Market Risk Analytics and Modelling Course – Enrol Now.

Tableau Basics: An Article on Aggregate Functions in Calculated Fields

Tableau Basics: An Article on Aggregate Functions in Calculated Fields

Want to be an expert in Tableau? Then you must start with the basics and learn them well. And to help you in your endeavors, we have created a blog series covering the fundamentals of Tableau. These articles are easy-to-follow and shall help you understand how and when to use the Calculated Field functions.

In this blog, we discuss Aggregate Functions. In Aggregate Functions, we group together multiple rows of values to form a single input value that is more meaningful, like a set or list. In order to access these functions select the option ‘Aggregate’ from the drop down list for functions in the ‘Create Calculated Filed’ window.

Now, let’s discuss the different types of Aggregate Functions one by one ad look into a few examples. A person having some experience in Excel will find these functions familiar.


ATTR Function
ATTR(expression)


The ATTR function, short form for attribute, gives back a value when all rows have a single value. In case the values in the rows are different, the value ‘’*” is returned. It ignores null values. Example:

AVG Function
AVG(expression)


The AVG function returns a value that is the average of all the values in a given expression. It is used only for numeric fields. Null values are not considered. Example:

COUNT Function
COUNT(expression)


COUNT function returns the number of items present in a particular group. Null values are ignored. Example:

COUNTD Function
COUNTD(expression)


COUNTD function returns distinct items in a group and counts them only once. Null values are ignored.

The function isn’t offered in certain types of workbooks, like the ones that were created prior to Tableau Desktop v8.2, workbooks where MS Excel or text files are used as sources of data, etc. Example:

MAX Function
MAX(expression)


A MAX function is used to obtain the maximum of two expressions for each record or the maximum of a single expression across all records. The two expressions must have the same type of argument. If either of the arguments is NULL, then NULL value is returned. Example:

MEDIAN Function
MEDIAN(expression)


The median is the middle value of a sequence and the MEDIAN function is used to obtain the median for one particular expression. It only works for fields that are numeric. In case null values are present, they are ignored. Example:

MIN Function
MIN(expression)


The functionality of this function is similar to the MAX function. It is used to return the minimum of a single expression across all records or the minimum between two expressions for each record. If either of the two values is NULL, then a NULL value is returned. Like before, both the expressions need to have the same type of argument. Example:

PERCENTILE Function
PERCENTILE(expression, number)


A number between O and 1 is given and PERCENTILE function returns the percentile expression corresponding to that number. If 0.50 is given, then it returns the median number. Example:

STDEV Function
STDEV(expression)


This is actually a statistical function and stands for standard deviation. STDEV function is used to obtain the statistical standard deviation for all values for a specific expression pertaining to the sample of a population.


STDEVP Function
STDEVP(expression)


The STDEVP function is similar to the STDEV function above, but it returns the statistical standard deviation for all the values in an expression that pertains to a biased population.


SUM Function
SUM(expression)


Simply put, this function adds up all the values in an expression. Example:

VAR Function
VAR(expression)


VAR is another statistical function that returns the statistical variance for all the values in an expression pertaining to a sample of the population.


VARP Function
VARP(expression)


Similar to the function above, VARP function returns the statistical variance for all the values of an expression that pertains to the entire population.

Calculated Fields:

Calculated fields enable users to create more robust visualizations in Tableau. If you have missed our earlier blogs on Calculated Field functions, then visit the blog section of DexLab Analytics-we provide one of the best Tableau certifications in Delhi.

In order to be a Tableau expert, you need to enroll for comprehensive and well-structured Tableau BI training courses.


This article has been sourced from: www.interworks.com/blog/ccapitula/2015/05/07/tableau-essentials-calculated-fields-aggregate-functions


Interested in a career in Data Analyst?

To learn more about Data Analyst with Advanced excel course – Enrol Now.
To learn more about Data Analyst with R Course – Enrol Now.
To learn more about Big Data Course – Enrol Now.

To learn more about Machine Learning Using Python and Spark – Enrol Now.
To learn more about Data Analyst with SAS Course – Enrol Now.
To learn more about Data Analyst with Apache Spark Course – Enrol Now.
To learn more about Data Analyst with Market Risk Analytics and Modelling Course – Enrol Now.
Comprehensive Tableau Reference Guide: Calculated Field- Type Conversion Functions

Comprehensive Tableau Reference Guide: Calculated Field- Type Conversion Functions

In this blog, we introduce Type Conversion Functions. In the earlier blogs of the Comprehensive Tableau Reference Guide blog series, we have covered Logical Functions, Number Functions and Date Functions. These blogs are easy-to-read and particularly helpful for Tableau rookies who want to develop a foundational knowledge about the Calculated Field fundamentals. These step-by-step guides are perfect for Tableau enthusiasts who want to understand how and when to use the various functions available in Tableau’s calculated fields.  

Today, we will explain Type Conversion Functions. This group of functions enables users to change the data type of fields. You can convert the result of an expression to another data type. For example, using the Type Conversion functions, you can convert numbers, like age values, to strings. These functions are useful when the underlying data source needs some groundwork to harness the full potential of your visualization.

These functions are uncomplicated and easy to understand. So, let’s dive right in!

  • DATE Function

DATE(expression)

The date function is used to convert a number, string or date expression to a date. Example:

  • DATETIME Function

DATETIME(expression)

Datetime function takes the functionality of the Date function mentioned above a step further as it can be used to return a time component. This function is used to get back a datetime from a date, number or string expression. Example:

  • FLOAT Function

FLOAT(expression)

The Float function is used to return its argument as a floating point number. Example:

  • INT Function

INT(expression)

The INT function is used to convert its argument into an integer. This function truncates result of an expression to the integer closest to zero. Example:

  • STR Function

STR(expression)

The STR function is used to convert its argument into string data type. Example:

With the help of these functions, you can convert the result of arguments to different data types. For instance, if you want to make certain that all the values within date fields are date or datetime data types, then Date function and Datetime function comes very handy.

Want to learn about all the amazing features available in Tableau? Follow DexLab Analytics– we are among the leading institutes providing Tableau certification in Delhi. To know more about our Tableau BI training courses, visit our website. Check back for previous blogs where we have covered some essential Calculated Field functions.


This article has been sourced from: https://interworks.com/blog/ccapitula/2015/04/30/tableau-essentials-calculated-fields-type-conversion


Interested in a career in Data Analyst?

To learn more about Machine Learning Using Python and Spark – click here.

To learn more about Data Analyst with Advanced excel course – click here.
To learn more about Data Analyst with SAS Course – click here.
To learn more about Data Analyst with R Course – click here.
To learn more about Big Data Course – click here.

Comprehensive Tableau Reference Guide: Calculated Field-Date Functions

Comprehensive Tableau Reference Guide: Calculated Field-Date Functions

Calculated fields in Tableau are new fields created by a user that are saved in the data store and can be applied for constructing more robust visualizations.

Comprehensive Tableau Reference Guide is a blog series covering the fundamentals of Tableau Software to help you develop a foundational knowledge of the Calculated Field functions. So, if you are a newbie planning to get started with Tableau or if you simply want to explore the popular features in Tableau, then these step-by-step guides are perfect for you.

In this bog, we shall discuss about the Date Functions that you can use after creating a calculated field. In the previous two articles of this blog series, we explored Logical Functions and Number Functions. Now, let’s begin our exploration of Date Functions.

  • To open the Calculated Field window, right-click anywhere over the Date window (sidebar) and the menu appears on the screen.

  • Select the option ‘’Create Calculated Field”. This brings up the Calculated Field window. If you right-click on a specific dimension or measure to create a calculation, then the formula text region of the Calculated Field displays it.

  • Next, select the option ‘’Date’’ from the drop-down menu under ‘’Functions’’. This filters the functions to display only a list of Date Functions.

  • The date_part, which is applied in a number of Date Functions, can take the following values:
  • Second (0-60)
  • Minute (0-59)
  • Hour (0-23)
  • Day (1-31)
  • Weekday (1-7 or use their names, i.e. ‘’Monday’’, etc.)
  • Week (1-52)
  • DayofYear (1-365)
  • Month (1-12 or use their names, i.e. ‘’December’’, etc.)
  • Quarter (1-4)
  • Year (four-digit representation)

Next, let’s examine the Date Functions one by one:

  • DATEADD Function

DATEADD(date_part, interval, date)

The DATEADD function enables a user to specify a part of a date and then increment it. This function alters the date by incrementing the date_part by the number mentioned in the interval. Example:

  • DATEDIFF Function

DATEIFF(date_part, date1, date 2, start_of_week)

This function returns the difference between date1 and date2, expressed in units decided by date_part. The parameter start_of_week is optional, and if it is undefined, then the associated data source determines the start of the week.

  • DATENAME Function

DATENAME(date_part, date, [start_of_week])

Using this function, the date_part parameter of the date is returned as a string. Here also, the start_of_week parameter isn’t compulsory. Example:

  • DATEPARSE Function

DATEPARSE(format, string)

This function works exactly in the opposite manner of DATENAME function. It converts a string into a date or time following the format specified by the user. In case the string and specified format don’t match, then a Null value is returned. Example:

  • DATEPART

DATEPART(date_part, date, start_of_week)

This function returns the date_part parameter of the date as an integer. Again, the start_of_week parameter isn’t compulsory. Example:

When the date_part parameter is set as weekday, start_of_date parameter is excluded, as in this case Tableau uses a specific order to apply offsets.

  • DATETRUNC

DATERUNC(date_part, date, start_of_week)

This function is used to round off the date to the accuracy specified in the date_part of the function. Example:

The start_of_week is optional, and if excluded, then the data source determines it.

  • DAY

DAY(date)

This function is used to return the day of a specific date as an integer. Example:

  • ISDATE

ISDATE(string)

This function runs a logical test and is also incorporated within the list of Logical Functions. It tests a string and indicates if a specified data is valid (true) or not (false). Example:

  • MAX Function

MAX(expression) or MAX(expr1, expr2)

The MAX function is included in other categories of functions too. This function is used to return the maximum of a singular expression across all records or the maximum between two expressions for each record. Both the arguments need to be of the same type. In case one of the arguments is NULL, it returns a NULL value. Example:

  • MIN Function

MIN(expression) or MIN(expr1, expr2)

Similar to the MAX function, MIN function is popularly used as a Number Function, but is also used as a Date Function. This function is used to return the minimum of a singular expression across all records or the minimum between two expressions for each record. Both the arguments need to be of the same type. In case one of the arguments is NULL, it returns a NULL value. Example:

  • MONTH

MONTH(date)

This function is used to return the month of a particular date as an integer. Example:

  • NOW

NOW()

This function is used to get the current date and time. Example:

  • TODAY

TODAY()

This function is used to get the current date. Example:

  • YEAR

YEAR(date)

This function is used to return the year of a particular date as an integer. Example:

Want to learn more about Tableau? Follow DexLab Analytics, one of the leading Tableau training institutes in Delhi, to read more blogs covering all the fantastic features in Tableau. Check back for articles covering Logical Functions and Number Functions. If you are looking for Tableau certification courses in Delhi, check DexLab’s online and classroom tableau training courses.


This article has been sourced from: https://interworks.com/blog/ccapitula/2015/04/15/tableau-essentials-calculated-fields-date-functions


Interested in a career in Data Analyst?

To learn more about Data Analyst with Advanced excel course – Enrol Now.
To learn more about Data Analyst with R Course – Enrol Now.
To learn more about Big Data Course – Enrol Now.

To learn more about Machine Learning Using Python and Spark – Enrol Now.
To learn more about Data Analyst with SAS Course – Enrol Now.
To learn more about Data Analyst with Apache Spark Course – Enrol Now.
To learn more about Data Analyst with Market Risk Analytics and Modelling Course – Enrol Now.
Call us to know more