Comprehensive Tableau Reference Guide is a blog series for explaining the basics of Tableau Software. So, if you are a newbie planning to get started with Tableau or if you simply want to explore the popular features in Tableau, then these step-by-step guides are perfect for you. In this blog, we will discuss about Logical Functions in Tableau.
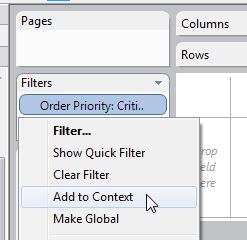
- Go to the Calculated Field window:
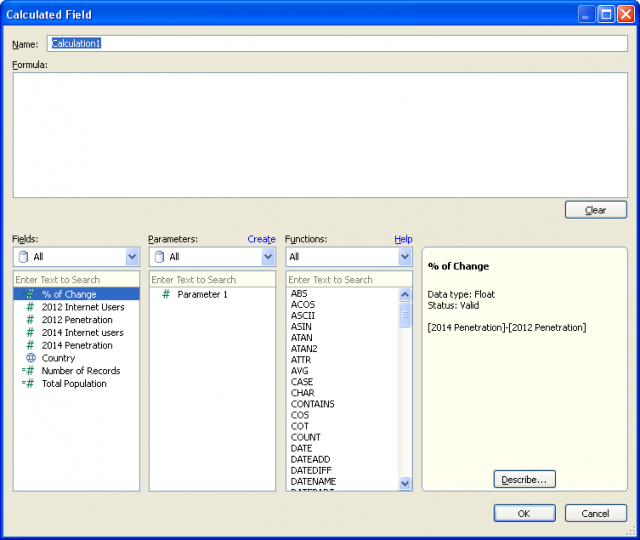
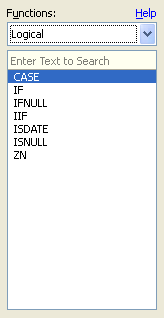
- Go to Functions table. From the drop-down menu, select the option ‘’Logical’’:
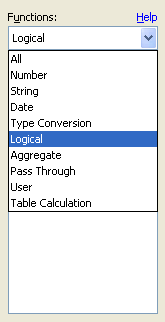
- This selection filters the list of functions to display a listing of only logical functions, which consists of seven different functions:
We will explain these functions one by one.
CASE Function:
CASE expression WHEN value1 THEN return1 WHEN value2 THEN return2… ELSE default return END
The CASE function is applied when we need to perform a logical test. This function returns values based on the result of the logical test. A CASE function can also be written as an IF function. Generally, CASE function statements are simpler and shorter.
Example of a formula using CASE function:
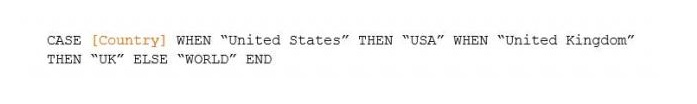
Going through the country field, when the function comes across the value ‘’United States’’, it uses ‘’USA’’. On the other hand, when it comes across “United Kingdom’’, the function uses ‘’UK”. For all other values in the country field, ‘’World’’ is used.
IF Function:
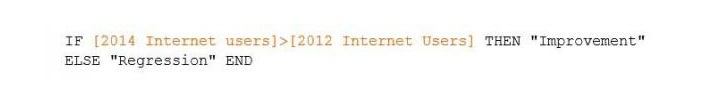
IF test THEN value END/IF test THEN value ELSE else END
A logical test can be created using the IF function. The function works like this- IF the test is true THEN carry out the given condition. The test portion of the function must be Boolean. This can be achieved either by selecting a Boolean field from data source or by constructing the expression using operators and logical comparisons (AND, OR, NOT).
Example:
IF test1 THEN value1 ELSEIF test2 THEN value2 ELSE else END
This statement is used when the functionality of IF function needs to be expanded. Additional IF-THEN statements can be incorporated through ELSEIF. Here’s an example to rewrite the CASE formula above with IF-THEN-ELSEIF statement:
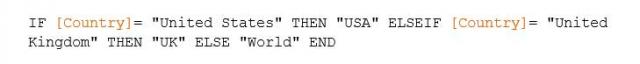
The result is the same as before.
IFNULL Function:
IFNULL(expression1, expression2)
The IFNULL function is used to perform a true/false test and check if the value in the tested field is NULL or not. If the value isn’t null then the first value of the function is used, and if the value is null then the second one is used.
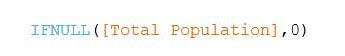
If Total Population of a country has no value, then it will be reset as zero and the null shall be eliminated from the newly created field.
IIF Function:
IIF(test, then, else, [unknown])
IIF function is very much alike the IF function described above, just a shorthand version for the IF-THEN-ELSE statement. The final argument of IIF function can define a value in case the test produces an unknown result. Like the IF function, the test must be Boolean, either by data type or the result of the test must give a Boolean value.
Here’s an example:
![]()
If the % of change field is lower than 5% then the value Poor will be returned, or else the value Good will be returned.
ISDATE Function:
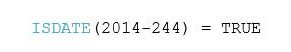
ISDATE(string)
The ISDATE function is used to determine if a string argument can be converted to a valid date (TRUE) or not (FALSE).
Example:
![]()
This formula is supported by Tableau since the field used is a string data type, however each result will be FALSE. This function comes handy in case dates are formatted in a manner that is unrecognizable by a user, like ISO 8601.
Example:
The above value stands for September 1, 2014 and is obviously a valid date.
ISNULL Function:
ISNULL(expression)
This is a simple function that checks if an expression is null (TRUE) or not (FALSE).
Example:
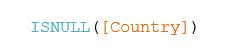
The Filter card enables users to filter null values from their visualization.
ZN Function:
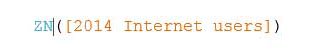
Statement: ZN(expression)
The ZN function is a variant of the ISNULL and IFNULL functions. It tests whether a function is null or not. In case the function is null, it returns a zero value.
Example:
It is natural to feel overwhelmed when you see a list of logical functions for the first time. Since we have discussed each one of them, hopefully these functions will come handy in your visualization and data leveraging pursuits.
To learn more about Tableau functions, follow Dexlab Analytics– it is one of the best Tableau training institutes in Delhi. Do take a look at their Tableau BI training courses.
This article has been sourced from: https://interworks.com/blog/ccapitula/2015/04/01/tableau-essentials-calculated-fields-logical-functions
Interested in a career in Data Analyst?
To learn more about Machine Learning Using Python and Spark – click here.
To learn more about Data Analyst with Advanced excel course – click here.
To learn more about Data Analyst with SAS Course – click here.
To learn more about Data Analyst with R Course – click here.
To learn more about Big Data Course – click here.


![5 Sure-fire Ways to Develop a Powerful Customized Web Analytics Dashboard in Tableau [VIDEO]](https://www.dexlabanalytics.com/wp-content/uploads/2017/11/^47CBFD057B1333A8D71AEB534A345901348D5D51D9BDC85641^pimgpsh_fullsize_distr.png)