statistical analysis Archives - DexLab Analytics | Big Data Hadoop SAS R Analytics Predictive Modeling & Excel VBA

Interesting Statistics of Employment: 5 Figures

Interesting Statistics of Employment: 5 Figures

It is a common sight to see the old and young talking about the job market that is going through a slump, regardless of the time or the economic conditions of the country; this picture usually is accompanied with some “cutting chai” at tea stalls on busy streets or cool cafes at the malls with the slurp of espresso with a tiny straw where the average upper-middle class youth talk about their first-world dreams while breathing progressive third-world air.

But is that really always the case? Data management or statistical analysis as we have established several times before, is sending the job market into hyper-drive, attracting millions of MNCs into the Indian soil and populating the job search portals with millions of opportunities in data.  But dare we only make statements, we are statisticians and we know that numbers do speak louder than simple statements.

So, in keeping with our love for figures and facts backed by data, DexLab Analytics has compiled a list of interesting statistics about the job market and the process of hiring.

#1 Each and every major corporate job position attracts a minimum of 250 applications!

Out of all these applications only 4 to 6 resumes get shortlisted and are called for interviews. Out of these 4 to 6 people only 1 lucky candidate is selected.

#2 Every job seeker takes into account 5 factors before accepting the position at a firm.

They are –

  • The company culture, values and overall work environment
  • Distance, ease of commute, location
  • Prospects of maintaining work/life balance
  • Growth prospects in career and
  • Pay package and compensation.

#3 Almost 94 percent of sales personnel revealed that base salary is the most important determining factor in the compensation package for them.

But 62 percent of sales personnel say that commission is the most important element.

#4 Out of 3 employees at least 2 say that most employers do not do or do not know how to use social media platforms for promoting job openings.

And 3 out of 4 employees also believe that most companies and employers do not know how to promote their brand on social media networks as well.

#5 Social media platforms are used to search for jobs by 79 percent of jobseekers.

This figure rises to 86 percent for younger job seekers who are in their initial 10 years of job search.

To learn more about statistical analysis and for Data analyst certification in Gurgaon drop by our website at DexLab Analytics.


Interested in a career in Data Analyst?

To learn more about Data Analyst with Advanced excel course – Enrol Now.
To learn more about Data Analyst with R Course – Enrol Now.
To learn more about Big Data Course – Enrol Now.

To learn more about Machine Learning Using Python and Spark – Enrol Now.
To learn more about Data Analyst with SAS Course – Enrol Now.
To learn more about Data Analyst with Apache Spark Course – Enrol Now.
To learn more about Data Analyst with Market Risk Analytics and Modelling Course – Enrol Now.
Python Vs R- Which You Want To Learn First

Python Vs R- Which You Want To Learn First

If Big Data interests you as a career choice and you are pretty much aware of the skills you need in order to be proficient in this field, in all likelihood you must be aware that R and Python are two leading languages used for analyzing data. And in case you are not really sure as to learn which of the mentioned articles first, this post will help you in making that decision.

2

In the field of analysis of data, R and Python both are free solutions that are easy to install and get started with. And it is normal for the layman to wonder which to learn first. But you may thank the heavens as both are excellent choices.

Let’s Make Visualizations Better In Python with Matplotlib – @Dexlabanalytics.

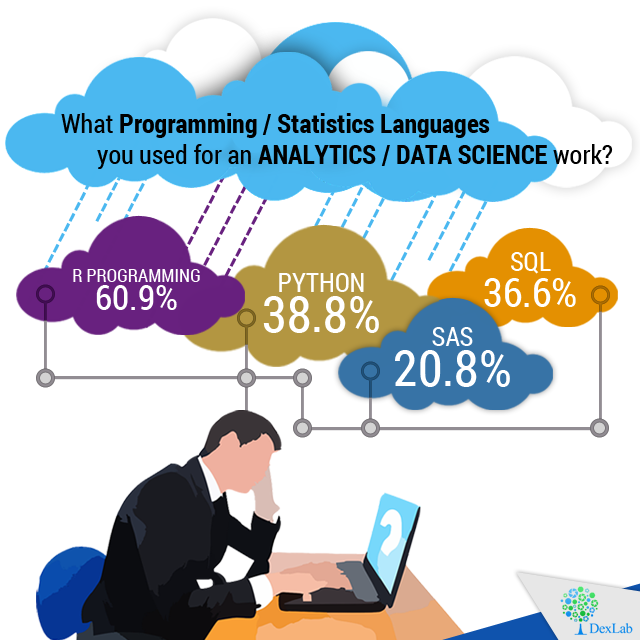
A recent poll on the most widely used programming languages for analytics and data science reveal the following:

Python Vs R- Which You Want To Learn First


Reasons to Choose R

R has an illustrious history that stretches for a considerable period of time. In addition you receive support from an active, dedicated and thriving community. That translates to the fact that you are more likely to be helped in case you are in need of some assistance or have any queries to resolve. In addition another factor that works in the favor of R is the abundance of packages that contribute greatly to increasing its functionality and make it more accessible which put R as one of the front runners to being the data science tool of choice. R works well with computer languages like Java, C and C++.

How to Parse Data with Python – @Dexlabanalytics.

In situations that call for heavy tasks in statistical analysis as well as creating graphics R programming is the tool that you want to turn to. In R, you are able to perform convoluted mathematical operations with surprising ease like matrix multiplication. And the array-centered syntax of the language make the process of translating the math into lines of code far easier which especially true of persons with little or no coding knowledge and experience.

Reasons to Opt for Python

In contrast to the specialized nature of R, Python is a programming language that serves general purposes and is able to perform a variety of tasks like munging data, engineering and wrangling data, building web applications and scraping websites amongst others. It is also the easier one to master among the two especially if you have learned an OOP or object-oriented programming language previously. In addition the Code written in Python is scalable and may be maintained with more robust code than it is possible in case of R.

The Choice Between SAS Vs. R Vs. Python: Which to Learn First? – @Dexlabanalytics.

Though the data packages available are not as large and comprehensive as R, Python when used in conjunction with tools like Numpy, Pandas, Scikit etc it comes pretty close to the comprehensive functionality of R. Python is also being adopted for tasks like statistical work of intermediate and basic complexity as well as machine learning.


Interested in a career in Data Analyst?

To learn more about Data Analyst with Advanced excel course – Enrol Now.
To learn more about Data Analyst with R Course – Enrol Now.
To learn more about Big Data Course – Enrol Now.

To learn more about Machine Learning Using Python and Spark – Enrol Now.
To learn more about Data Analyst with SAS Course – Enrol Now.
To learn more about Data Analyst with Apache Spark Course – Enrol Now.
To learn more about Data Analyst with Market Risk Analytics and Modelling Course – Enrol Now.

Call us to know more