The first case of the 2019-2020 Coronavirus pandemic in India was reported on January 30, 2020, originating in China. Experts suggest the number of infections could be much higher as India’s testing rates are among the lowest in the world. The infection rate of COVID-19 in India is 1.7, significantly lower than in the worst affected countries.
The World Health Organisation chief executive director of health emergencies program Michael Ryan said that India has “tremendous capacity” to deal with the coronavirus outbreak, and as the second most populous country, will have enormous impact on the world’s ability to deal with it.
DexLab Analytics, in the first part of this blog series, studied the statewise breakup of COVID-19 cases in India through a Jupyter Notebook. Libraries were called, maps were drawnand data was taken from Kaggle.
The data and code sheet can be found below.
In this part of the blog series we will study how states are performing with regard to laboratories and testing. First we make three data sets – that of confirmed cases, recovered cases and cases of deaths.
We first plot this data on a graph and study it carefully. Then we make a pivot table and study the data. We then also study which state is performing how many tests on people. Kerala is found to have done the maximum number of tests (Fig.1.).
Fig. 1.
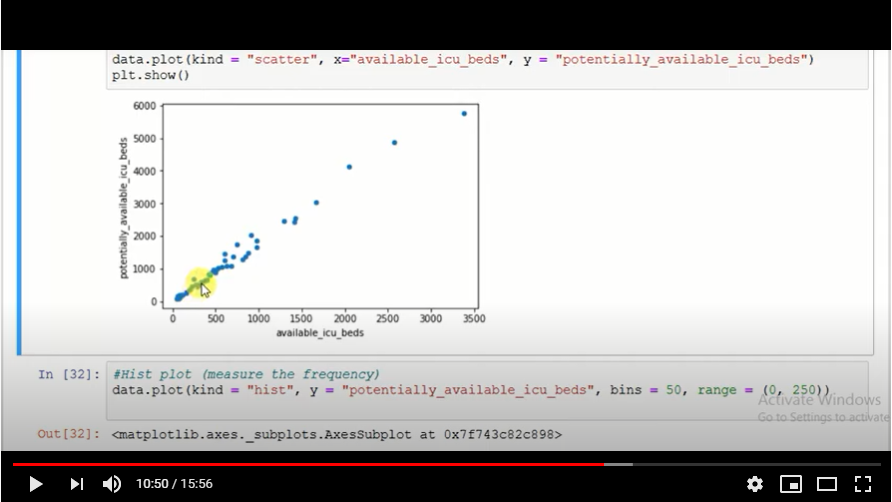
The purpose of this video is to teach you how to use visual graphs in Python. Now we aim to find why testing is underdone in states. Is there a possibility of a lesser number of labs in the first place? We get a graph (Fig. 2.) that shows us how many labs each state has for testing COVID-19 samples.
Fig. 2.
For the complete study watch the video attached herewith. This study was brought to you by DexLab Analytics. DexLab Analytics is a premiere Artificial Intelligence training institute in Gurgaon.
.


