sas gurgaon Archives - DexLab Analytics | Big Data Hadoop SAS R Analytics Predictive Modeling & Excel VBA

Wake Up to a World of Data Possibilities: With SAS Certification

Of late, in spite of trending insurgence of cutting edge technology tools, SAS remains one of the most popular, in-demand programming languages for advanced analytics. It’s been more than two decades, yet it didn’t lose its importance in ruling the data science market. This shows how flexible this pioneering analytics tool is, and how adaptable it is in its functionality that it stood strong through the test of time and development.

 
Wake Up to a World of Data Possibilities: With SAS Certification

Possess the Right SAS Skills, Be In Demand

Organizations are utilizing the perks of advanced analytics inside out. They are realizing that not only big data analytics has secured a niche area of concentration for itself, but it has strived to be an indispensable part of any organization that is on its walk to success.

Continue reading “Wake Up to a World of Data Possibilities: With SAS Certification”

The ABC of Summary Statistics and T Tests in SAS

The ABC of Summary Statistics and T Tests in SAS

Getting introduced to statistics for SAS training? Then, you must know how to create summary statistics (such as sample size, mean, and standard deviation) to test hypotheses and to figure confidence intervals. In this blog, we will show you how to furnish summary statistics (instead of raw data) to PROC TTEST in SAS, how to develop a data set that includes summary statistics and how to run PROC TTEST to calculate a two-sample or one-sample t test for the mean.

So, let’s start!

2

Running a two-sample t test for difference of means from summarized statistics

Instead of going the clichéd way, we will start with establishing a comparison between the mean heights of 19 students, based on gender – the data is held in the Sashelp class data set.

Observe the below SAS statements that sorts the data by the grouping variable, calling PROC MEANS and printing a subset of the statistics:

proc sort data=sashelp.class out=class; 
   by sex;                                /* sort by group variable */
run;
proc means data=class noprint;           /* compute summary statistics by group */
   by sex;                               /* group variable */
   var height;                           /* analysis variable */
   output out=SummaryStats;              /* write statistics to data set */
run;
proc print data=SummaryStats label noobs; 
   where _STAT_ in ("N", "MEAN", "STD");
   var Sex _STAT_ Height;
run;

summarystats1

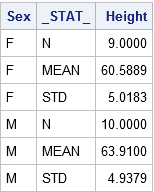
The table reflects the structure of the Summary Stats set for two sample tests. The two samples used here are differentiated on the levels of the Sex Variable (‘F’ for females and ‘M’ for males). The _STAT_ column shows the name of the statistic implemented here. The Height column depicts the value of the statistics for individual group.

Get SAS certification Delhi from DexLab Analytics today!

The problem: The heights of sixth-grade students are normally distributed. Random samples of n1=9 females and n2=10 males are selected. The mean height of the female sample is m1=60.5889 with a standard deviation of s1=5.0183. The mean height of the male sample is m2=63.9100 with a standard deviation of s2=4.9379. Is there evidence that the mean height of sixth-grade students depends on gender?

Here, you have to do nothing special to get the PROC TTEST – whenever the procedure gets the sight of the respective variable _STAT_ and any unique values, the procedure understands that the data set comprises summarized statistics. The following representation compares the mean heights of males and females:

proc ttest data=SummaryStats order=data
           alpha=0.05 test=diff sides=2; /* two-sided test of diff between group means */
   class sex;
   var height;
run;

summarystats1

Check the confidence intervals for the standard deviations and also that the output includes 95% confidence intervals for group means.

In the second table, the ‘Pooled’ row radiates out the impression that both the variances of two groups are more or less equal, which is somewhat true even. The value of the t statistic is t = -1.45 with a two-sided p-value of 0.1645.

The syntax for the PROC TTEST statement allows you to change the type of hypothesis test and the significance level. To support this, you can now run a one-sided test for the alternative hypothesis μ1 < μ2 at the 0.10 significance level just by using:

proc ttest ... alpha=0.10 test=diff sides=L;  /* Left-tailed test */

Running a one-sample t test of the mean from summarized statistics

In the above section, you have learnt to create the summary statistics from PROC MEANS. Nevertheless, you can also generate the summary statistic manually, if you lack original data.

The problem: A research study measured the pulse rates of 57 college men and found a mean pulse rate of 70.4211 beats per minute with a standard deviation of 9.9480 beats per minute. Researchers want to know if the mean pulse rate for all college men is different from the current standard of 72 beats per minute.

The following statements jots down the summary statistics for a data set, asks PROC TTEST to perform a one-sample test of the null hypothesis μ = 72 against a two-sided alternative hypothesis:

data SummaryStats;
  infile datalines dsd truncover;
  input _STAT_:$8. X;
datalines;
N, 57
MEAN, 70.4211
STD, 9.9480
;
 
proc ttest data=SummaryStats alpha=0.05 H0=72 sides=2; /* H0: mu=72 vs two-sided alternative */
   var X;
run;

summarystats3 (2)

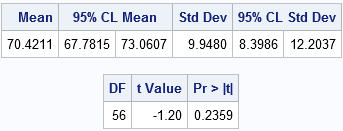
The outcome is a 95% confidence interval for the mean containing a value 72. The value of the t statistic is t = -1.20, which corresponds to a p-value of 0.2359. Therefore, the data fails in rejecting the null hypothesis at the 0.05 significance level.

For more informative blogs and news about SAS course, drop by our prime SAS predictive modeling training institute DexLab Analytics.

 
This post originally appeared onblogs.sas.com/content/iml/2017/07/03/summary-statistics-t-tests-sas.html
 

Interested in a career in Data Analyst?

To learn more about Data Analyst with Advanced excel course – Enrol Now.
To learn more about Data Analyst with R Course – Enrol Now.
To learn more about Big Data Course – Enrol Now.

To learn more about Machine Learning Using Python and Spark – Enrol Now.
To learn more about Data Analyst with SAS Course – Enrol Now.
To learn more about Data Analyst with Apache Spark Course – Enrol Now.
To learn more about Data Analyst with Market Risk Analytics and Modelling Course – Enrol Now.

Using Predictive Modelling to Determine How Well Michael Jordan Performed Under Pressure

Using Predictive Modelling to Determine How Well Michael Jordan Performed Under Pressure

Continue reading “Using Predictive Modelling to Determine How Well Michael Jordan Performed Under Pressure”

How to Simulate Multiple Samples From a Linear Regression Model

In this blog post, we will learn how to simulate multiple samples efficiently. In order to keep the discussion, easy we have simulated a single sample with ‘n’ number of observations, and ‘p’ amount of variables. But in order to use the Monte Carlo method to approximate the distribution sampling of statistics, one needs to simulate many specimens with the same regression model.


How to Simulate Multiple Samples From a Linear Regression Model


The data steps in SAS in  most blogs have 4 steps mentioned for so. However, to simulate multiple samples, put DO loop around these steps that will generate, the error term and the response variable for very observation made in the model.

Continue reading “How to Simulate Multiple Samples From a Linear Regression Model”

Understanding the Difference Between ‘Sub-Setting IF’ and ‘IF-Then-Else-IF Statement’ in SAS Programming:

Winter is knocking at our doorstep and we are hoping to get our brains worked out with some rigorous learning.


Understanding the Difference Between ‘Sub-Setting IF’ and ‘IF-Then-Else-IF Statement’ in SAS Programming:

However the weather remains, as data analysts using SAS programming, we can definitely use the weather forecasts to provide the data for explaining the concepts of IF and IF-THEN-ELSE statements to our readers interested in learning SAS predictive modeling. Continue reading “Understanding the Difference Between ‘Sub-Setting IF’ and ‘IF-Then-Else-IF Statement’ in SAS Programming:”

Data Preparation using SAS

Data Preparation using SAS

Before doing any data analysis, there are tasks which are critical to the success of the data analysis project. That critical task is known as data preparation. You may have heard that in the last years the data production is expanding at an astonishing pace. Experts now point to a 4300% increase in annual data generation by 2020. This can be due to the switch from analog to digital technologies and the rapid increase in data generation by individuals and corporations alike. The most of the data generated in the last few years are unstructured.

sass

In the above context, it is highly important to prepare your data from the unstructured dataset to a structured dataset to do a meaningful analysis.

“Data preparation means manipulation of data into a form suitable for further analysis and processing”

“Data Preparation techniques consists of Cleaning, Integration, Selection and Transformation”

We will discuss some of the data preparation techniques in SAS using SAS. INFORMAT is used to read the data with special characters. FORMAT is used to display the data with special characters.


Data DP.Practice;

length City $10.;
 input City $ ID $ Age Salary DOJ Profit;
 informat Salary dollar6. DOJ ddmmyy10. Profit dollar7.2;
 format Salary dollar6. DOJ ddmmyy10. Profit dollar7.2;
 label DOJ = "Date of Joining";
 rename Salary = Salary_of_Employee;
 datalines;
 Bangalore T101 24 $2,000 12/12/2010 $300.50
 Pune T102 29 $3,000 11/10/2006 $400.50
 Hyderabad T103 $5,000 12/10/2008 $500.70
 Delhi T104 $6,000 12/12/2009 $450.00
 Pune T105 $7,000 12/12/2009 $450.00
 ;
 run;


On the above SAS code, we have used both the INFORMAT and FORMAT to read and display the data with special characters. The SAS INFORMAT statement read the salary as numeric variable and in a specific format i.e. $5,000 which is of 6 characters including $. The FORMAT statement displays the same in your input data. Rename and label statements helps modify the variables metadata for further understanding of the dataset.

2

We will apply some transformations techniques in a dataset which helps us to apply some advanced analytical techniques in the data. We have a dataset that has various attributes of a customer who has subscribed or not subscribed an edition. In our dataset we have a categorical variable status which holds the observation either “Subscribed” or “Not Subscribed”.  We can transform the categorical variable into a dichotomous variable to run a logistic regression on our dataset.


Data media01;
 set DP.media;
 length status $15;
 If status =”subscribed” then status = “0”;
 else status = “1”;
 run;


On the above SAS code, we have applied simple If Else statements to transform our dataset called media. Transforming a categorical variable into a dichotomous variable helps us to apply the analytical techniques that we want to run in our dataset. Once after the transformation is done, the dataset is good to go for the next stage i.e. data analysis.

The more you torture your data i.e. Data Preparation, the more the success on the outcome of the data analysis.


DexLab Analytics offer state of the art SAS training courses. They are a premier SAS training institute that caters to the needs of their students round the clock.


Interested in a career in Data Analyst?

To learn more about Data Analyst with Advanced excel course – Enrol Now.
To learn more about Data Analyst with R Course – Enrol Now.
To learn more about Big Data Course – Enrol Now.

To learn more about Machine Learning Using Python and Spark – Enrol Now.
To learn more about Data Analyst with SAS Course – Enrol Now.
To learn more about Data Analyst with Apache Spark Course – Enrol Now.
To learn more about Data Analyst with Market Risk Analytics and Modelling Course – Enrol Now.

Call us to know more