SAS courses in Pune Archives - DexLab Analytics | Big Data Hadoop SAS R Analytics Predictive Modeling & Excel VBA

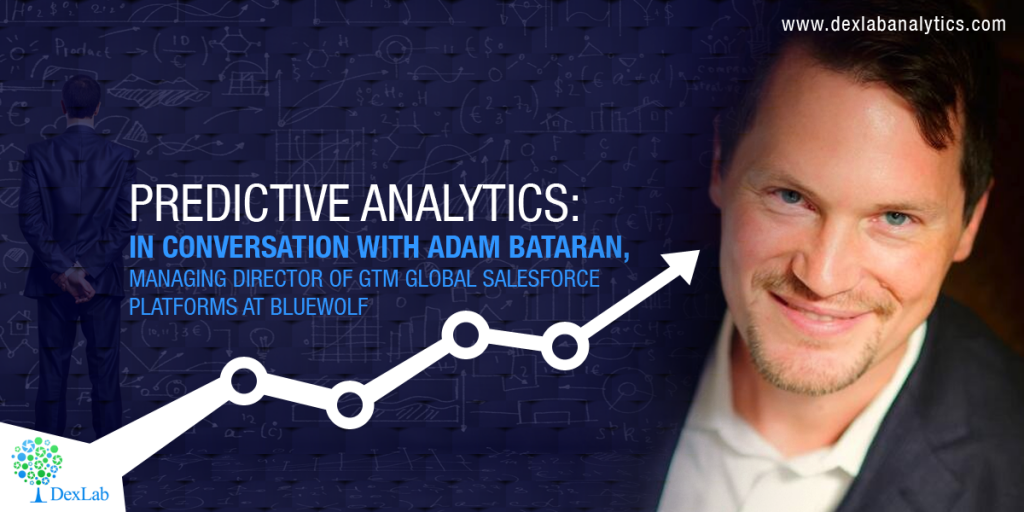
Predictive Analytics: In conversation with Adam Bataran, Managing Director of GTM Global Salesforce Platforms at Bluewolf

To discuss about Predictive Analytics, we have Adam Bataran, Managing Director of GTM Global Salesforce Platforms at Bluewolf with us.


Follow the answers Mr. Bataran pitches to understand the entire concept better.

 
Predictive Analytics: In conversation with Adam Bataran, Managing Director of GTM Global Salesforce Platforms at Bluewolf
 

The question: What does predictive analytics mean and what value it imparts to the businesses today?


The answer: Predictive Analytics functions by implementing data, machine learning techniques and statistical algorithms to predict the future business outcomes and trends, based on past data and figures. It involves a number of distinct but advanced analytics disciplines and technologies – from deep data mining techniques and statistical analysis to predictive modeling and machine learning answers the most sought after question, “what will happen next?” or “how the customers will react to this?”.

Continue reading “Predictive Analytics: In conversation with Adam Bataran, Managing Director of GTM Global Salesforce Platforms at Bluewolf”

New and Improved Data Pane in SAS Visual Analytics Now Goes Painless

New-and-Improved-Data-Pane-in-SAS--Visual-Analytics-Now-Goes-Painless
 

It seems some good news is waiting for you – honing your data for effective reports are easier now with the 8.1 release of SAS Visual Analytics. In this technical blog, we will understand the structure of data pane, how it exhibits data from an active data source, and a handful number of tasks, which you might want to perform – like viewing measure details, adjusting data item properties and fabricating geographic data items, custom categories and hierarchies.

Continue reading “New and Improved Data Pane in SAS Visual Analytics Now Goes Painless”

We Analyzed The Statistics Of Game Of Thrones

Are you a data science enthusiast as well as a fan of Game of Thrones? Then this blog is where you should stick your eyes to and fear not as we will not give you any spoilers.


We Analyzed The Statistics Of Game Of Thrones


Of the zillion of characters in the show, ever imagined which is the main character the show is leading with? Amidst the characters like Tyrion, Bran, Dany and pals who is the main one in the Game of Thrones? Continue reading “We Analyzed The Statistics Of Game Of Thrones”

The Most Interesting Scientific Fact About Numbers a Data Scientist can Know

Are you a non-data person? Do you think numbers are unnecessarily complex and are better to stay away from? When asked to calculations do you feel a little of sleepiness setting in? Then this would come as a surprise to you that our brains originally think in numbers. To be more precise, our brains actually think in the Logarithm Scale instead of thinking in the additive scale. To put it simply our brains understand better in terms of proportions than in differences.


The most interesting scientific fact about numbers a data scientist can know


So, how would our brains approach differences in numbers? We think almost automatically that the difference between 1 and 2 is greater than the difference between 3 and 2 and so forth.

Continue reading “The Most Interesting Scientific Fact About Numbers a Data Scientist can Know”

Decades On, SAS is Still the Market Leader

In the 2016 February report by Gartner, SAS bagged the top slot in its execution ability and was once again placed in the quadrant of leaders in the Magic Quadrant for Advanced Analytics Platforms.According to the description, as provided by Gartner, advanced analytics involves various sorts of data analysis through the use of quantitative methods of great sophistication like machine learning, statistics, simulation, data mining in its both predictive and descriptive forms as well as optimization.


Decades On , SAS Still The Leader


The goal is come up with insights that are unlikely to be discovered through approaching business intelligence traditionally like query and reporting.

Continue reading “Decades On, SAS is Still the Market Leader”

Elementary Character Functions in SAS

Basically the number of functions present in the SAS program amount to three. They are Character Functions, Numeric Functions and Date and Time Functions. In this post we are going to take a brief look at Character functions of a basic nature.
 

Elementary Character Function  in SAS


Character Functions

Suppose that there is this program with the following lines of command:

Data Len_func ; input name $ ; cards; Sandeep Baljeet
Neeta
.
;
run;
data Len_func; set Len_func ; Len=length(name);
Len_N=lengthn(name); Len_C=lengthc(name); run;
proc print; run;

Here,

  • The function called LENGTH returns the character value’s length.
  • The function LENGTHN is more or less identical to the LENGTH function. The sole difference between the two lies in the fact that for a value missing character it returns the length that equals to 0 whereas LENGTH returns a value of 1.
  • The function LENGTHC returns to the program the storage length of particular strings.


The ABC of Summary Statistics and T Tests in SAS – @Dexlabanalytics.


Again let us consider the following lines of code:

Data case ; input name $ ;cards;
sandeep baljeet neeta
;
New_U=upcase(name); New_P=propcase(name); 
run;
proc print; run;


Data Preparation using SAS – @Dexlabanalytics.


Here the following functions are introduced:

  • The function UPCASE converts all of the letters to the uppercase.
  • The function PROPCASE serves to capitalize the first letter of all words and converts the remaining to lowercase.
  • As might be guess from the convention conformed to while naming the function, LOWCASE transforms all letters to their lowercase counterparts.


In the following program commands:

Data AMOUNTS; input NAME $20.; cards;
RAD-HIKA SHARMA RAJARAM PAND-IT SURESH
AA-RT-I
;
RUN;
Data AMOUNTS;
Set AMOUNTS; NAME1=COMPRESS(NAME,'-'); NAME2=COMPBL(NAME);
RUN;
PROC PRINT;
RUN;


Here’s why SAS Analytics Is a Must-Have IT Skill to Possess – @Dexlabanalytics.


Here we can see the following syntax:

  1. Compress (Variable, ”want to remove”);
  2. Compbl (Variable)
  • The function COMPRESS removes blanks by default. It can also remove a particular specified character value as indicated by the code. In the example cited the character value ‘-‘is compressed.
  • On the other hand the COMPBL function serves to result in a single blank from multiple ones.


For expert guidance, you will be well advised to enroll yourself in a SAS course from a reputed SAS Training institute. You may consider DexLab Analytics if you are in the vicinity of Delhi or noida.


Interested in a career in Data Analyst?

To learn more about Machine Learning Using Python and Spark – click here.
To learn more about Data Analyst with Advanced excel course – click here.
To learn more about Data Analyst with SAS Course – click here.
To learn more about Data Analyst with R Course – click here.
To learn more about Big Data Course – click here.
Import and Export of dataset using SAS and R

Import and Export of dataset using SAS and R
 

For an analyst, data is a primary raw material, which is used to draw conclusions and inferences for taking business decisions. Raw data is of less help to draw conclusions and inferences. Hence, we need to put the data into any statistical analysis software to slice and dice to bring inference for better decision making. In this post, we will discuss about the steps to import and export of a dataset using SAS and R.

Continue reading “Import and Export of dataset using SAS and R”

Call us to know more