sas analytics course Archives - DexLab Analytics | Big Data Hadoop SAS R Analytics Predictive Modeling & Excel VBA

Refugee Migration: How Predictive Analytics Coupled with Big Data is Developing Urgent Solutions for Countless Refugees?

Refugee Migration: How Predictive Analytics Coupled with Big Data is Developing Urgent Solutions for Countless Refugees?

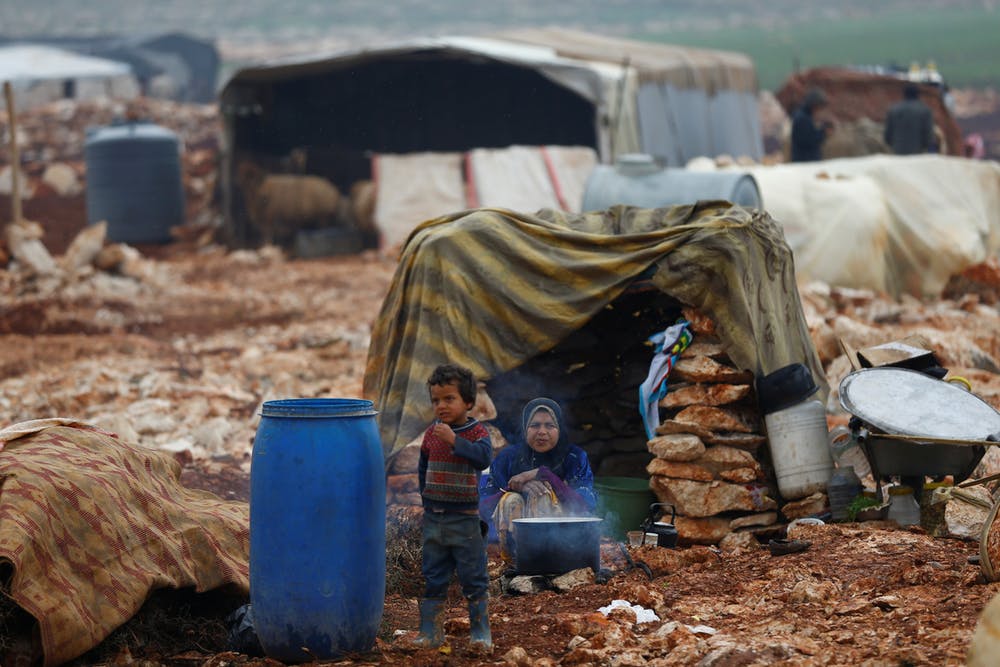
In total, 65 million people are currently displaced or live refugees – owing to the Syrian Civil War. Each day, thousands of refugees are fleeing their homes and seeking asylums in foreign countries. Many countries have opened their borders, countless UN agencies have come forward to help and handle the ongoing global crisis – but how bad is the current situation? What are the chances of working out a satisfactory solution?

2

Predictive Analytics is the key. It’s a raw form of statistical science that mines through available data for future prediction of outcomes. Though we agree to the potentials of predictive analytics, we can’t turn a blind eye to the political and financial roadblocks it poses in front of us, which keeps us from addressing the current crisis with same gusto.

For excellent SAS predictive modeling training, DexLab Analytics is your go-to learning destination in Gurgaon

The Power of Prediction

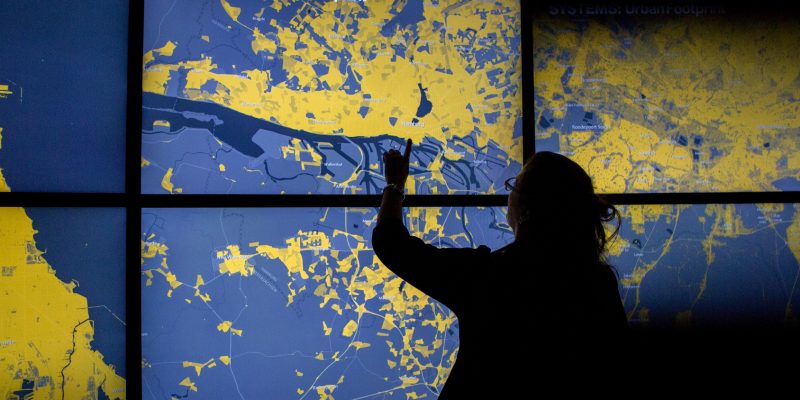
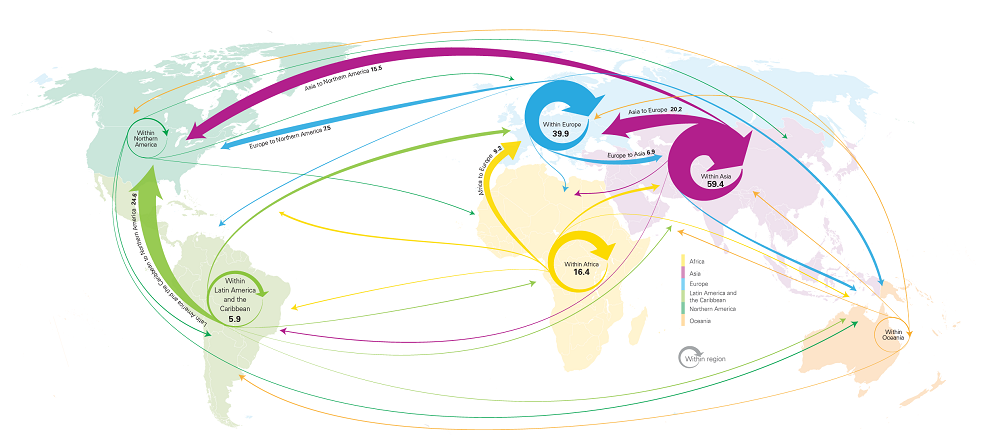
Past data helps! They help the algorithms to anticipate the challenges even before they arise. Also migration data… gathered from a plethora of sources, including World Bank data, population censuses, sample surveys, population registers, and other administrative sources. Such treasure troves of data could be groundbreaking, especially for representatives working on forefront of the ongoing crisis. Armed with meaningful data, officials using advanced analytics could chart out most likely locations, where the refugees are about to head next. Spotting the possible signs of influx, government and respective policymakers might reroute the refugees to different locations, where better assistance is possible and expected. This kind of real-time data helps respectable authorities to transfer money and goods to locales that need them the most.

Nevertheless, predictions are not always on-point or don’t lead to the best guesses, all the time, yet in many cases, refugees could benefit – remember refugee crisis is not only a serious humanitarian crisis but also a development issue for countries that accept the asylum seekers. Thus, the authorities should refrain from bottling up hundreds and thousands of refugees from bottling them up in overcrowded camps, without food, water and other basic amenities. And for that, they need adequate data, which could help them make the best possible decision in such situations of distress.

A Hope in Sight

Technical challenges are soaring; if the world is resilient to solve the ongoing international crisis, predictive analytics has to be embraced, but make sure you give adequate importance to data security. Accidental data breaches and releases are happening all around, which could result in triggering targeted violence in specific, highly-populated, vulnerable areas.

Addressing the growing concern, hefty financial investment is the best play. Several private players and multinational organizations, including UN till now have given undue attention but devoted limited resources to tackle the challenge. That needs to be changed now. And fortunately, change is in motion; recently two key players in the humanitarian aid and development area of work signed a partnership to formulate innovative solutions for refugee crisis using far-reaching claws of big data and technology. The striking partnership between the World Bank and United Nations Refugee Agency is the first stepping stone towards improving the quality of data about refugees, prompting an improved smarter assistance for refugees across the globe.

No longer are such initiatives a distant concept; the phenomenal rise of big data hadoop and predictive analytics technology has stepped up the quality and speed of data resulting in tailor-made sophisticated assistance, perfect for refugee crisis. In a nutshell, the new dimension is going to make a lot of difference, and technology is going to be a game-changer in this.

For more interesting blogs and data-related stuffs, follow us on DexLab Analytics. We are a leading SAS Predictive Modelling training institute in Delhi offering high-in demand certification courses. Reach us today!


The blog has been sourced from 

sisense.com/blog/refugee-migration-where-are-people-fleeing-from-and-where-are-they-going

mashable.com/2018/04/24/big-data-refugees/#8md_gh7p2iqr

theconversation.com/millions-of-refugees-could-benefit-from-big-data-but-were-not-using-it-86286


Interested in a career in Data Analyst?

To learn more about Data Analyst with Advanced excel course – Enrol Now.
To learn more about Data Analyst with R Course – Enrol Now.
To learn more about Big Data Course – Enrol Now.

To learn more about Machine Learning Using Python and Spark – Enrol Now.
To learn more about Data Analyst with SAS Course – Enrol Now.
To learn more about Data Analyst with Apache Spark Course – Enrol Now.
To learn more about Data Analyst with Market Risk Analytics and Modelling Course – Enrol Now.

Digital Transformation: Data Scientists Are a Must Now for Enterprises

Data explosion, sprawling around Facebook and Internet of Things need to be nipped now to make sense what’s in there. Data is filled with promises, it offers new significant insights culled from the patterns in the data to just not report what happened but predict future scenarios.

Digital Transformation: Data Scientists Are a Must Now for Enterprises

This has led organizations to hire data scientists who are adept with the expertise and experience to shed some light on the mysteries of NoSQL data lakes and data bases, in which data is hoarded. For best SAS analytics training in Gurgaon, look up to DexLab Analytics – their SAS certification in Delhi is nifty and student-friendly.

Continue reading “Digital Transformation: Data Scientists Are a Must Now for Enterprises”

Wake Up to a World of Data Possibilities: With SAS Certification

Of late, in spite of trending insurgence of cutting edge technology tools, SAS remains one of the most popular, in-demand programming languages for advanced analytics. It’s been more than two decades, yet it didn’t lose its importance in ruling the data science market. This shows how flexible this pioneering analytics tool is, and how adaptable it is in its functionality that it stood strong through the test of time and development.

 
Wake Up to a World of Data Possibilities: With SAS Certification

Possess the Right SAS Skills, Be In Demand

Organizations are utilizing the perks of advanced analytics inside out. They are realizing that not only big data analytics has secured a niche area of concentration for itself, but it has strived to be an indispensable part of any organization that is on its walk to success.

Continue reading “Wake Up to a World of Data Possibilities: With SAS Certification”

The ABC of Summary Statistics and T Tests in SAS

The ABC of Summary Statistics and T Tests in SAS

Getting introduced to statistics for SAS training? Then, you must know how to create summary statistics (such as sample size, mean, and standard deviation) to test hypotheses and to figure confidence intervals. In this blog, we will show you how to furnish summary statistics (instead of raw data) to PROC TTEST in SAS, how to develop a data set that includes summary statistics and how to run PROC TTEST to calculate a two-sample or one-sample t test for the mean.

So, let’s start!

2

Running a two-sample t test for difference of means from summarized statistics

Instead of going the clichéd way, we will start with establishing a comparison between the mean heights of 19 students, based on gender – the data is held in the Sashelp class data set.

Observe the below SAS statements that sorts the data by the grouping variable, calling PROC MEANS and printing a subset of the statistics:

proc sort data=sashelp.class out=class; 
   by sex;                                /* sort by group variable */
run;
proc means data=class noprint;           /* compute summary statistics by group */
   by sex;                               /* group variable */
   var height;                           /* analysis variable */
   output out=SummaryStats;              /* write statistics to data set */
run;
proc print data=SummaryStats label noobs; 
   where _STAT_ in ("N", "MEAN", "STD");
   var Sex _STAT_ Height;
run;

summarystats1

The table reflects the structure of the Summary Stats set for two sample tests. The two samples used here are differentiated on the levels of the Sex Variable (‘F’ for females and ‘M’ for males). The _STAT_ column shows the name of the statistic implemented here. The Height column depicts the value of the statistics for individual group.

Get SAS certification Delhi from DexLab Analytics today!

The problem: The heights of sixth-grade students are normally distributed. Random samples of n1=9 females and n2=10 males are selected. The mean height of the female sample is m1=60.5889 with a standard deviation of s1=5.0183. The mean height of the male sample is m2=63.9100 with a standard deviation of s2=4.9379. Is there evidence that the mean height of sixth-grade students depends on gender?

Here, you have to do nothing special to get the PROC TTEST – whenever the procedure gets the sight of the respective variable _STAT_ and any unique values, the procedure understands that the data set comprises summarized statistics. The following representation compares the mean heights of males and females:

proc ttest data=SummaryStats order=data
           alpha=0.05 test=diff sides=2; /* two-sided test of diff between group means */
   class sex;
   var height;
run;

summarystats1

Check the confidence intervals for the standard deviations and also that the output includes 95% confidence intervals for group means.

In the second table, the ‘Pooled’ row radiates out the impression that both the variances of two groups are more or less equal, which is somewhat true even. The value of the t statistic is t = -1.45 with a two-sided p-value of 0.1645.

The syntax for the PROC TTEST statement allows you to change the type of hypothesis test and the significance level. To support this, you can now run a one-sided test for the alternative hypothesis μ1 < μ2 at the 0.10 significance level just by using:

proc ttest ... alpha=0.10 test=diff sides=L;  /* Left-tailed test */

Running a one-sample t test of the mean from summarized statistics

In the above section, you have learnt to create the summary statistics from PROC MEANS. Nevertheless, you can also generate the summary statistic manually, if you lack original data.

The problem: A research study measured the pulse rates of 57 college men and found a mean pulse rate of 70.4211 beats per minute with a standard deviation of 9.9480 beats per minute. Researchers want to know if the mean pulse rate for all college men is different from the current standard of 72 beats per minute.

The following statements jots down the summary statistics for a data set, asks PROC TTEST to perform a one-sample test of the null hypothesis μ = 72 against a two-sided alternative hypothesis:

data SummaryStats;
  infile datalines dsd truncover;
  input _STAT_:$8. X;
datalines;
N, 57
MEAN, 70.4211
STD, 9.9480
;
 
proc ttest data=SummaryStats alpha=0.05 H0=72 sides=2; /* H0: mu=72 vs two-sided alternative */
   var X;
run;

summarystats3 (2)

The outcome is a 95% confidence interval for the mean containing a value 72. The value of the t statistic is t = -1.20, which corresponds to a p-value of 0.2359. Therefore, the data fails in rejecting the null hypothesis at the 0.05 significance level.

For more informative blogs and news about SAS course, drop by our prime SAS predictive modeling training institute DexLab Analytics.

 
This post originally appeared onblogs.sas.com/content/iml/2017/07/03/summary-statistics-t-tests-sas.html
 

Interested in a career in Data Analyst?

To learn more about Data Analyst with Advanced excel course – Enrol Now.
To learn more about Data Analyst with R Course – Enrol Now.
To learn more about Big Data Course – Enrol Now.

To learn more about Machine Learning Using Python and Spark – Enrol Now.
To learn more about Data Analyst with SAS Course – Enrol Now.
To learn more about Data Analyst with Apache Spark Course – Enrol Now.
To learn more about Data Analyst with Market Risk Analytics and Modelling Course – Enrol Now.

Trends to Watch Out – Global Self-service Business Intelligence (BI) Market 2017

Gartner says – By 2020, the global BI and Analytics market is expected to flourish to USD 22.8 billion.


Trends to Watch Out - Global Self-service Business Intelligence (BI) Market 2017


The Global Self-Service Business Intelligence (BI) Market Research Report 2017 provides a comprehensive, detailed analysis of Self-Service BI industry, including the present Self-Service BI market trends and norms. It mainly focuses on the market of big continents, like North America, Europe and Asia, coupled with countries like Germany, US, China and Japan.

Continue reading “Trends to Watch Out – Global Self-service Business Intelligence (BI) Market 2017”

How to Code Colour Values Within SAS Enterprise Guide

Colours are amazing, they are the subject of many romantic poems and songs, they are what can alter our moods drastically, they are these magical wavelengths that transform into incredible visions for our eyes.

 
How to Code Colour Values Within SAS Enterprise Guide
 

Some feel warm, while others feel cool, some make us happy while others make us sad… but as colours are so important, how to add these values within the SAS Enterprise Guide?

Continue reading “How to Code Colour Values Within SAS Enterprise Guide”

Celebrate Christmas in Data Analyst Style With SAS!

Christmas is just at the end of this week, so we at team DexLab decided to help our dear readers who love some data-wizardry, with some SAS magic! You can choose to flaunt your extra SAS knowledge to your peer groups with the below described SAS program.


Celebrate Christmas in Data Analyst Style With SAS!

We are taking things a tad backwards by trying to, almost idiosyncratically complicate things that are otherwise simple. After all some say, a job of a data analyst is to do so! However, be it stupid or unnecessary this is definitely by far the coolest way to wish Merry Christmas, in data-analyst style.

Continue reading “Celebrate Christmas in Data Analyst Style With SAS!”

Understanding the Difference Between ‘Sub-Setting IF’ and ‘IF-Then-Else-IF Statement’ in SAS Programming:

Winter is knocking at our doorstep and we are hoping to get our brains worked out with some rigorous learning.


Understanding the Difference Between ‘Sub-Setting IF’ and ‘IF-Then-Else-IF Statement’ in SAS Programming:

However the weather remains, as data analysts using SAS programming, we can definitely use the weather forecasts to provide the data for explaining the concepts of IF and IF-THEN-ELSE statements to our readers interested in learning SAS predictive modeling. Continue reading “Understanding the Difference Between ‘Sub-Setting IF’ and ‘IF-Then-Else-IF Statement’ in SAS Programming:”

The Right Tool For Statistical Analysis SAS Vs. Stata

Both SPSS and SAS have been around in the world of statistical analysis for several years now, so, the conundrum of which is better software for statistical analysis is an age-old question among data people.


The Right Tool For Statistical Analysis SAS Vs. Stata


To begin with SAS is in its version 9+ and has also enhanced its visual appeal greatly. But SPSS still comes with its popular “click and get results” interface. SPSS has also moved beyond its version 15.0+ and has also began adding different modules like its competitor SAS. Continue reading “The Right Tool For Statistical Analysis SAS Vs. Stata”

Call us to know more