SAS analytics certification Archives - DexLab Analytics | Big Data Hadoop SAS R Analytics Predictive Modeling & Excel VBA

How Many Category 5 Hurricanes Have We Had in the Atlantic?

With Hurricane Irma battering the pretty state of Florida while ripping through the Caribbean like a mammoth buzzsaw blade, we start wondering how often such rare Category 5 hurricanes occur. We know hurricanes of such magnitude are rare, but how much rare?

According to Wikipedia page information, hurricanes having wind speed greater than or equal to 157 mph are termed as category 5 hurricanes, enough to wreak havoc around. Using SAS Analytics, let’s start digging some data to unravel how many hurricanes of such great magnitude have hit the Atlantic coastal towns and cities with such dangerous wind speeds..

After indulging in a bit of research work, we came across weather.unisys.com website that contains exhaustive data about all the past hurricanes formed out of Atlantic. It turned out to be a good repository of data – we jotted down a bit of code and parsed the data into SAS data set. Next, we marked all the Atlantic hurricane paths on a map, and highlighted the line segments in bright red, where the wind speed fell under the Category 5 tab. So, come know how often they have taken place, along with their accurate position.

sas certification

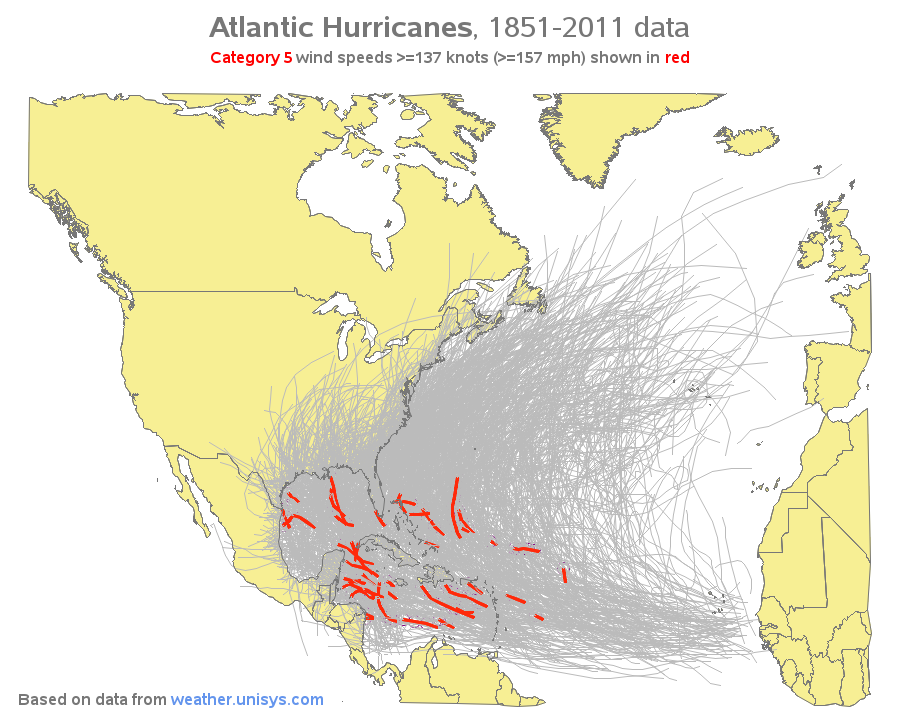
Hit the above image to view the full-size interactive version of the map with HTML mouse-over text displaying the hurricane names in red for category 5 descriptions.

Take a look at the technical details of the code we used to draw the map:

  1. The map is created using SAS/Graph Proc GMap.
  2. We projected the map with the help of Proc GProject. Followed to that, we saved the projection parameters using the brand new Parmout=option. It was only then that we can project the hurricane paths individually, using GProject’s parmin=option. (Before the innovation of parmout/parmin parameters, we used to combine the map and hurricane paths, compile and project them together, and then divide the results into two separate datasets – of course the new functionality eases the things out).
  3. The paths of hurricane were plotted using regular ‘move’ and ‘draw’ Annotate functions.
  4. We first plotted the land areas (choropleth map), then covered (annotated) the hurricane tracks (while doing so, make sure the red lines lie on top for better visibility), and finally overlaid the country border contours on top again so as to make them prominent.
  5. As lines are incompatible with mouse-over text, we annotated circles using mouse-over text along the red hurricane paths. We outlined these circles at the very beginning (using when=’b’), hence they would become invisible later.

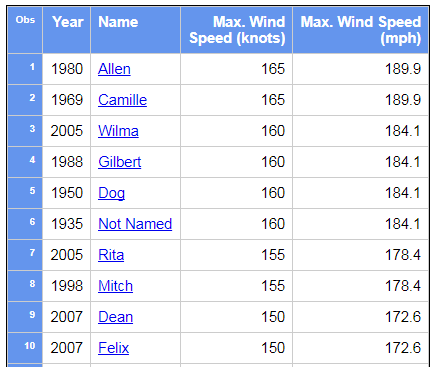
Have a look at the table we presented below. The table comprises of 34 Category 5 Atlantic hurricanes, derived from 150 years of data. You can also run your eyes through a snapshot image – click on the image to see the entire interactive table. And if you are interested in knowing more, hit each hurricane name and ask Google to give you information.

sas training institute

Nota Bene: There might be some hurricanes under Category 5 domain we missed out. Kindly excuse us there, but we think we have nicely hit our main point of discussion. If you have anything to say us, scroll down and comment!

DexLab Analytics is reckoned to be the best SAS analytics training in Pune. The courses are a collaboration of intensive subject matter research and industry experts’ relentless dedication towards their students. For state-of-the-art SAS training courses in Pune, drop by DexLab Analytics.

Interested in a career in Data Analyst?

To learn more about Machine Learning Using Python and Spark – click here.
To learn more about Data Analyst with Advanced excel course – click here.
To learn more about Data Analyst with SAS Course – click here.
To learn more about Data Analyst with R Course – click here.
To learn more about Big Data Course – click here.

Data Preparation using SAS

Data Preparation using SAS

Before doing any data analysis, there are tasks which are critical to the success of the data analysis project. That critical task is known as data preparation. You may have heard that in the last years the data production is expanding at an astonishing pace. Experts now point to a 4300% increase in annual data generation by 2020. This can be due to the switch from analog to digital technologies and the rapid increase in data generation by individuals and corporations alike. The most of the data generated in the last few years are unstructured.

sass

In the above context, it is highly important to prepare your data from the unstructured dataset to a structured dataset to do a meaningful analysis.

“Data preparation means manipulation of data into a form suitable for further analysis and processing”

“Data Preparation techniques consists of Cleaning, Integration, Selection and Transformation”

We will discuss some of the data preparation techniques in SAS using SAS. INFORMAT is used to read the data with special characters. FORMAT is used to display the data with special characters.


Data DP.Practice;

length City $10.;
 input City $ ID $ Age Salary DOJ Profit;
 informat Salary dollar6. DOJ ddmmyy10. Profit dollar7.2;
 format Salary dollar6. DOJ ddmmyy10. Profit dollar7.2;
 label DOJ = "Date of Joining";
 rename Salary = Salary_of_Employee;
 datalines;
 Bangalore T101 24 $2,000 12/12/2010 $300.50
 Pune T102 29 $3,000 11/10/2006 $400.50
 Hyderabad T103 $5,000 12/10/2008 $500.70
 Delhi T104 $6,000 12/12/2009 $450.00
 Pune T105 $7,000 12/12/2009 $450.00
 ;
 run;


On the above SAS code, we have used both the INFORMAT and FORMAT to read and display the data with special characters. The SAS INFORMAT statement read the salary as numeric variable and in a specific format i.e. $5,000 which is of 6 characters including $. The FORMAT statement displays the same in your input data. Rename and label statements helps modify the variables metadata for further understanding of the dataset.

2

We will apply some transformations techniques in a dataset which helps us to apply some advanced analytical techniques in the data. We have a dataset that has various attributes of a customer who has subscribed or not subscribed an edition. In our dataset we have a categorical variable status which holds the observation either “Subscribed” or “Not Subscribed”.  We can transform the categorical variable into a dichotomous variable to run a logistic regression on our dataset.


Data media01;
 set DP.media;
 length status $15;
 If status =”subscribed” then status = “0”;
 else status = “1”;
 run;


On the above SAS code, we have applied simple If Else statements to transform our dataset called media. Transforming a categorical variable into a dichotomous variable helps us to apply the analytical techniques that we want to run in our dataset. Once after the transformation is done, the dataset is good to go for the next stage i.e. data analysis.

The more you torture your data i.e. Data Preparation, the more the success on the outcome of the data analysis.


DexLab Analytics offer state of the art SAS training courses. They are a premier SAS training institute that caters to the needs of their students round the clock.


Interested in a career in Data Analyst?

To learn more about Data Analyst with Advanced excel course – Enrol Now.
To learn more about Data Analyst with R Course – Enrol Now.
To learn more about Big Data Course – Enrol Now.

To learn more about Machine Learning Using Python and Spark – Enrol Now.
To learn more about Data Analyst with SAS Course – Enrol Now.
To learn more about Data Analyst with Apache Spark Course – Enrol Now.
To learn more about Data Analyst with Market Risk Analytics and Modelling Course – Enrol Now.

Import and Export of dataset using SAS and R

Import and Export of dataset using SAS and R
 

For an analyst, data is a primary raw material, which is used to draw conclusions and inferences for taking business decisions. Raw data is of less help to draw conclusions and inferences. Hence, we need to put the data into any statistical analysis software to slice and dice to bring inference for better decision making. In this post, we will discuss about the steps to import and export of a dataset using SAS and R.

Continue reading “Import and Export of dataset using SAS and R”

Call us to know more