SAS Analytics Archives - DexLab Analytics | Big Data Hadoop SAS R Analytics Predictive Modeling & Excel VBA

Banking Business and Banking Instruments

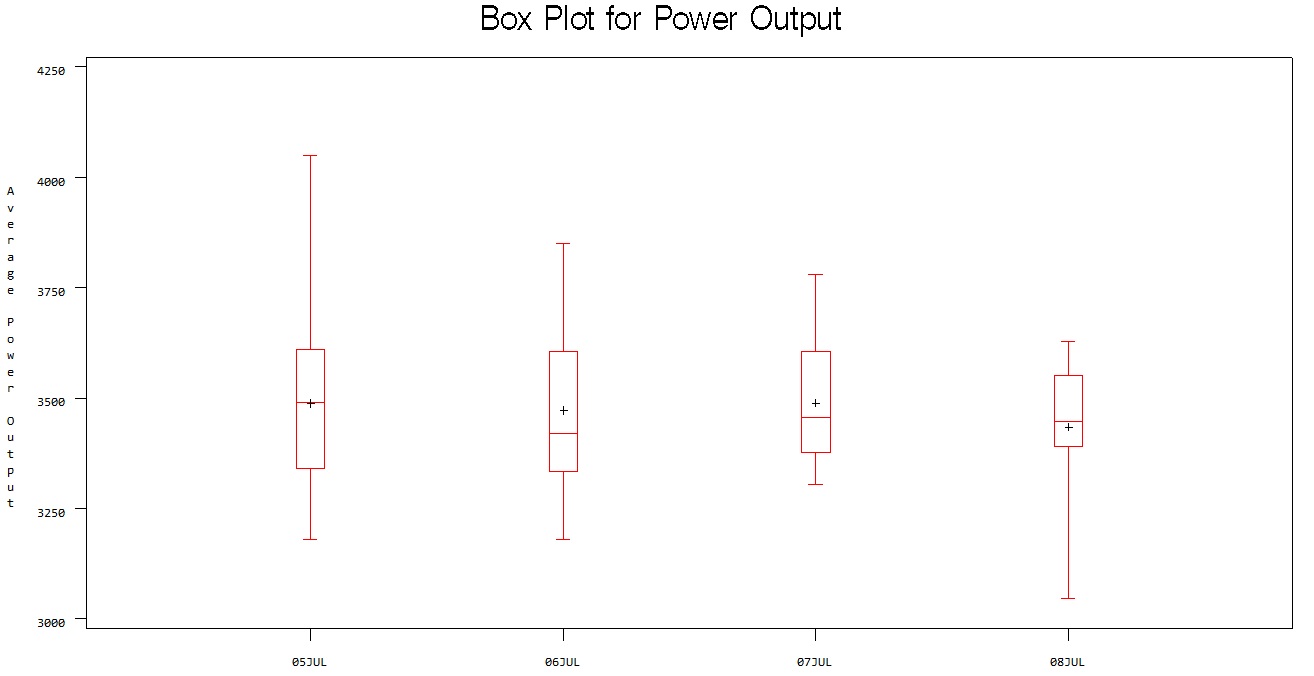
Having discussed some amount of mandatory regulatory compliances for banks over the past couple of blogs, let us now focus on the bank’s lines of business. Understanding the different banking products is inevitable for credit risk management and analytics. One has to be well versed with the nature of banking products before they step in to develop model for any of them.  Each banking product has its own characteristics and its own set of risk exposure. Hence, understanding these products is the top priority. In this blog we discuss three of the major banking products: Checking Accounts, Savings accounts and Certificate of Deposits.


BANKING BUSINESS AND BANKING INSTRUMENTS- Part 1


Checking Accounts: This is a transactional deposit account held at a financial institution that allows for withdrawal and deposits. Money held in a checking account is liquid, and can be easily withdrawn using checks, automated cash machines, and electronic debits among other methods. It allows for numerous withdrawals, unlimited deposits etc. These accounts are known as current accounts in UK. These are often loss leaders for large commercial banks since they become highly commotized. Because money held in checking accounts is so liquid, aggregate balances nationwide are used in the calculation of M1 money supply. Continue reading “Banking Business and Banking Instruments”

Trials Against WPL Awarded SAS With Damages

In a groundbreaking trial judgment, WPL (World Programming Ltd.) was found to have conducted software license breach and fraud and was made to pay damages to SAS. A federal jury found that WPL violated its software license for SAS learning edition with reverse engineering parts of the product to create their own WPS or World Programming System software while still using the SAS Learning edition to meet their production requirements.

Trials against WPL awarded SAS with damages


After the jury found this misconduct, the company was directed to pay SAS a penalty of USD 26.4 million in damages. Furthermore, WPL was also found to have committed fraud against SAS by the jury that required them to further pay another USD 3 million to SAS in terms of punitive damages. It was also concluded by the jury that WPL violated the NC Unfair and Deceptive Trade Practices Act that mandates the company to pay treble damage charges to SAS. The cumulative penalty judgment amounted to as much as USD 79 million. As per reports SAS will seek the help of parliament injunction on the issue to control sale of or use of WPS products in the US.

A representative of SAS revealed in a statement that the proofs they were able to collect enabled the jury to come to a conclusion quite fast that further validated the talk of the town about the practices of WPS that suggests that they did take part in unfair practices.SAS is currently the leading programming software in the world of Business Analytics. As per records the program helps users of more than 75,000 websites to make better and faster decisions using data.

Their work philosophy of – giving clients around the world “the power to know” (as is their tagline); using data tools is slowly taking over the market. They have been operating in the data industry since 1976. And all their products and services are trademarked under the name SAS Institute Inc. in the US and other countries.


Source : http://www.marketwired.com/press-release/sas-awarded-damages-in-trial-against-world-programming-ltd-2063069.htm

Quantitative Analysis 2 – Box Plot

As we discussed about the Five Number Summary in the earlier blog post, we will continue to explore the Five Number Summary using Box Plot. Box Plot helps an analyst to identify the distribution of a numeric variable across multiple categorical variables. Box Plot is a graphical representation of data that shows a data set’s lowest value, highest value, median value and the size of the first and third quartile.

In the below example, we are inputting the data into the Base SAS using a simple data step procedure. We are creating a dataset called Turbine that has an average power output on a daily basis.

Box Plot 1

SAS Code to input the data:

data Turbine;
informat Day date7.;
format Day date5.;
label KWatts=’Average Power Output’;
input Day @;
do i=1 to 10;
input KWatts @;
output;
end;
drop i;
datalines;
05JUL94 3196 3507 4050 3215 3583 3617 3789 3180 3505 3454
05JUL94 3417 3199 3613 3384 3475 3316 3556 3607 3364 3721
06JUL94 3390 3562 3413 3193 3635 3179 3348 3199 3413 3562
06JUL94 3428 3320 3745 3426 3849 3256 3841 3575 3752 3347
07JUL94 3478 3465 3445 3383 3684 3304 3398 3578 3348 3369
07JUL94 3670 3614 3307 3595 3448 3304 3385 3499 3781 3711
08JUL94 3448 3045 3446 3620 3466 3533 3590 3070 3499 3457
08JUL94 3411 3350 3417 3629 3400 3381 3309 3608 3438 3567
;
run;

SAS Code to plot Box Plot:

title ‘Box Plot for Power Output’;

proc boxplot data=Turbine;

plot KWatts*Day;

run;
SKEWS in the data:
The Box Plot not only helps you to find the Five Number Summary, you can also find which way the data is skewed.
You can see in the below Box Plot, the data for the day 05July is Right Skewed and the data for 08July is Left Skewed. You can plot a box plot for the sales data across every month in a year. You can find whether any Skewness in you sales data of a month by looking at the Box Plot. This can help you identify the variances and the data distribution for the sales.

The prime importance of using Box Plot and interpretation of data distribution is that Box Plot helps to read the data distribution across multiple series of categories. A single Box Plot can helps you to identify the data distribution rather than looking at single data distribution.
You can create a Box Plot by following the below code in R.
Boxplot(KWatts ~ Day, data=Turbine, main= “Box Plot for Power Output”, xlab = “Average Power Output”, ylab = “Days”)
R software gives lot of functions to play around the Box Plot with different colors. You can explore those options for better interpretation and the visual appealing for presenting your analysis.

Call us to know more