R Programming Online Training Archives - DexLab Analytics | Big Data Hadoop SAS R Analytics Predictive Modeling & Excel VBA

Periscope Data Adds Python, R and SQL on A Single Platform for Better, Powerful Data Analysis

Periscope Data Adds Python, R and SQL on A Single Platform for Better, Powerful Data Analysis

Recently, a veteran data analytics software provider, Periscope Data announced some brand new developments while updating their Unified Data Platform for Python, R programming and Structured Query Language. This new Unified Data Platform will enable data professionals to work in sync with 3 key skills all on a single platform.  Far more better analysis will be conducted using less time by altering data in SQL, executing complex statistical analyses in Python or R, followed by improved visualization, collaboration and reporting of results – all performed on Periscope’s dynamic analytics platform.

A massive data explosion is taking place around the world around us. More than 90% of the world’s data has been created in the past two years, and the numbers are still on the rise. To this, new levels of sophistication needs to be added to analyze the complexity of data – “The addition of Python and R support to our Unified Data Platform gives our customers a unique combination of tools – from machine learning to natural language processing to predictive analytics, analysts will be able to answer new questions that have yet to be explored,” says Harry Glaser, co-founder and CEO of Periscope Data.

The inclusion of Python and R support in Periscope framework comes with ample benefits, and some of them are highlighted below:

2

All data at a single place

Instead of relying on several data sources, Periscope Data prefers to combine data together collected from various databases to bring them to a single platform, where nothing but a single source of truth for data is established. The data collected is updated and in crisp format.

Predictive analytics

It’s time to leverage Python and R libraries and move beyond the conventional historical reporting for the sake of modeling predictions. With lead scoring and churning prediction, businesses are now in a better position to derive significant insights about a future of a company.

No more switching between tools

Seamlessly, users can switch between querying data in SQL and analyzing data in R or Python, all at the same time on a same platform. Data professionals will be able to modify their datasets, enhance the performance of their models and update visualizations from a single location.

Mitigate data security concerns

The integration of R, Python and SQL by Periscope Data ensures the data professionals can run and share all sorts of models securely and in full compliance with all the norms, instead of seeking open source tools. Periscope Data is SOC2 and HIPAA compliant. It performs regular internal audits to check compliance requirements and safety issues.

Efficient collaboration with teams

As all the analysis takes place in a central location, be sure all your insights will be thoroughly consistent, secure and free of any version-control issues. Also, Periscope Data allows you and your team members the right to read and write access when required.

Easy visualization of analysis

To develop powerful visualizations that reach one’s heart and mind, leverage Periscope’s resources to the optimum levels. Data teams allow users to easily visualize through R packages and Python libraries so as to nudge users to explore the better horizons of data.

To learn more about R programming or Python, opt for Python & Spark training by DexLab Analytics. R language certification in Delhi NCR empowers students and professionals to collaborate and derive better insights faster and efficiently.


Interested in a career in Data Analyst?

To learn more about Data Analyst with Advanced excel course – Enrol Now.
To learn more about Data Analyst with R Course – Enrol Now.
To learn more about Big Data Course – Enrol Now.

To learn more about Machine Learning Using Python and Spark – Enrol Now.
To learn more about Data Analyst with SAS Course – Enrol Now.
To learn more about Data Analyst with Apache Spark Course – Enrol Now.
To learn more about Data Analyst with Market Risk Analytics and Modelling Course – Enrol Now.
Top 5 Programming Languages to Learn in 2018

Who doesn’t want to ace the rat race!! Owing to robust technological innovations and globalization, staying on top has become an essential factor for professional success.

 
Top 5 Programming Languages to Learn in 2018
 

Amidst this, technology plays a key role. The job profiles of data scientists are fetching maximum attention. At present, they are among the most in-demand professionals around the globe bagging in handsome paychecks. Nevertheless, it’s no mean feat to become one, the process of education and training is highly intricate and demands unparalleled acumen, expertise and skill.


And with more than 600 incredible programming languages to learn, data scientists go haywire when it comes to the choosing part. While Java, Python, JavaScript, R remains the top-priority languages to impress the employers, newer, more innovative languages are also blocking the space, time and again.

Continue reading “Top 5 Programming Languages to Learn in 2018”

How R Programming is Transforming Business for Good

Today, every business is putting efforts to understand their customers and themselves, better. But, how? What methods are they applying? Do mere Excel pivot tables help analyze vast pool of data? The answer to the latter question is in the negative – Excel pivot tables are not that great at analyzing data – so a wide number of companies look forward to SAS and R Programming to cull Business Intelligence.

 
How R Programming is Transforming Business for Good
 

Besides SAS, R-Programming is another open-source language that is used by most of the budding data scientists in the world of analytics. The R Programming language is more oriented towards the correct implication of data science, while ensuring business the cutting edge data analysis tools. Continue reading “How R Programming is Transforming Business for Good”

How to create Chart Templates with R Functions

R functions are used to produce chart templates to keep the look and feel of the reports intact.

 
How to create Chart Templates with R Functions
 

In this post you will come across how to create chart templates with R functions – all the R users should be accustomed to the calling functions so as to perform calculations and outline plots accurately. Remember what colors and fonts to use each time: R functions are used as a short-cut for producing customary-looking charts.

Continue reading “How to create Chart Templates with R Functions”

Analyze Smartphone Sensor Data with R and the BreakoutDetection Package

Analyze-Smartphone-Sensor-Data-with-R-and-the-BreakoutDetection-Package

Quite interetsing. Juggling with sensor data is starkly different from economics data, document processing or social networking, but very worthwhile. In this blog, we will take a practical approach to analyze smartphone sensor data with R. We are going to use the accelerometer smartphone data that Datarella presented in its Data Fiction competition. The dataset signifies the stimulation along the three axes of the smartphone:


x – for sideways stimulation

y – for forward and backward stimulation

z – for upward and downward stimulation


The trickier part lies in its interpretation – on one hand where there are device, manufacturer and sensor specific mutations and artifacts, the other reflects all acceleration is calculated relative to the sensor orientation of the device. For example, taking out the cell phone out of your pocket and reading a tweet can be presented in the following way:


y acceleration – the phone was in the pocket top down but now has been taken out

z and y acceleration – tossing the phone so that it becomes horizontal

x acceleration – moving the smartphone from the left to the middle of your body

z acceleration – bringing  up the phone so that you can read the tweet clearly

And thirdly, the gravity influences all the movements.


Seeking R programming courses in Gurgaon? Feel free to reach us at DexLab Analytics..

Knowing exactly what to do with your smartphone can be quite intimidating – let us introduce an application of the Twitter BreakoutDetection Open Source library (see Github), which is used extensively for Behavioral Change Point analysis.

First, I have loaded the dataset and this is how it looks like:

setwd("~/Documents/Datarella")
accel <- read.csv("SensorAccelerometer.csv", stringsAsFactors=F)
head(accel)

  user_id           x          y        z                 updated_at                 type
1      88 -0.06703765 0.05746084 9.615114 2014-05-09 17:56:21.552521 Probe::Accelerometer
2      88 -0.05746084 0.10534488 9.576807 2014-05-09 17:56:22.139066 Probe::Accelerometer
3      88 -0.04788403 0.03830723 9.605537 2014-05-09 17:56:22.754616 Probe::Accelerometer
4      88 -0.01915361 0.04788403 9.567230 2014-05-09 17:56:23.372244 Probe::Accelerometer
5      88 -0.06703765 0.08619126 9.615114 2014-05-09 17:56:23.977817 Probe::Accelerometer
6      88 -0.04788403 0.07661445 9.595961  2014-05-09 17:56:24.53004 Probe::Accelerometer

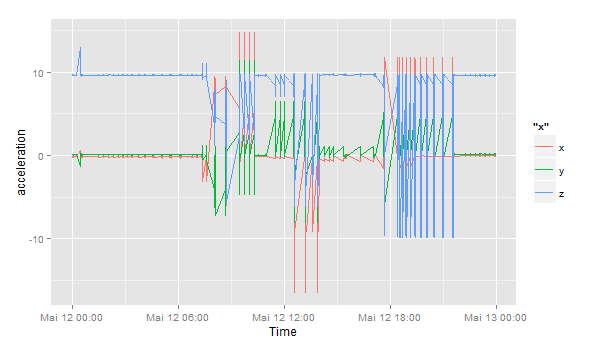
This data includes the sensor data per user per day:

accel$day <- substr(accel$updated_at, 1, 10)
df <- accel[accel$day == '2014-05-12' & accel$user_id == 88,]
df$timestamp <- as.POSIXlt(df$updated_at) # Transform to POSIX datetime
library(ggplot2)
ggplot(df) + geom_line(aes(timestamp, x, color="x")) + 
             geom_line(aes(timestamp, y, color="y")) + 
             geom_line(aes(timestamp, z, color="z")) + 
             scale_x_datetime() + xlab("Time") + ylab("acceleration")

sensor_all

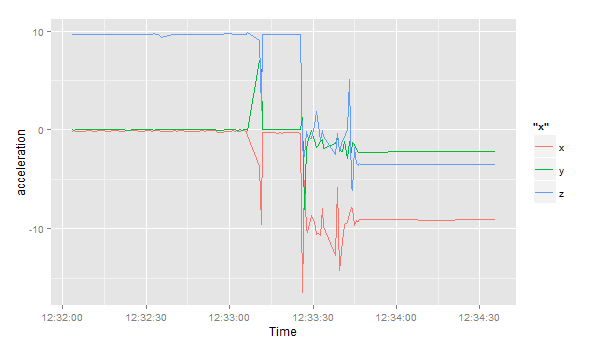
Let’s focus on the period between 12:32 and 13:00:

ggplot(df[df$timestamp >= '2014-05-12 12:32:00' & df$timestamp < '2014-05-12 13:00:00',]) +
  geom_line(aes(timestamp, x, color="x")) + 
  geom_line(aes(timestamp, y, color="y")) + 
  geom_line(aes(timestamp, z, color="z")) + 
  scale_x_datetime() + xlab("Time") + ylab("acceleration")

sensor_zoom

Following all this, I load the Breakoutdetection library:

install.packages("devtools")
devtools::install_github("twitter/BreakoutDetection")
library(BreakoutDetection)
bo <- breakout(df$x[df$timestamp >= '2014-05-12 12:32:00' & df$timestamp < '2014-05-12 12:35:00'], 
               min.size=10, method='multi', beta=.001, degree=1, plot=TRUE)
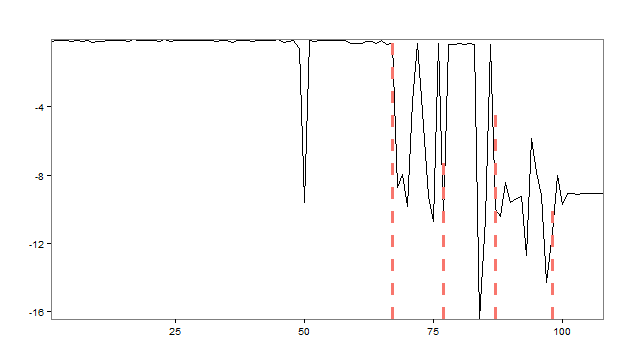
bo$plotsensor_breakout

The rapid analysis of the acceleration in the x direction presents us with 4 change points, in which the stimulation suddenly starts to change. At the start, the smartphone normally lies flat on a horizontal surface – the sensor reading revolves around value of 9.8 in a positive direction – which means the gravitational force only triggers this axis and not the x or y axes. Therefore, the phone is lying flat. However, things change and after a couple of movements or changing directions, the last observation reveals the phone has been on a position where the x axis has 9.6 acceleration, meaning the phone is being positioned in a landscape orientation facing the right.

Get the best R Analytics Certification in Gurgaon from our seasoned experts at DexLab Analytics.

 
This post originally appeared onwww.r-bloggers.com/how-to-analyze-smartphone-sensor-data-with-r-and-the-breakoutdetection-package
 

Interested in a career in Data Analyst?

To learn more about Data Analyst with Advanced excel course – Enrol Now.
To learn more about Data Analyst with R Course – Enrol Now.
To learn more about Big Data Course – Enrol Now.

To learn more about Machine Learning Using Python and Spark – Enrol Now.
To learn more about Data Analyst with SAS Course – Enrol Now.
To learn more about Data Analyst with Apache Spark Course – Enrol Now.
To learn more about Data Analyst with Market Risk Analytics and Modelling Course – Enrol Now.
Using R Programming to Simulate the Incredible Pong Arcade Game

Unleashed in the market in 1972, Pong is one of the first computer games ever developed. Loosely inspired by tennis, Pong captured the worldwide gaming market soon after its launch. Instantaneously, it became a trending fad. Gaming enthusiasts became intrigued, they desired to delve deeper into the computer coding and system mechanisms mostly to understand the essence of arcade game development.

 
Using R Programming to Simulate the Incredible Pong Arcade Game
 

Today, R-Programming is extensively used to develop numerous board games. But the question to ponder on is – can we create traditional arcade games with R programming?

Continue reading “Using R Programming to Simulate the Incredible Pong Arcade Game”

How to Assess Clustering Tendency: Unsupervised Machine Learning

How To Assess Clustering Tendency: Unsupervised Machine Learning

The meaning of clustering algorithms include partitioning methods (PAM, K-means, FANNY, CLARA etc) along with hierarchical clustering which are used to split the dataset into two groups or clusters of similar objects.

A natural question that comes, before applying any clustering method on the dataset is:

Does the dataset comprise of any inherent clusters?

A big problem associated to this, in case of unsupervised machine learning is that clustering methods often return clusters even though the data does not include any clusters. Put in other words, if one blindly applies a clustering analysis on a dataset, it will divide the data into several clusters because that is precisely what they are supposed to do. Continue reading “How to Assess Clustering Tendency: Unsupervised Machine Learning”

What Sets Apart Data Science from Big Data and Data Analytics

What Sets Apart Data Science from Big Data and Data Analytics

Today is a time when omnipresent has a whole new definition. We no longer think about the almighty, omnipotent and omnipresent God when we speak about being everywhere. Nowadays we mostly mean data when we hear the term “present everywhere”. The amount of digital data that populates the earth today is growing at a tremendous rate, doubling over every two years and transforming the way we live.

As per IBM, an astounding amount of 2.5 Billion gigabytes of data is generated every day since the year 2012. Another revelation made by an article published in the Forbes magazine stated that data is growing faster than ever before today, and by the year 2020 almost 1.7 megabytes of new information will be created every second by every human being on this earth. And that is why it is imperative to know the fundamental basics of this field as clearly this is where our future lies.

In this article, we will know the main differentiating factors between data science, Big Data analysis and data analytics. We will discuss in detail about the points such as what they are, where they are used, and the skills one needs to be a professional in these fields, and finally the prospect of salary in each case.

2

First off we start with the understanding of what these subjects are:

What is data science?

Data science involves dealing with unstructured and structured data. It is a field that consists of everything that relates to cleansing of data, preparation and analysis. It can be defined as the combination of mathematics, analytics, statistics, programming, capture of data and problem solving. And all of that in the most ingenious ways with an amazing ability to look at things from a unique perspective. They professionals involved with this field should be proficient in data preparation, cleansing, and alignment of data.

To put it simply, this is the umbrella of techniques which is used to extract insights and information from the data.

What do we mean by Big Data?

As the name suggests, Big Data is nothing but a mammoth amount of data. This is so huge that it cannot be processed effectively with the existing traditional applications. The processing of Big Data starts with working with raw data that is not very well aggregated and is almost impossible to store in the memory of only one single computer.

It is now a popular buzzword filling up the job portals with vacancies. And is used to denote basically a large number of data, both structured and unstructured. It inundates a business on a daily basis. It is a prime source of information that can be used to take better decisions and proper strategic business moves.

As per Gartner, Big Data can be defined as high velocity, high volume and high variety information assets which demand cost efficient, innovative forms of information processing that enable improved insight, better decision making, and a procedural automation.

Thus a Big Data certification, can help you bag the best paying jobs in the market.

Understanding data analytics:

Data Analytics is the science of assessing raw data with the purpose of drawing actionable insights from the same.

It basically involves application of algorithms in a mechanical and systematic process to gather information. For instance, it may involve a task like running through a large number of data sets to look for comprehensible correlations between one another.

The main focus for data analytics is concentrated on interference, which is the procedure for deriving conclusions which are mainly based on what the researchers already are aware of.

Where can I apply my data science skills?

  • On internet searching: search engines use data science algorithms
  • For digital ads: data science algorithms is an important aspect for the whole digital marketing spectrum.
  • Recommender systems: finding relevant products from a list of billions available can be found easily. Several companies and ecommerce retailers use data to implement this system.

Big Data applicability:

The following sectors use Big Data application:

  • Customer analysis
  • Fraud analytics
  • Compliance analytics
  • Financial services, credit risk modelling
  • Operational analytics
  • Communication systems
  • Retailers

Data analysis scope and application:

  1. Healthcare sector for efficient service and reduction of cost pressure
  2. Travel sector for optimizing buying experience
  3. Gaming industry for deriving insights about likes and dislikes of gamers
  4. For management of energy, with smart grid management, energy optimization distribution and also used by utility companies.

Here is an infographic that further describes all there is to know about these trending, job-hungry sectors that are growing at a tremendous rate:

Don’t Be Bamboozled by The Data-Jargon: Difference in Detween The Data Fields


Now that you know what the path to career success, looks like stop waiting and get a R Analytics Certification today.


Interested in a career in Data Analyst?

To learn more about Data Analyst with Advanced excel course – Enrol Now.
To learn more about Data Analyst with R Course – Enrol Now.
To learn more about Big Data Course – Enrol Now.

To learn more about Machine Learning Using Python and Spark – Enrol Now.
To learn more about Data Analyst with SAS Course – Enrol Now.
To learn more about Data Analyst with Apache Spark Course – Enrol Now.
To learn more about Data Analyst with Market Risk Analytics and Modelling Course – Enrol Now.
Is Data an Asset or Liability

While many firms are stating that they leverage their data to gain valuable insights and translate them into profit. But the basic question remains whether data is an asset or a liability. This is the mind-numbing question that haunts all IT managers and must be given ample concentration on what is collected in terms of data and how can it be managed efficiently.


Is data an asset or liability


There can be two approaches to answer this question, the first being that data could be an asset if used ethically and correctly. But when no actionable insight can be gathered from data, it is a liability in the same lines as an old non-performing loan. Optimum use of data is elemental to the operations of any data driven initiative. The main reason behind this data-drive remains to be to obtain faster and better decision making abilities with more accuracy. Nowadays organizations across the board leverage their data to achieve their goals. Currently sales organizations are the frontrunners who mine their data to get the best results and maximize their revenue from already customers. Also crediting companies use their data to evaluate the risks associated with different individual debtors and then act accordingly when setting rates and fees for their loans that seem to be fair based on this information. In these scenarios the companies use real information to make decisions.

Continue reading “Is Data an Asset or Liability”

Call us to know more