R programming courses in Noida Archives - DexLab Analytics | Big Data Hadoop SAS R Analytics Predictive Modeling & Excel VBA

R Programming: The Language Marketers Use to Tame Data

R Programming: The Language Marketers Use to Tame Data

How to manage data? This is a question that’s baffles us each and every time, whenever we look at data.

The real challenge is not about managing data, but how to synchronize processes to expose the issues with data. Today’s marketers may have a tough time tackling these challenges. Even more for non-tech-savvy marketers, they may be feel a bit overwhelmed, but we’ve a solution – R programming language is capable of performing specific tasks while preparing data for machine learning models or advanced analytics.

2

Basics of R

R programming is a popular open source language ideal for smart data visualization and statistical modeling. Generally, it functions through a terminal on a laptop, but you can also enjoy development environment software that makes R quite user-friendly.

One of the most sought after Integrated Development Environment (IDE) is RStudio – it’s very popular amongst practitioners mostly owing to its quad-window view, which let users view their results in the terminal beside the whiteboard platform.

Exploring Data with R

Data importing is the starting point of analyzing data. Fortunately, a more than sufficient number of R programming libraries exist today that are up to interface with a database or an API. Some of these libraries are: twitteR, RMongo and Jsonlite. A quick search across Comprehensive R Archive Network will help you find them.

Next, you have to turn your attention to data wrangling. It’s the method of mapping one row format to another, while amalgamating, dividing and rearranging rows and columns. Map out the metrics after ascertaining whether a task falls under one of the following mathematical categories:

  • Discrete Metrics
  • Continuous Metrics

Another significant step is corroborating the columns decided: are headers from the data source given? R Programming helps add headers on data as soon as data is imported. Furthermore, another question that pops up here is that are the headers from the same labels of parties who have access to data? Now, this question is instrumental in answering whether there is any more efficient way to have access to data consecutively without manually rectifying columns before placing the data in a model.

For R programming, some of the basic libraries to consider are as follows:

Readr – It helps estimate functions and read data in rectangular tabular formats

Tidyr – It helps in organizing missing field values and arranging tabular data in an effective and compatible structure

Dplyr – Ideal for transforming data after it’s added in R

Marketing Knowledge Is Still an Add-On Factor

Lastly, marketers should never ignore their domain knowledge, while modeling data. At times, your experience will help you tackle an outlier for a model in the best way possible. Or else, you might ask your technical team to adjust and manage data in cloud in a situation where other teams try to downstream assess data.

Thus, a relevant marketing knowledge is essential. It will help decide which data to be queried or how to parse it well.

If you are thinking of learning a popular yet effective programming language to tame your data, R Programming certification in Delhi NCR is the best solution for you. A good R programming training will help you understand and evaluate data like a pro.


The blog first appeared on ― www.cmswire.com/digital-marketing/how-marketers-can-plan-data-mining-with-r-programming


Interested in a career in Data Analyst?

To learn more about Data Analyst with Advanced excel course – Enrol Now.
To learn more about Data Analyst with R Course – Enrol Now.
To learn more about Big Data Course – Enrol Now.

To learn more about Machine Learning Using Python and Spark – Enrol Now.
To learn more about Data Analyst with SAS Course – Enrol Now.
To learn more about Data Analyst with Apache Spark Course – Enrol Now.
To learn more about Data Analyst with Market Risk Analytics and Modelling Course – Enrol Now.

Most Popular R Programming Interview Questions with Answers to Help You Get Started

Most Popular R Programming Interview Questions with Answers to Help You Get Started

Brainchild of Ross Ihaka and Robert Gentleman, R programming language was first developed in 1993 with an exclusive and extensive catalog of statistical and graphical techniques and processes, including machine learning, time series, linear regression, statistical inference and lot more.

In the following section, we’re about to talk about top interview questions on R programming –perfect for both freshers and experienced consultants, this interesting interview guide covers almost all the major concepts of R and its applications.

Dive Down!

2

What is R programming?

R programming is an ideal language used for data analysis, and to build incredible statistical software. It’s widely used for a wide range of machine learning applications.

How to write syntax for R commands?

When you start writing commands in R, start using # in the beginning of the line, so that the commands are written as #division.

How to project data analysis outcome through R language?

The best way to convey the results would be by combining the results of data, code and analysis on a document and present the data for further reproducible research. It would help the user recheck the result and take part in the following discussions. The reproducible research aids in performing experiments easily and solving crucial problems.

What are the data structures found in R programming?

Homogenous and Heterogeneous are two data structures found in R programming. For same kinds of objects, we suggest using homogenous data structures as for Array, Vectors and Matrix. And for different types of objects, it’s better to stick to heterogeneous data structures.

How should you import data in R language?

Importing of data in R is done with the help of R commander GUI – it’s used to type commands and is also known as Rcmdr.

Here are 3 ways to import data into R:

  • As soon as you select data set from the dialog box, enter the date set name as asked.
  • R command can also be used to enter data – Data-> New Data Set (It’s only applicable for small data sets).
  • The user can also import data directly from URL, through simple ASCII file, statistical package or from clipboards.

Highlight the advantages of R programming language.

  • The user doesn’t get entangled in license restrictions and norms for using R programming.
  • It’s an open source software and completely free of cost.
  • It has several graphical capabilities.
  • It is easily run on a majority of hardware and OS (including 32 and 64-bit processors).

Mention the limit for memory in R.

For a 32-bit system, the memory of R is limited to 3GB. And for a 64-bit system, the limit is extended to 8TB.

With this, hope you are ready to crack a tough job interview on R programming – however, for those, who want to dig deeper into the intricacies of this fascinating programming language, we have fabulous R programming courses in Gurgaon. With them discover the path towards a dream career!


The blog has been sourced from www.janbasktraining.com/blog/r-interview-questions-answers


Interested in a career in Data Analyst?

To learn more about Data Analyst with Advanced excel course – Enrol Now.
To learn more about Data Analyst with R Course – Enrol Now.
To learn more about Big Data Course – Enrol Now.

To learn more about Machine Learning Using Python and Spark – Enrol Now.
To learn more about Data Analyst with SAS Course – Enrol Now.
To learn more about Data Analyst with Apache Spark Course – Enrol Now.
To learn more about Data Analyst with Market Risk Analytics and Modelling Course – Enrol Now.
3 Most Used Data Science Tools in 2018

The humongous amount of data calls for advanced data science tools – to completely understand and analyze the information.

Data analytics fuels digital transformation. The best way to do this is by arming an expert pool of statisticians, math pundits and business analysts with suitable data science tools with which they can squelch out crucial insights from the ever-growing silos of corporate data. This kind of initiatives promote a data-driven business culture, which acts as a present prerequisite – and this why here we’ve jotted down top 3 data science tools that’s weaving wonders with the new oil of the world, data:

2

Python

Both, well-performing software and a powerful programming language perfect for developing custom algorithms, Python is the most must-have tool for all data scientists. In a recent KDnuggets survey of 2052 users, Python language was recommended by 65.6% of respondents.

“We use Python both for data science and back end, which provides us with rapid development and machine learning model deployment,” shared Alexander Osipenko, lead data scientist at Cindicator Inc. “It’s also of great importance for us to ensure the security of implemented tools.”

Leslie De Jesus, innovation director and lead data scientist at Wovenware emphasized on the importance of Python libraries. “[We use] Python Libraries, including Scrapy, for web scraping and being able to extract data from the internet and upload it into a data frame for analysis,” said De Jesus.

Few others vouched for Python because of its multifaceted nature and strong optimization skills.

For Python Certification Training in Delhi, drop by DexLab Analytics.

R

Quite similar to Python, R is the go-to programming language for many data scientists and they depend on it wholly because it’s simpler and more specifically-built for data science. According to the KDnuggets poll, 48.5% respondents voted it to be one of the leading data science tools.

As for all, R programming language is blessed with cultivated capabilities for machine learning and statistics, and professionals love using it. It’s another favorite of data analysts, especially those who deals with a lot of data exploration.

“I can quickly see summary stats like mean, median and quartiles; quickly create different graphs; and create test data sets, which can be easily shared and exported to CSV format,” said Jon Krohn, chief data scientist at Untapt Inc.

Seeking R language certification in Delhi? We have DexLab Analytics for you!

Tableau

Bridging the gap between skilled data science teams and more business-oriented analytics consultants, Tableau Software is the fastest data visualization and dashboard tool. “It is a fantastic tool for data scientists and noobs working on data science,” said Pooja Pandey, senior executive for SEO at Entersoft Security. “[It’s a] quick dashboarding tool to visualize insights and analytical data with a very short learning curve.”

The lightening speed of Tableau’s visualization and reporting functions is commendable. It’s easy to learn, quick to implement and intuitive to use. Moreover, it helps different segments of a company to customize exhaustive reports according to their requirements.

Now, if you are looking for ways to hone your visualization skills, we would recommend Tableau BI training courses from DexLab Analytics. Their training courses are comprehensive, well-research and as per industry standards.


The blog has been sourced fromsearchbusinessanalytics.techtarget.com/feature/Data-scientists-weigh-in-5-data-science-tools-to-consider


Interested in a career in Data Analyst?

To learn more about Data Analyst with Advanced excel course – Enrol Now.
To learn more about Data Analyst with R Course – Enrol Now.
To learn more about Big Data Course – Enrol Now.

To learn more about Machine Learning Using Python and Spark – Enrol Now.
To learn more about Data Analyst with SAS Course – Enrol Now.
To learn more about Data Analyst with Apache Spark Course – Enrol Now.
To learn more about Data Analyst with Market Risk Analytics and Modelling Course – Enrol Now.
Citizen Data Scientists: Who Are They & What Makes Them Special?

Citizen Data Scientists: Who Are They & What Makes Them Special?

Companies across the globe are focusing their attention on data science to unlock the potentials of their data. But, what remains crucial is finding well trained data scientists for building such advanced systems.

Today, a lot many organizations are seeking citizen data scientists – though the notion isn’t something new, the practice is fairly picking up pace amongst the industries. Say thanks to a number of factors, including perpetual improvement in the quality of tools and difficulty in finding properly skilled data scientists!

Gartner, a top notch analyst firm has been promoting this virgin concept for the past few years. In 2014, the firm predicted that the total number of citizen data scientists would expand 5X faster than normal data scientists through 2017. Although we are not sure if the number forecasted panned out right but what we know is that the proliferating growth of citizen data scientists exceeded our expectations.

Recently, Gartner analyst Carlie Idoine explained a citizen data scientist is one who “creates or generates models that use advanced diagnostic analytics or predictive and prescriptive capabilities, but whose primary job function is outside the field of statistics and analytics.” They are also termed as “power users”, who’ve the ability to perform cutting edge analytical tasks that require added expertise. “They do not replace the experts, as they do not have the specific, advanced data science expertise to do so. But they certainly bring their OWN expertise and unique skills to the process,” she added.

Of late, citizen data scientists have become critical assets to an organization. They help businesses discover key big data insights and in the process are being asked to derive answers from data that’s not available from regular relational database. Obviously, data can’t be queried through SQL, either. As a result, citizen data scientists are found leveraging machine learning models that end up generating predictions from a large number of data types. No wonder, SQL always sounds effective, but Python statistical libraries and Jupyter notebooks helps you further.

 A majority of industries leverages SQL; it has been data’s lingua franca for years. The sheer knowledge of how to write a SQL query to unravel a quiver of answers out of relational databases still remains a crucial element of company’s data management system as a whole lot of business data of companies are stored in their relational databases. Nevertheless, advanced machine learning tools are widely gaining importance and acceptance.

A wide array of job titles regarding citizen data scientists exists in the real world, and some of them are mutation of business analyst job profile. Depending on an organization’s requirements, the need for experienced analysts and data scientists varies.

Looking for a good analytics training institute in Delhi? Visit DexLab Analytics.

DataRobot, a pioneering proprietary data science and machine learning automation platform developer is recently found helping citizen data scientists through the power of automation. “There’s a lot happening behind the scenes that folks don’t realize necessarily is happening,” Jen Underwood, a BI veteran and the recently hired DataRobot’s director of product marketing said. “When I was doing data science, I would run one algorithm at a time. ‘Ok let’s wait until it ends, see how it does, and try another, one at a time.’ [With DataRobot] a lot of the steps I was taking are now automated, in addition to running the algorithms concurrently and ranking them.”

To everyone’s knowledge, Big Data Analytics is progressing, capabilities that were once restricted within certain domains of professionals are now being accessible by a wider pool of interested parties. So, if you are interested in this new blooming field of opportunities, do take a look at our business analyst training courses in Gurgaon. They would surely help you in charting down a successful analyst career.


The blog has been sourced fromdatanami.com/2018/08/13/empowering-citizen-data-science


Interested in a career in Data Analyst?

To learn more about Data Analyst with Advanced excel course – Enrol Now.
To learn more about Data Analyst with R Course – Enrol Now.
To learn more about Big Data Course – Enrol Now.

To learn more about Machine Learning Using Python and Spark – Enrol Now.
To learn more about Data Analyst with SAS Course – Enrol Now.
To learn more about Data Analyst with Apache Spark Course – Enrol Now.
To learn more about Data Analyst with Market Risk Analytics and Modelling Course – Enrol Now.

R Programming, Python or Scala: Which is the Best Big Data Programming Language?

R Programming, Python or Scala: Which is the Best Big Data Programming Language?

For data science and big data, R, Python and Scala are the 3 most important languages to master. It’s a widely-known notion, organizations of varying sizes relies on massive structured and unstructured data to predict trends, patterns and correlations. They are of expectation that such a robust analysis will lead to better business decisions and individual behavior predictions.

In 2017, the adoption of Big Data analytics has spiked up to 53% in companies – says Forbes.

The story of evolution

To start with, big data is just data, after all. The entire game-play depends on its analysis – how well the data is analyzed so as to churn out valuable business intelligence. With years, data burgeoned, and it’s still expanding. The evolution of big data mostly happened because traditional database structures couldn’t cope with such multiplying data – scaling data became an important issue.

For that, here we have some popular big data programming languages. Dive down:

R Programming

R Programming is mainly used for statistical analysis. A set of packages are available for R named Programming with Big Data in R (pbdR), which encourages big data analysis, across multiple systems via R code.

R is robust and flexible; it can be run on almost every OS. To top that, it boasts of excellent graphical capabilities, which comes handy when trying to visualize models, patterns and associations within big data structures.

According to industry standards, the average pay of R Programmers is $115,531 per year.

For R language training, drop by DexLab Analytics.

Python

Compared to R, Python is more of a general-purpose programming language. Developers adore it, because it’s easy to learn, a huge number of tutorials are available online and is perfect for data analysis, which requires integration with web applications.

Python gives excellent performance and high scalability for a series of complicated data science tasks. It is used with high-in-function big data engines, like Apache Spark through available Python APIs.

Their Machine Learning Using Python courses are of highest quality and extremely student-friendly.

Let’s Take Your Data Dreams to the Next Level

Scala

Last but not the least, Scala is a general-purpose programming language developed mainly to address some of the challenges of Java language. It is used to write Apache Spark cluster computing solution. Hence, Scala has been a popular programming language in the field of data science and big data analysis, in particular.

There was a time when Scala was mandatory to work on Spark, but with the proliferation of many API endpoints approachable with other languages, this problem has been addressed. Nevertheless, it’s still the most significant and popular language for several big data tools, including Finagle. Also Scala houses amazing concurrency support, which parallelizes a whole many processes for huge data sets.

The average annual salary for a data scientist with Scala skills is $102,980.

In the end, you can never go wrong with selecting any one of the big data programming languages. All of them are equally good, productive and easy to excel on. However, Python is probably the best one to start off with.

For more updates or information on big data courses, visit DexLab Analytics.

The original article is here at – http://www.i-programmer.info/news/197-data-mining/11622-top-3-languages-for-big-data-programming.html


Interested in a career in Data Analyst?

To learn more about Machine Learning Using Python and Spark – click here.

To learn more about Data Analyst with Advanced excel course – click here.
To learn more about Data Analyst with SAS Course – click here.
To learn more about Data Analyst with R Course – click here.
To learn more about Big Data Course – click here.

How to create Chart Templates with R Functions

R functions are used to produce chart templates to keep the look and feel of the reports intact.

 
How to create Chart Templates with R Functions
 

In this post you will come across how to create chart templates with R functions – all the R users should be accustomed to the calling functions so as to perform calculations and outline plots accurately. Remember what colors and fonts to use each time: R functions are used as a short-cut for producing customary-looking charts.

Continue reading “How to create Chart Templates with R Functions”

Open a World of Opportunities: Web Scraping Using PHP and Python

Open a World of Opportunities: Web Scraping Using PHP and Python

The latest estimates says, the total number of websites has crossed one billion mark; everyday a new site is being added and removed, but the record stays.

Having said that, just imagine how much data is floating around the web. The amount is so huge that it would be impossible for even hundreds of humans to digest all the information in a lifetime. To tackle such large amounts of data, you not only need to have easy access to all the information but should also process some scalable way to gather data in order to organize and analyze it. And that’s exactly where web data scraping comes into picture.

Web scraping, data mining, web data extraction, web harvesting or screen scraping – they all means the same thing – a technique in which a computer program fetches huge piles of data from a website and saves them in your computer, spreadsheet or database in a normal format for easy analysis.

2

Web Scraping with Python and BeautifulSoup

In case, you are not satisfied with the internet sources of web scraping, you are most likely to develop your very own data scraping tools, which is quite easier. In this blog we will show you how to frame a web scraper with Python and very simple yet dynamic BeautifulSoup Library:

First, import the libraries we will use: requests and BeautifulSoup:

# Import libraries
import requests
from bs4 import BeautifulSoup

Secondly, point out the variable for the URL using request.get method and gain access to the HTML content right from this page:

import requests
URL = "http://www.values.com/inspirational-quotes"
r = requests.get(URL)
print(r.content)

Next, we will parse a webpage, and for that, we need to create a BeautifulSoup object:

import requests 
from bs4 import BeautifulSoup
URL = "http://www.values.com/inspirational-quotes"
r = requests.get(URL)

 # Create a BeautifulSoup object
soup = BeautifulSoup(r.content, 'html5lib')
print(soup.prettify())

Now, let’s extract some meaningful information from HTML content. Look at the HTML content of the webpage, which was printed using the soup.pretify()method..

table = soup.find('div', attrs = {'id':'container'})

Here, you will find each quote inside a div container, belonging to the class quote.

We will repeat the process with each div container, belonging to the class quote. For that, we will use findAll()method and repeat the process with each quote using variable row.

After which, we will create a dictionary, in which all the data about the quote will be saved in a list, and is called ‘quotes’.

    quote['lines'] = row.h6.text

Now, coming to the final step – write down the data to a CSV file, but how?

See below:

filename = 'inspirational_quotes.csv'
with open(filename, 'wb') as f:
    w = csv.DictWriter(f,['theme','url','img','lines','author'])
    w.writeheader()
    for quote in quotes:
        w.writerow(quote)

This type of web scraping is used on a small-scale; for larger scale, you can consider:

Scraping Websites with PHP and Curl

To connect to a large number of servers and protocols, and download pictures, videos and graphics from several websites, consider Scraping Websites with PHP and cURL.

<?php

function curl_download($Url){

    if (!function_exists('curl_init')){
        die('cURL is not installed. Install and try again.');
    }

    $ch = curl_init();
    curl_setopt($ch, CURLOPT_URL, $Url);
    curl_setopt($ch, CURLOPT_RETURNTRANSFER, true);
    $output = curl_exec($ch);
    curl_close($ch);

    return $output;

print curl_download('http://www.gutenberg.org/browse/scores/top');

?>

In a nutshell, the scopes of using web scraping for analyzing content and applying it to your content marketing strategies are vast like the horizon. Armed by endless types of data analysis, web scraping technology has proved to be a valuable tool for the content producers. So, when are you feeding yourself with web scraping technology?

Discover the perfect platform for excellent R programming using Python courses. For more information on R programming training institute drop by DexLab Analytics.

 
This post originally appeared ondzone.com/articles/be-leading-content-provider-using-web-scraping-php
 

Interested in a career in Data Analyst?

To learn more about Data Analyst with Advanced excel course – Enrol Now.
To learn more about Data Analyst with R Course – Enrol Now.
To learn more about Big Data Course – Enrol Now.

To learn more about Machine Learning Using Python and Spark – Enrol Now.
To learn more about Data Analyst with SAS Course – Enrol Now.
To learn more about Data Analyst with Apache Spark Course – Enrol Now.
To learn more about Data Analyst with Market Risk Analytics and Modelling Course – Enrol Now.

Analyze Smartphone Sensor Data with R and the BreakoutDetection Package

Analyze-Smartphone-Sensor-Data-with-R-and-the-BreakoutDetection-Package

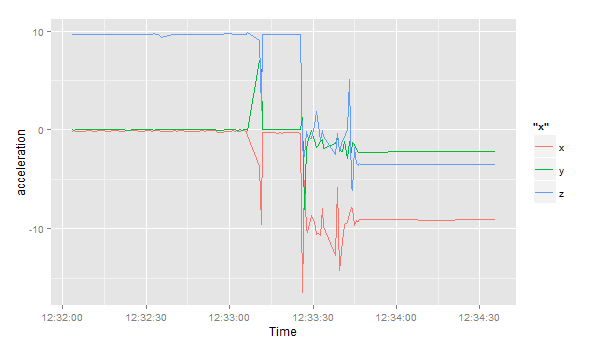
Quite interetsing. Juggling with sensor data is starkly different from economics data, document processing or social networking, but very worthwhile. In this blog, we will take a practical approach to analyze smartphone sensor data with R. We are going to use the accelerometer smartphone data that Datarella presented in its Data Fiction competition. The dataset signifies the stimulation along the three axes of the smartphone:


x – for sideways stimulation

y – for forward and backward stimulation

z – for upward and downward stimulation


The trickier part lies in its interpretation – on one hand where there are device, manufacturer and sensor specific mutations and artifacts, the other reflects all acceleration is calculated relative to the sensor orientation of the device. For example, taking out the cell phone out of your pocket and reading a tweet can be presented in the following way:


y acceleration – the phone was in the pocket top down but now has been taken out

z and y acceleration – tossing the phone so that it becomes horizontal

x acceleration – moving the smartphone from the left to the middle of your body

z acceleration – bringing  up the phone so that you can read the tweet clearly

And thirdly, the gravity influences all the movements.


Seeking R programming courses in Gurgaon? Feel free to reach us at DexLab Analytics..

Knowing exactly what to do with your smartphone can be quite intimidating – let us introduce an application of the Twitter BreakoutDetection Open Source library (see Github), which is used extensively for Behavioral Change Point analysis.

First, I have loaded the dataset and this is how it looks like:

setwd("~/Documents/Datarella")
accel <- read.csv("SensorAccelerometer.csv", stringsAsFactors=F)
head(accel)

  user_id           x          y        z                 updated_at                 type
1      88 -0.06703765 0.05746084 9.615114 2014-05-09 17:56:21.552521 Probe::Accelerometer
2      88 -0.05746084 0.10534488 9.576807 2014-05-09 17:56:22.139066 Probe::Accelerometer
3      88 -0.04788403 0.03830723 9.605537 2014-05-09 17:56:22.754616 Probe::Accelerometer
4      88 -0.01915361 0.04788403 9.567230 2014-05-09 17:56:23.372244 Probe::Accelerometer
5      88 -0.06703765 0.08619126 9.615114 2014-05-09 17:56:23.977817 Probe::Accelerometer
6      88 -0.04788403 0.07661445 9.595961  2014-05-09 17:56:24.53004 Probe::Accelerometer

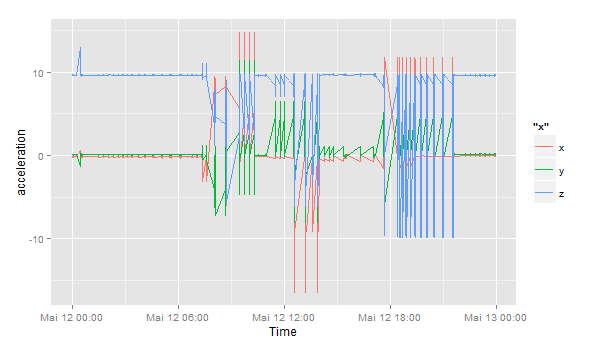
This data includes the sensor data per user per day:

accel$day <- substr(accel$updated_at, 1, 10)
df <- accel[accel$day == '2014-05-12' & accel$user_id == 88,]
df$timestamp <- as.POSIXlt(df$updated_at) # Transform to POSIX datetime
library(ggplot2)
ggplot(df) + geom_line(aes(timestamp, x, color="x")) + 
             geom_line(aes(timestamp, y, color="y")) + 
             geom_line(aes(timestamp, z, color="z")) + 
             scale_x_datetime() + xlab("Time") + ylab("acceleration")

sensor_all

Let’s focus on the period between 12:32 and 13:00:

ggplot(df[df$timestamp >= '2014-05-12 12:32:00' & df$timestamp < '2014-05-12 13:00:00',]) +
  geom_line(aes(timestamp, x, color="x")) + 
  geom_line(aes(timestamp, y, color="y")) + 
  geom_line(aes(timestamp, z, color="z")) + 
  scale_x_datetime() + xlab("Time") + ylab("acceleration")

sensor_zoom

Following all this, I load the Breakoutdetection library:

install.packages("devtools")
devtools::install_github("twitter/BreakoutDetection")
library(BreakoutDetection)
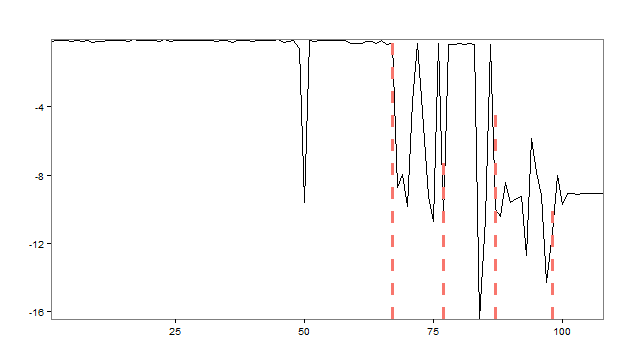
bo <- breakout(df$x[df$timestamp >= '2014-05-12 12:32:00' & df$timestamp < '2014-05-12 12:35:00'], 
               min.size=10, method='multi', beta=.001, degree=1, plot=TRUE)
bo$plotsensor_breakout

The rapid analysis of the acceleration in the x direction presents us with 4 change points, in which the stimulation suddenly starts to change. At the start, the smartphone normally lies flat on a horizontal surface – the sensor reading revolves around value of 9.8 in a positive direction – which means the gravitational force only triggers this axis and not the x or y axes. Therefore, the phone is lying flat. However, things change and after a couple of movements or changing directions, the last observation reveals the phone has been on a position where the x axis has 9.6 acceleration, meaning the phone is being positioned in a landscape orientation facing the right.

Get the best R Analytics Certification in Gurgaon from our seasoned experts at DexLab Analytics.

 
This post originally appeared onwww.r-bloggers.com/how-to-analyze-smartphone-sensor-data-with-r-and-the-breakoutdetection-package
 

Interested in a career in Data Analyst?

To learn more about Data Analyst with Advanced excel course – Enrol Now.
To learn more about Data Analyst with R Course – Enrol Now.
To learn more about Big Data Course – Enrol Now.

To learn more about Machine Learning Using Python and Spark – Enrol Now.
To learn more about Data Analyst with SAS Course – Enrol Now.
To learn more about Data Analyst with Apache Spark Course – Enrol Now.
To learn more about Data Analyst with Market Risk Analytics and Modelling Course – Enrol Now.
Using R Programming to Simulate the Incredible Pong Arcade Game

Unleashed in the market in 1972, Pong is one of the first computer games ever developed. Loosely inspired by tennis, Pong captured the worldwide gaming market soon after its launch. Instantaneously, it became a trending fad. Gaming enthusiasts became intrigued, they desired to delve deeper into the computer coding and system mechanisms mostly to understand the essence of arcade game development.

 
Using R Programming to Simulate the Incredible Pong Arcade Game
 

Today, R-Programming is extensively used to develop numerous board games. But the question to ponder on is – can we create traditional arcade games with R programming?

Continue reading “Using R Programming to Simulate the Incredible Pong Arcade Game”

Call us to know more