R language training in Delhi Archives - Page 2 of 3 - DexLab Analytics | Big Data Hadoop SAS R Analytics Predictive Modeling & Excel VBA

R Programming: The Language Marketers Use to Tame Data

R Programming: The Language Marketers Use to Tame Data

How to manage data? This is a question that’s baffles us each and every time, whenever we look at data.

The real challenge is not about managing data, but how to synchronize processes to expose the issues with data. Today’s marketers may have a tough time tackling these challenges. Even more for non-tech-savvy marketers, they may be feel a bit overwhelmed, but we’ve a solution – R programming language is capable of performing specific tasks while preparing data for machine learning models or advanced analytics.

2

Basics of R

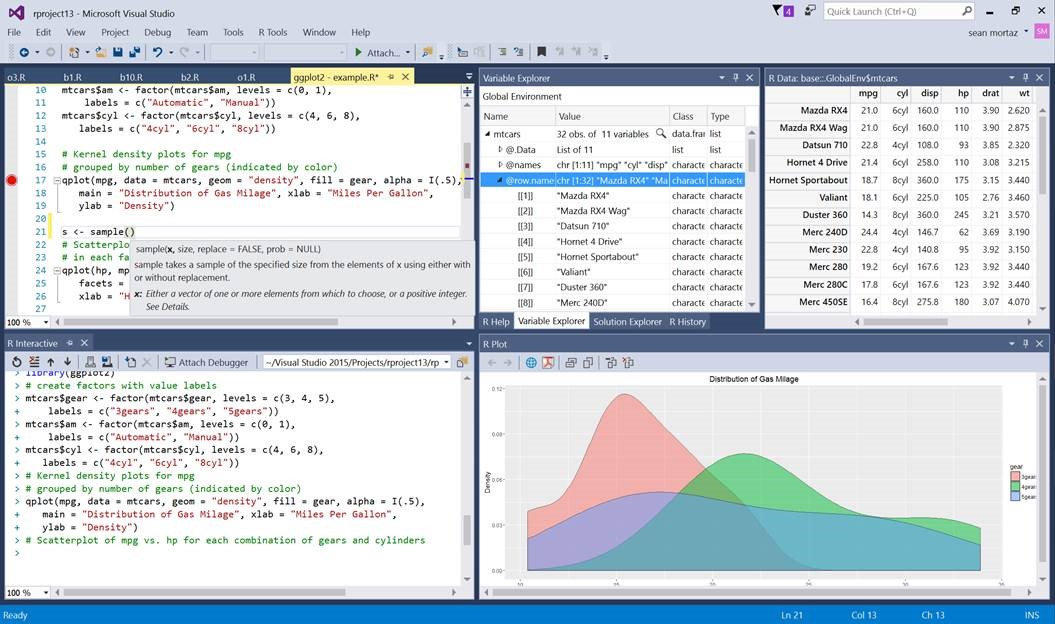
R programming is a popular open source language ideal for smart data visualization and statistical modeling. Generally, it functions through a terminal on a laptop, but you can also enjoy development environment software that makes R quite user-friendly.

One of the most sought after Integrated Development Environment (IDE) is RStudio – it’s very popular amongst practitioners mostly owing to its quad-window view, which let users view their results in the terminal beside the whiteboard platform.

Exploring Data with R

Data importing is the starting point of analyzing data. Fortunately, a more than sufficient number of R programming libraries exist today that are up to interface with a database or an API. Some of these libraries are: twitteR, RMongo and Jsonlite. A quick search across Comprehensive R Archive Network will help you find them.

Next, you have to turn your attention to data wrangling. It’s the method of mapping one row format to another, while amalgamating, dividing and rearranging rows and columns. Map out the metrics after ascertaining whether a task falls under one of the following mathematical categories:

  • Discrete Metrics
  • Continuous Metrics

Another significant step is corroborating the columns decided: are headers from the data source given? R Programming helps add headers on data as soon as data is imported. Furthermore, another question that pops up here is that are the headers from the same labels of parties who have access to data? Now, this question is instrumental in answering whether there is any more efficient way to have access to data consecutively without manually rectifying columns before placing the data in a model.

For R programming, some of the basic libraries to consider are as follows:

Readr – It helps estimate functions and read data in rectangular tabular formats

Tidyr – It helps in organizing missing field values and arranging tabular data in an effective and compatible structure

Dplyr – Ideal for transforming data after it’s added in R

Marketing Knowledge Is Still an Add-On Factor

Lastly, marketers should never ignore their domain knowledge, while modeling data. At times, your experience will help you tackle an outlier for a model in the best way possible. Or else, you might ask your technical team to adjust and manage data in cloud in a situation where other teams try to downstream assess data.

Thus, a relevant marketing knowledge is essential. It will help decide which data to be queried or how to parse it well.

If you are thinking of learning a popular yet effective programming language to tame your data, R Programming certification in Delhi NCR is the best solution for you. A good R programming training will help you understand and evaluate data like a pro.


The blog first appeared on ― www.cmswire.com/digital-marketing/how-marketers-can-plan-data-mining-with-r-programming


Interested in a career in Data Analyst?

To learn more about Data Analyst with Advanced excel course – Enrol Now.
To learn more about Data Analyst with R Course – Enrol Now.
To learn more about Big Data Course – Enrol Now.

To learn more about Machine Learning Using Python and Spark – Enrol Now.
To learn more about Data Analyst with SAS Course – Enrol Now.
To learn more about Data Analyst with Apache Spark Course – Enrol Now.
To learn more about Data Analyst with Market Risk Analytics and Modelling Course – Enrol Now.

Most Popular R Programming Interview Questions with Answers to Help You Get Started

Most Popular R Programming Interview Questions with Answers to Help You Get Started

Brainchild of Ross Ihaka and Robert Gentleman, R programming language was first developed in 1993 with an exclusive and extensive catalog of statistical and graphical techniques and processes, including machine learning, time series, linear regression, statistical inference and lot more.

In the following section, we’re about to talk about top interview questions on R programming –perfect for both freshers and experienced consultants, this interesting interview guide covers almost all the major concepts of R and its applications.

Dive Down!

2

What is R programming?

R programming is an ideal language used for data analysis, and to build incredible statistical software. It’s widely used for a wide range of machine learning applications.

How to write syntax for R commands?

When you start writing commands in R, start using # in the beginning of the line, so that the commands are written as #division.

How to project data analysis outcome through R language?

The best way to convey the results would be by combining the results of data, code and analysis on a document and present the data for further reproducible research. It would help the user recheck the result and take part in the following discussions. The reproducible research aids in performing experiments easily and solving crucial problems.

What are the data structures found in R programming?

Homogenous and Heterogeneous are two data structures found in R programming. For same kinds of objects, we suggest using homogenous data structures as for Array, Vectors and Matrix. And for different types of objects, it’s better to stick to heterogeneous data structures.

How should you import data in R language?

Importing of data in R is done with the help of R commander GUI – it’s used to type commands and is also known as Rcmdr.

Here are 3 ways to import data into R:

  • As soon as you select data set from the dialog box, enter the date set name as asked.
  • R command can also be used to enter data – Data-> New Data Set (It’s only applicable for small data sets).
  • The user can also import data directly from URL, through simple ASCII file, statistical package or from clipboards.

Highlight the advantages of R programming language.

  • The user doesn’t get entangled in license restrictions and norms for using R programming.
  • It’s an open source software and completely free of cost.
  • It has several graphical capabilities.
  • It is easily run on a majority of hardware and OS (including 32 and 64-bit processors).

Mention the limit for memory in R.

For a 32-bit system, the memory of R is limited to 3GB. And for a 64-bit system, the limit is extended to 8TB.

With this, hope you are ready to crack a tough job interview on R programming – however, for those, who want to dig deeper into the intricacies of this fascinating programming language, we have fabulous R programming courses in Gurgaon. With them discover the path towards a dream career!


The blog has been sourced from www.janbasktraining.com/blog/r-interview-questions-answers


Interested in a career in Data Analyst?

To learn more about Data Analyst with Advanced excel course – Enrol Now.
To learn more about Data Analyst with R Course – Enrol Now.
To learn more about Big Data Course – Enrol Now.

To learn more about Machine Learning Using Python and Spark – Enrol Now.
To learn more about Data Analyst with SAS Course – Enrol Now.
To learn more about Data Analyst with Apache Spark Course – Enrol Now.
To learn more about Data Analyst with Market Risk Analytics and Modelling Course – Enrol Now.

R Programming, Python or Scala: Which is the Best Big Data Programming Language?

R Programming, Python or Scala: Which is the Best Big Data Programming Language?

For data science and big data, R, Python and Scala are the 3 most important languages to master. It’s a widely-known notion, organizations of varying sizes relies on massive structured and unstructured data to predict trends, patterns and correlations. They are of expectation that such a robust analysis will lead to better business decisions and individual behavior predictions.

In 2017, the adoption of Big Data analytics has spiked up to 53% in companies – says Forbes.

The story of evolution

To start with, big data is just data, after all. The entire game-play depends on its analysis – how well the data is analyzed so as to churn out valuable business intelligence. With years, data burgeoned, and it’s still expanding. The evolution of big data mostly happened because traditional database structures couldn’t cope with such multiplying data – scaling data became an important issue.

For that, here we have some popular big data programming languages. Dive down:

R Programming

R Programming is mainly used for statistical analysis. A set of packages are available for R named Programming with Big Data in R (pbdR), which encourages big data analysis, across multiple systems via R code.

R is robust and flexible; it can be run on almost every OS. To top that, it boasts of excellent graphical capabilities, which comes handy when trying to visualize models, patterns and associations within big data structures.

According to industry standards, the average pay of R Programmers is $115,531 per year.

For R language training, drop by DexLab Analytics.

Python

Compared to R, Python is more of a general-purpose programming language. Developers adore it, because it’s easy to learn, a huge number of tutorials are available online and is perfect for data analysis, which requires integration with web applications.

Python gives excellent performance and high scalability for a series of complicated data science tasks. It is used with high-in-function big data engines, like Apache Spark through available Python APIs.

Their Machine Learning Using Python courses are of highest quality and extremely student-friendly.

Let’s Take Your Data Dreams to the Next Level

Scala

Last but not the least, Scala is a general-purpose programming language developed mainly to address some of the challenges of Java language. It is used to write Apache Spark cluster computing solution. Hence, Scala has been a popular programming language in the field of data science and big data analysis, in particular.

There was a time when Scala was mandatory to work on Spark, but with the proliferation of many API endpoints approachable with other languages, this problem has been addressed. Nevertheless, it’s still the most significant and popular language for several big data tools, including Finagle. Also Scala houses amazing concurrency support, which parallelizes a whole many processes for huge data sets.

The average annual salary for a data scientist with Scala skills is $102,980.

In the end, you can never go wrong with selecting any one of the big data programming languages. All of them are equally good, productive and easy to excel on. However, Python is probably the best one to start off with.

For more updates or information on big data courses, visit DexLab Analytics.

The original article is here at – http://www.i-programmer.info/news/197-data-mining/11622-top-3-languages-for-big-data-programming.html


Interested in a career in Data Analyst?

To learn more about Machine Learning Using Python and Spark – click here.

To learn more about Data Analyst with Advanced excel course – click here.
To learn more about Data Analyst with SAS Course – click here.
To learn more about Data Analyst with R Course – click here.
To learn more about Big Data Course – click here.

Top 5 Programming Languages to Learn in 2018

Who doesn’t want to ace the rat race!! Owing to robust technological innovations and globalization, staying on top has become an essential factor for professional success.

 
Top 5 Programming Languages to Learn in 2018
 

Amidst this, technology plays a key role. The job profiles of data scientists are fetching maximum attention. At present, they are among the most in-demand professionals around the globe bagging in handsome paychecks. Nevertheless, it’s no mean feat to become one, the process of education and training is highly intricate and demands unparalleled acumen, expertise and skill.


And with more than 600 incredible programming languages to learn, data scientists go haywire when it comes to the choosing part. While Java, Python, JavaScript, R remains the top-priority languages to impress the employers, newer, more innovative languages are also blocking the space, time and again.

Continue reading “Top 5 Programming Languages to Learn in 2018”

Open a World of Opportunities: Web Scraping Using PHP and Python

Open a World of Opportunities: Web Scraping Using PHP and Python

The latest estimates says, the total number of websites has crossed one billion mark; everyday a new site is being added and removed, but the record stays.

Having said that, just imagine how much data is floating around the web. The amount is so huge that it would be impossible for even hundreds of humans to digest all the information in a lifetime. To tackle such large amounts of data, you not only need to have easy access to all the information but should also process some scalable way to gather data in order to organize and analyze it. And that’s exactly where web data scraping comes into picture.

Web scraping, data mining, web data extraction, web harvesting or screen scraping – they all means the same thing – a technique in which a computer program fetches huge piles of data from a website and saves them in your computer, spreadsheet or database in a normal format for easy analysis.

2

Web Scraping with Python and BeautifulSoup

In case, you are not satisfied with the internet sources of web scraping, you are most likely to develop your very own data scraping tools, which is quite easier. In this blog we will show you how to frame a web scraper with Python and very simple yet dynamic BeautifulSoup Library:

First, import the libraries we will use: requests and BeautifulSoup:

# Import libraries
import requests
from bs4 import BeautifulSoup

Secondly, point out the variable for the URL using request.get method and gain access to the HTML content right from this page:

import requests
URL = "http://www.values.com/inspirational-quotes"
r = requests.get(URL)
print(r.content)

Next, we will parse a webpage, and for that, we need to create a BeautifulSoup object:

import requests 
from bs4 import BeautifulSoup
URL = "http://www.values.com/inspirational-quotes"
r = requests.get(URL)

 # Create a BeautifulSoup object
soup = BeautifulSoup(r.content, 'html5lib')
print(soup.prettify())

Now, let’s extract some meaningful information from HTML content. Look at the HTML content of the webpage, which was printed using the soup.pretify()method..

table = soup.find('div', attrs = {'id':'container'})

Here, you will find each quote inside a div container, belonging to the class quote.

We will repeat the process with each div container, belonging to the class quote. For that, we will use findAll()method and repeat the process with each quote using variable row.

After which, we will create a dictionary, in which all the data about the quote will be saved in a list, and is called ‘quotes’.

    quote['lines'] = row.h6.text

Now, coming to the final step – write down the data to a CSV file, but how?

See below:

filename = 'inspirational_quotes.csv'
with open(filename, 'wb') as f:
    w = csv.DictWriter(f,['theme','url','img','lines','author'])
    w.writeheader()
    for quote in quotes:
        w.writerow(quote)

This type of web scraping is used on a small-scale; for larger scale, you can consider:

Scraping Websites with PHP and Curl

To connect to a large number of servers and protocols, and download pictures, videos and graphics from several websites, consider Scraping Websites with PHP and cURL.

<?php

function curl_download($Url){

    if (!function_exists('curl_init')){
        die('cURL is not installed. Install and try again.');
    }

    $ch = curl_init();
    curl_setopt($ch, CURLOPT_URL, $Url);
    curl_setopt($ch, CURLOPT_RETURNTRANSFER, true);
    $output = curl_exec($ch);
    curl_close($ch);

    return $output;

print curl_download('http://www.gutenberg.org/browse/scores/top');

?>

In a nutshell, the scopes of using web scraping for analyzing content and applying it to your content marketing strategies are vast like the horizon. Armed by endless types of data analysis, web scraping technology has proved to be a valuable tool for the content producers. So, when are you feeding yourself with web scraping technology?

Discover the perfect platform for excellent R programming using Python courses. For more information on R programming training institute drop by DexLab Analytics.

 
This post originally appeared ondzone.com/articles/be-leading-content-provider-using-web-scraping-php
 

Interested in a career in Data Analyst?

To learn more about Data Analyst with Advanced excel course – Enrol Now.
To learn more about Data Analyst with R Course – Enrol Now.
To learn more about Big Data Course – Enrol Now.

To learn more about Machine Learning Using Python and Spark – Enrol Now.
To learn more about Data Analyst with SAS Course – Enrol Now.
To learn more about Data Analyst with Apache Spark Course – Enrol Now.
To learn more about Data Analyst with Market Risk Analytics and Modelling Course – Enrol Now.

Analyze Smartphone Sensor Data with R and the BreakoutDetection Package

Analyze-Smartphone-Sensor-Data-with-R-and-the-BreakoutDetection-Package

Quite interetsing. Juggling with sensor data is starkly different from economics data, document processing or social networking, but very worthwhile. In this blog, we will take a practical approach to analyze smartphone sensor data with R. We are going to use the accelerometer smartphone data that Datarella presented in its Data Fiction competition. The dataset signifies the stimulation along the three axes of the smartphone:


x – for sideways stimulation

y – for forward and backward stimulation

z – for upward and downward stimulation


The trickier part lies in its interpretation – on one hand where there are device, manufacturer and sensor specific mutations and artifacts, the other reflects all acceleration is calculated relative to the sensor orientation of the device. For example, taking out the cell phone out of your pocket and reading a tweet can be presented in the following way:


y acceleration – the phone was in the pocket top down but now has been taken out

z and y acceleration – tossing the phone so that it becomes horizontal

x acceleration – moving the smartphone from the left to the middle of your body

z acceleration – bringing  up the phone so that you can read the tweet clearly

And thirdly, the gravity influences all the movements.


Seeking R programming courses in Gurgaon? Feel free to reach us at DexLab Analytics..

Knowing exactly what to do with your smartphone can be quite intimidating – let us introduce an application of the Twitter BreakoutDetection Open Source library (see Github), which is used extensively for Behavioral Change Point analysis.

First, I have loaded the dataset and this is how it looks like:

setwd("~/Documents/Datarella")
accel <- read.csv("SensorAccelerometer.csv", stringsAsFactors=F)
head(accel)

  user_id           x          y        z                 updated_at                 type
1      88 -0.06703765 0.05746084 9.615114 2014-05-09 17:56:21.552521 Probe::Accelerometer
2      88 -0.05746084 0.10534488 9.576807 2014-05-09 17:56:22.139066 Probe::Accelerometer
3      88 -0.04788403 0.03830723 9.605537 2014-05-09 17:56:22.754616 Probe::Accelerometer
4      88 -0.01915361 0.04788403 9.567230 2014-05-09 17:56:23.372244 Probe::Accelerometer
5      88 -0.06703765 0.08619126 9.615114 2014-05-09 17:56:23.977817 Probe::Accelerometer
6      88 -0.04788403 0.07661445 9.595961  2014-05-09 17:56:24.53004 Probe::Accelerometer

This data includes the sensor data per user per day:

accel$day <- substr(accel$updated_at, 1, 10)
df <- accel[accel$day == '2014-05-12' & accel$user_id == 88,]
df$timestamp <- as.POSIXlt(df$updated_at) # Transform to POSIX datetime
library(ggplot2)
ggplot(df) + geom_line(aes(timestamp, x, color="x")) + 
             geom_line(aes(timestamp, y, color="y")) + 
             geom_line(aes(timestamp, z, color="z")) + 
             scale_x_datetime() + xlab("Time") + ylab("acceleration")

sensor_all

Let’s focus on the period between 12:32 and 13:00:

ggplot(df[df$timestamp >= '2014-05-12 12:32:00' & df$timestamp < '2014-05-12 13:00:00',]) +
  geom_line(aes(timestamp, x, color="x")) + 
  geom_line(aes(timestamp, y, color="y")) + 
  geom_line(aes(timestamp, z, color="z")) + 
  scale_x_datetime() + xlab("Time") + ylab("acceleration")

sensor_zoom

Following all this, I load the Breakoutdetection library:

install.packages("devtools")
devtools::install_github("twitter/BreakoutDetection")
library(BreakoutDetection)
bo <- breakout(df$x[df$timestamp >= '2014-05-12 12:32:00' & df$timestamp < '2014-05-12 12:35:00'], 
               min.size=10, method='multi', beta=.001, degree=1, plot=TRUE)
bo$plotsensor_breakout

The rapid analysis of the acceleration in the x direction presents us with 4 change points, in which the stimulation suddenly starts to change. At the start, the smartphone normally lies flat on a horizontal surface – the sensor reading revolves around value of 9.8 in a positive direction – which means the gravitational force only triggers this axis and not the x or y axes. Therefore, the phone is lying flat. However, things change and after a couple of movements or changing directions, the last observation reveals the phone has been on a position where the x axis has 9.6 acceleration, meaning the phone is being positioned in a landscape orientation facing the right.

Get the best R Analytics Certification in Gurgaon from our seasoned experts at DexLab Analytics.

 
This post originally appeared onwww.r-bloggers.com/how-to-analyze-smartphone-sensor-data-with-r-and-the-breakoutdetection-package
 

Interested in a career in Data Analyst?

To learn more about Data Analyst with Advanced excel course – Enrol Now.
To learn more about Data Analyst with R Course – Enrol Now.
To learn more about Big Data Course – Enrol Now.

To learn more about Machine Learning Using Python and Spark – Enrol Now.
To learn more about Data Analyst with SAS Course – Enrol Now.
To learn more about Data Analyst with Apache Spark Course – Enrol Now.
To learn more about Data Analyst with Market Risk Analytics and Modelling Course – Enrol Now.

How to Create Repeat Loop in R Programming

In this tutorial, we will learn to make a repeat loop with the use of R programming.

How to Create Repeat Loop in R Programming

A repeat loop is used to iterate over a block of code over several number of times.

In case of a repeat loop, there is no condition to check in for exiting repeat loop.

Hence, we must ourselves put a condition explicitly within a repeat loop body and make use of the break statement to exit the loop. Failing to do so will result into an infinite loop.

 Syntax of repeat loop

repeat {
   statement
}

When in the statement block, we must use the statement ‘break’ to exit the loop.

 r-repeat-loop-flowchart-120

Example: repeat loop

x <- 1

repeat {
   print(x)
   x = x+1
   if (x == 6){
       break
   }
}

 Output

[1] 1
[1] 2
[1] 3
[1] 4
[1] 5

Note that in the example above, we have only made use of a condition to check and exit the loop when x equals the value of 6.

That is why we see in our output that only values from 1 to 5 get printed.

Why not pull the strings of your career by enrolling for an intensive R programming certification course in Delhi!  DexLab Analytics, being a premier R programming training institute can help you on your endeavour.


This post originally appeared onwww.datamentor.io/r-programming/repeat-loop

Interested in a career in Data Analyst?

To learn more about Machine Learning Using Python and Spark – click here.
To learn more about Data Analyst with Advanced excel course – click here.
To learn more about Data Analyst with SAS Course – click here.
To learn more about Data Analyst with R Course – click here.
To learn more about Big Data Course – click here.

Introducing The New R Tools For Visual Studio

Introducing The New R Tools For Visual Studio

It is a great new development that the new Visual Studio now speaks the R Language!

Here is how:

RTVS-1


Decidedly now R is the most popular statistical data analysis language which is in use these days. The R tools for Visual Studio brings together the power of R and Visual Studio in the same pod, for a convenient, and easy to use plug-in that is not only free and open source, but is very user friendly. When it is combined with the powers of Visual Studio Community Edition, then you will receive a multilingual IDE, which is perpetually free for all small teams.


In order to showcase and inspire testing and evaluation from the developer community, the R tools package for Visual Studios has been launched as a public preview version.


R Programming courses in Gurgaon with placement assistance is provided by DexLab Analytics.


Here are the new exciting features being introduced in this preview release version:


  • Editor – this is a complete package for fine editing experience finished with R scripts and functions, which also include detachable/ tabbed windows, syntax highlighting and a lot more.
  • IntelliSense – this is also known as auto-completion and is available in both the editor as well as the Interactive R window
  • R Interactive Window – with this you can work directly with R console from within the Visual Studio
  • History window – one can search, view, and select previous commands and then send it to the Interactive Window.
  • A variable explorer – now get the advantage to drill deep into your R data structures and examine their values
  • Plotting – now check all your R plots within a Visual Studio tool window
  • Debugging – stepping, breakpoints, watch windows, call stacks and much more
  • R markdown ­– get to use R Markdown/knitr support with export to Word and HTML
  • Git – get control over source code through Git and GitHub
  • Extensions – more than 6000 extensions covering a wide spectrum from Data to Productivity to Language
  • Help – view R documentation with the use of ? and ?? in Visual Studio itself
  • A polyglot IDE – VS supports, R, Python, C and C++, C#, Node.js, SQL, etc projects can be managed simultaneously.


Some other features that were requested by the R developer community are the Package Manager GUI, Visual Studio Code (cross-plat), and more, which will be a part of one of our future updates.

Now use Azure ML SDK:

Now you can use the R SDK with the RTVS to access all your datasets and also workspaces on the Azure ML. You can use the environment to build and test the models locally and easily operationalize them at scale on Azure.

RTVS3-final

This SDK is not tied to RTVS, but it can be used from any environment to publish models to Azure ML.

Conclusion:

This new element to the analytics offerings viz. a powerful R authoring environment post their previous announcements of Microsoft R Open and Microsoft R server announcements that took place last year is an exciting development.

Let’s Take Your Data Dreams to the Next Level

For more exciting news on RTVS stay tuned to our regular blogs, because the time has never been better to be a data analyst.

Get R language certification in Delhi from industrial experts with years’ worth of experience at DexLab Analytics.


Interested in a career in Data Analyst?

To learn more about Machine Learning Using Python and Spark – click here.
To learn more about Data Analyst with Advanced excel course – click here.
To learn more about Data Analyst with SAS Course – click here.
To learn more about Data Analyst with R Course – click here.
To learn more about Big Data Course – click here.

How is data science helping NFL players win Super bowl?!

Recently, a discussion was held, which invited data scientists and analysts all over the world, to take part in the Science of Super Bowl discussion panel, this discussion was held by Newswise.

Data Science in Super bowl

We found one notable discussion topic, which answered three very important questions related to data science that the sports industry could use:

Continue reading “How is data science helping NFL players win Super bowl?!”

Call us to know more