r language certification in Delhi Archives - Page 2 of 2 - DexLab Analytics | Big Data Hadoop SAS R Analytics Predictive Modeling & Excel VBA

Top 5 Programming Languages to Learn in 2018

Who doesn’t want to ace the rat race!! Owing to robust technological innovations and globalization, staying on top has become an essential factor for professional success.

 
Top 5 Programming Languages to Learn in 2018
 

Amidst this, technology plays a key role. The job profiles of data scientists are fetching maximum attention. At present, they are among the most in-demand professionals around the globe bagging in handsome paychecks. Nevertheless, it’s no mean feat to become one, the process of education and training is highly intricate and demands unparalleled acumen, expertise and skill.


And with more than 600 incredible programming languages to learn, data scientists go haywire when it comes to the choosing part. While Java, Python, JavaScript, R remains the top-priority languages to impress the employers, newer, more innovative languages are also blocking the space, time and again.

Continue reading “Top 5 Programming Languages to Learn in 2018”

Open a World of Opportunities: Web Scraping Using PHP and Python

Open a World of Opportunities: Web Scraping Using PHP and Python

The latest estimates says, the total number of websites has crossed one billion mark; everyday a new site is being added and removed, but the record stays.

Having said that, just imagine how much data is floating around the web. The amount is so huge that it would be impossible for even hundreds of humans to digest all the information in a lifetime. To tackle such large amounts of data, you not only need to have easy access to all the information but should also process some scalable way to gather data in order to organize and analyze it. And that’s exactly where web data scraping comes into picture.

Web scraping, data mining, web data extraction, web harvesting or screen scraping – they all means the same thing – a technique in which a computer program fetches huge piles of data from a website and saves them in your computer, spreadsheet or database in a normal format for easy analysis.

2

Web Scraping with Python and BeautifulSoup

In case, you are not satisfied with the internet sources of web scraping, you are most likely to develop your very own data scraping tools, which is quite easier. In this blog we will show you how to frame a web scraper with Python and very simple yet dynamic BeautifulSoup Library:

First, import the libraries we will use: requests and BeautifulSoup:

# Import libraries
import requests
from bs4 import BeautifulSoup

Secondly, point out the variable for the URL using request.get method and gain access to the HTML content right from this page:

import requests
URL = "http://www.values.com/inspirational-quotes"
r = requests.get(URL)
print(r.content)

Next, we will parse a webpage, and for that, we need to create a BeautifulSoup object:

import requests 
from bs4 import BeautifulSoup
URL = "http://www.values.com/inspirational-quotes"
r = requests.get(URL)

 # Create a BeautifulSoup object
soup = BeautifulSoup(r.content, 'html5lib')
print(soup.prettify())

Now, let’s extract some meaningful information from HTML content. Look at the HTML content of the webpage, which was printed using the soup.pretify()method..

table = soup.find('div', attrs = {'id':'container'})

Here, you will find each quote inside a div container, belonging to the class quote.

We will repeat the process with each div container, belonging to the class quote. For that, we will use findAll()method and repeat the process with each quote using variable row.

After which, we will create a dictionary, in which all the data about the quote will be saved in a list, and is called ‘quotes’.

    quote['lines'] = row.h6.text

Now, coming to the final step – write down the data to a CSV file, but how?

See below:

filename = 'inspirational_quotes.csv'
with open(filename, 'wb') as f:
    w = csv.DictWriter(f,['theme','url','img','lines','author'])
    w.writeheader()
    for quote in quotes:
        w.writerow(quote)

This type of web scraping is used on a small-scale; for larger scale, you can consider:

Scraping Websites with PHP and Curl

To connect to a large number of servers and protocols, and download pictures, videos and graphics from several websites, consider Scraping Websites with PHP and cURL.

<?php

function curl_download($Url){

    if (!function_exists('curl_init')){
        die('cURL is not installed. Install and try again.');
    }

    $ch = curl_init();
    curl_setopt($ch, CURLOPT_URL, $Url);
    curl_setopt($ch, CURLOPT_RETURNTRANSFER, true);
    $output = curl_exec($ch);
    curl_close($ch);

    return $output;

print curl_download('http://www.gutenberg.org/browse/scores/top');

?>

In a nutshell, the scopes of using web scraping for analyzing content and applying it to your content marketing strategies are vast like the horizon. Armed by endless types of data analysis, web scraping technology has proved to be a valuable tool for the content producers. So, when are you feeding yourself with web scraping technology?

Discover the perfect platform for excellent R programming using Python courses. For more information on R programming training institute drop by DexLab Analytics.

 
This post originally appeared ondzone.com/articles/be-leading-content-provider-using-web-scraping-php
 

Interested in a career in Data Analyst?

To learn more about Data Analyst with Advanced excel course – Enrol Now.
To learn more about Data Analyst with R Course – Enrol Now.
To learn more about Big Data Course – Enrol Now.

To learn more about Machine Learning Using Python and Spark – Enrol Now.
To learn more about Data Analyst with SAS Course – Enrol Now.
To learn more about Data Analyst with Apache Spark Course – Enrol Now.
To learn more about Data Analyst with Market Risk Analytics and Modelling Course – Enrol Now.
Analyze Smartphone Sensor Data with R and the BreakoutDetection Package

Analyze-Smartphone-Sensor-Data-with-R-and-the-BreakoutDetection-Package

Quite interetsing. Juggling with sensor data is starkly different from economics data, document processing or social networking, but very worthwhile. In this blog, we will take a practical approach to analyze smartphone sensor data with R. We are going to use the accelerometer smartphone data that Datarella presented in its Data Fiction competition. The dataset signifies the stimulation along the three axes of the smartphone:


x – for sideways stimulation

y – for forward and backward stimulation

z – for upward and downward stimulation


The trickier part lies in its interpretation – on one hand where there are device, manufacturer and sensor specific mutations and artifacts, the other reflects all acceleration is calculated relative to the sensor orientation of the device. For example, taking out the cell phone out of your pocket and reading a tweet can be presented in the following way:


y acceleration – the phone was in the pocket top down but now has been taken out

z and y acceleration – tossing the phone so that it becomes horizontal

x acceleration – moving the smartphone from the left to the middle of your body

z acceleration – bringing  up the phone so that you can read the tweet clearly

And thirdly, the gravity influences all the movements.


Seeking R programming courses in Gurgaon? Feel free to reach us at DexLab Analytics..

Knowing exactly what to do with your smartphone can be quite intimidating – let us introduce an application of the Twitter BreakoutDetection Open Source library (see Github), which is used extensively for Behavioral Change Point analysis.

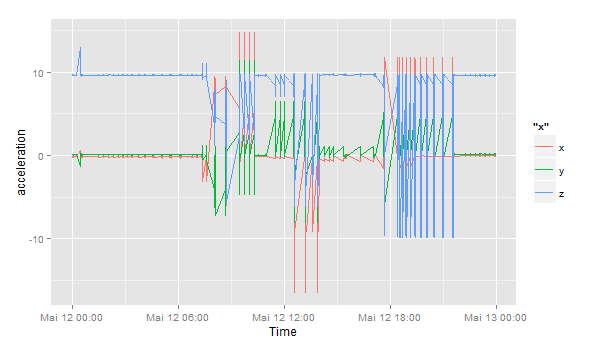
First, I have loaded the dataset and this is how it looks like:

setwd("~/Documents/Datarella")
accel <- read.csv("SensorAccelerometer.csv", stringsAsFactors=F)
head(accel)

  user_id           x          y        z                 updated_at                 type
1      88 -0.06703765 0.05746084 9.615114 2014-05-09 17:56:21.552521 Probe::Accelerometer
2      88 -0.05746084 0.10534488 9.576807 2014-05-09 17:56:22.139066 Probe::Accelerometer
3      88 -0.04788403 0.03830723 9.605537 2014-05-09 17:56:22.754616 Probe::Accelerometer
4      88 -0.01915361 0.04788403 9.567230 2014-05-09 17:56:23.372244 Probe::Accelerometer
5      88 -0.06703765 0.08619126 9.615114 2014-05-09 17:56:23.977817 Probe::Accelerometer
6      88 -0.04788403 0.07661445 9.595961  2014-05-09 17:56:24.53004 Probe::Accelerometer

This data includes the sensor data per user per day:

accel$day <- substr(accel$updated_at, 1, 10)
df <- accel[accel$day == '2014-05-12' & accel$user_id == 88,]
df$timestamp <- as.POSIXlt(df$updated_at) # Transform to POSIX datetime
library(ggplot2)
ggplot(df) + geom_line(aes(timestamp, x, color="x")) + 
             geom_line(aes(timestamp, y, color="y")) + 
             geom_line(aes(timestamp, z, color="z")) + 
             scale_x_datetime() + xlab("Time") + ylab("acceleration")

sensor_all

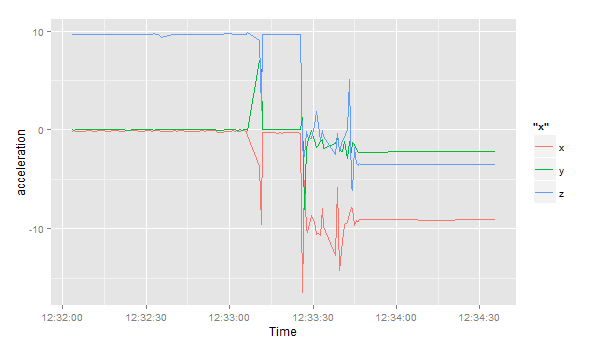
Let’s focus on the period between 12:32 and 13:00:

ggplot(df[df$timestamp >= '2014-05-12 12:32:00' & df$timestamp < '2014-05-12 13:00:00',]) +
  geom_line(aes(timestamp, x, color="x")) + 
  geom_line(aes(timestamp, y, color="y")) + 
  geom_line(aes(timestamp, z, color="z")) + 
  scale_x_datetime() + xlab("Time") + ylab("acceleration")

sensor_zoom

Following all this, I load the Breakoutdetection library:

install.packages("devtools")
devtools::install_github("twitter/BreakoutDetection")
library(BreakoutDetection)
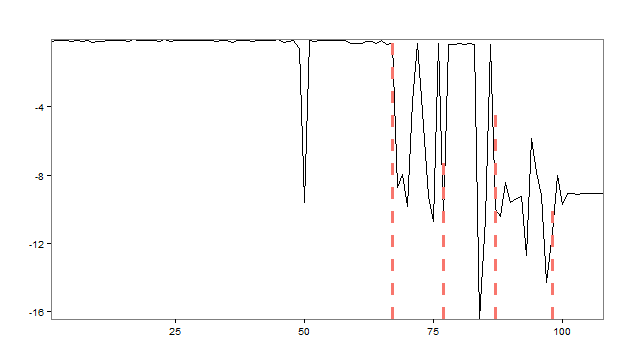
bo <- breakout(df$x[df$timestamp >= '2014-05-12 12:32:00' & df$timestamp < '2014-05-12 12:35:00'], 
               min.size=10, method='multi', beta=.001, degree=1, plot=TRUE)
bo$plotsensor_breakout

The rapid analysis of the acceleration in the x direction presents us with 4 change points, in which the stimulation suddenly starts to change. At the start, the smartphone normally lies flat on a horizontal surface – the sensor reading revolves around value of 9.8 in a positive direction – which means the gravitational force only triggers this axis and not the x or y axes. Therefore, the phone is lying flat. However, things change and after a couple of movements or changing directions, the last observation reveals the phone has been on a position where the x axis has 9.6 acceleration, meaning the phone is being positioned in a landscape orientation facing the right.

Get the best R Analytics Certification in Gurgaon from our seasoned experts at DexLab Analytics.

 
This post originally appeared onwww.r-bloggers.com/how-to-analyze-smartphone-sensor-data-with-r-and-the-breakoutdetection-package
 

Interested in a career in Data Analyst?

To learn more about Data Analyst with Advanced excel course – Enrol Now.
To learn more about Data Analyst with R Course – Enrol Now.
To learn more about Big Data Course – Enrol Now.

To learn more about Machine Learning Using Python and Spark – Enrol Now.
To learn more about Data Analyst with SAS Course – Enrol Now.
To learn more about Data Analyst with Apache Spark Course – Enrol Now.
To learn more about Data Analyst with Market Risk Analytics and Modelling Course – Enrol Now.

How to Create Repeat Loop in R Programming

In this tutorial, we will learn to make a repeat loop with the use of R programming.

How to Create Repeat Loop in R Programming

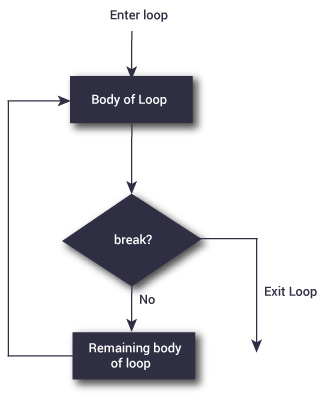
A repeat loop is used to iterate over a block of code over several number of times.

In case of a repeat loop, there is no condition to check in for exiting repeat loop.

Hence, we must ourselves put a condition explicitly within a repeat loop body and make use of the break statement to exit the loop. Failing to do so will result into an infinite loop.

 Syntax of repeat loop

repeat {
   statement
}

When in the statement block, we must use the statement ‘break’ to exit the loop.

 r-repeat-loop-flowchart-120

Example: repeat loop

x <- 1

repeat {
   print(x)
   x = x+1
   if (x == 6){
       break
   }
}

 Output

[1] 1
[1] 2
[1] 3
[1] 4
[1] 5

Note that in the example above, we have only made use of a condition to check and exit the loop when x equals the value of 6.

That is why we see in our output that only values from 1 to 5 get printed.

Why not pull the strings of your career by enrolling for an intensive R programming certification course in Delhi!  DexLab Analytics, being a premier R programming training institute can help you on your endeavour.


This post originally appeared onwww.datamentor.io/r-programming/repeat-loop

Interested in a career in Data Analyst?

To learn more about Machine Learning Using Python and Spark – click here.
To learn more about Data Analyst with Advanced excel course – click here.
To learn more about Data Analyst with SAS Course – click here.
To learn more about Data Analyst with R Course – click here.
To learn more about Big Data Course – click here.

The Choice Between SAS Vs. R Vs. Python: Which to Learn First?

It is a well-known fact that Python, R and SAS are the most important three languages to be learnt for data analysis.


The Choice Between SAS Vs. R Vs. Python: Which to Learn First?


If you are a fresh blood in the data science community and are not experienced in any of the above-mentioned languages, then it makes a lot of sense to be acquainted with R, SAS or Python.

Continue reading “The Choice Between SAS Vs. R Vs. Python: Which to Learn First?”

New R Packages- 5 Reasons for Data Scientists to Rejoice

5-Reasons-for-Data-Scientists-to-Rejoice

One of the fundamental advantages of the ecosystem related to R and the primary reason that lie behind the phenomenal growth of R is the practice and facility to contribute new packages to R. When this is added to the highly stable CRAN which happens to be the primary repository of packages of R,gives it a great advantage. The effectiveness of CRAN is further enhanced by the ability of people with sufficient technical expertise and to contribute packages through a proper system of submission.

It is only with sufficient effort and time that one realizes the system of packages submitted through proper procedures can yield integrated software of high quality.Even those who are relatively new to R Programming the process of discovering the packages that serves as the bedrock of R language growth. Such packages add value to the language in a reliable way.

2

The following 5 new packages listed in the paragraphs that follow may trigger the curiosity of data scientists.

  •  AzureML V0.1.1

Cloud computing is and will continue to be of great interest to all data scientists. The AzureML provides Python and R Programmers a rich environment for machine learning. If you are yet to be initiated to Azure as a user this package will go long ways in helping you get started. It provides functions that let you push R code from your local system to the Azure cloud in addition to publishing models and functions as web services.

  •  Distcomp V0.25.1

Using distributed computing when dealing with large sets of data is invariable an irksome problem. This is truer in cases where sharing data amongst collaborators is difficult or simply not possible. The distcomp package implements a crafty partial likelihood algorithm which lets users build statistical models of complexity and sophistication on data sets that are not aggregated.

  • RotationForest V0.1

If there is any primary ensemble method that performs well on diverse sets of data on a constant basis is the forests algorithm. This particular variety performs principal analysis of components on subsets taken at random in the feature space and holds great promise.

  • Rpca V0.2.3

In case there is a matrix that forms a superposition of a component that is lowly ranked along with a sparse component, rcpa calls in a robust PCA method that recovers all of these components. The algorithm was publicized by the data scientists at Netflix.

  •  SwarmSVM V0.1

One of the primary machine learning algorithm happens to be the support vector machine. SwarmSVM has for its basis an approach that may be said to be as a clustering approach and makes provisions for 3 different ensemble methods that train support vector machines. A practical introduction to this particular method is also attached with the vignette that comes with the package.

For more such interesting technical blogs and insights, follow us at DexLab Analytics. We are a pioneering R programming training institute. Our industry experts impart the best possible R programming courses, so when are you contacting us!!


Interested in a career in Data Analyst?

To learn more about Data Analyst with Advanced excel course – Enrol Now.
To learn more about Data Analyst with R Course – Enrol Now.
To learn more about Big Data Course – Enrol Now.

To learn more about Machine Learning Using Python and Spark – Enrol Now.
To learn more about Data Analyst with SAS Course – Enrol Now.
To learn more about Data Analyst with Apache Spark Course – Enrol Now.
To learn more about Data Analyst with Market Risk Analytics and Modelling Course – Enrol Now.

Call us to know more