r language certification in Delhi Archives - DexLab Analytics | Big Data Hadoop SAS R Analytics Predictive Modeling & Excel VBA

Stay Home and Upskill to Beat the Impact of a Global Recession

Stay Home and Upskill to Beat the Impact of a Global Recession

The US economy, as it was officially announced by the United States National Bureau of Economic Research on June 8, entered a recession in February after hitting a peak of economic activity and growth. This is the first time the US economy has undergone a recession since the global financial crisis of 2008-09, says a report.

In the US alone, 19.6 lakh cases of covid-19 positive patients have been reported till date with 1.1 lakh cases of deaths recorded, the highest for any country in the world. In such a dire situation, the silver lining seems to be the fact that this recession, intensified by the lockdown that the country has imposed on itself to abate the spread of the disease, might be deep but short lived, The New York Times reported.

Irrespective of when the recession will end, poverty levels have already begun spiking the world over. The World Bank has said that, “the highest share of countries in 150 years would enter recessions at the same time. As many as 90% of the 183 economies () examined are expected to suffer from falling levels of gross domestic product (GDP) in 2020, even more than the 85% of nations suffering from recession during the Great Depression of the 1930s”, The Guardian reported.

This will lead to dramatic rise in levels of poverty the world over. However, India might fare better on the global front for more reasons than one. Some economists feel “the (Indian) economy may do better than some other developing economies, which are heavily dependent on world trade” because of “lower dependence on exports (that) means less exposure to the decline in world trade. This and the low price of crude oil, our biggest import, may mean that we don’t suffer an external shock”.

In such circumstances, it is advisable that you stay home and not despair. Doing nothing but fretting will only add to your woes and not help the situation. Neither will binge-watching web series help. Instead, what you can do is ready yourself for a post COVID-19 world. You can do this by primarily upskilling yourself i.e.upgrading your skill set.

The only way to do this is remotely, though online classes available by the dozen. In fact, celebrities like Shakira have begun taking online classes (she in ancient philosophy) this lockdown while others like director Kevin Smith have finished old pending projects. The best skills to upgrade would, however, be those pertaining to computer science courses like big data, machine learning, deep learning or even credit risk modelling. These high-in-demand courses will look good on your résumé and instantly add to your employability wherever you plan to move to next.

Data Science Machine Learning Certification

In India, DexLab Analytics, a premier institute offering some of the best credit risk modelling training courses and R programming courses in Gurgaon, suggests you try and learn a new programming language or enrol in a new business analytics course so your résumé stands stronger than it was before the lockdown. This will help you beat competition when you will be searching for work opportunities post the lockdown.


.

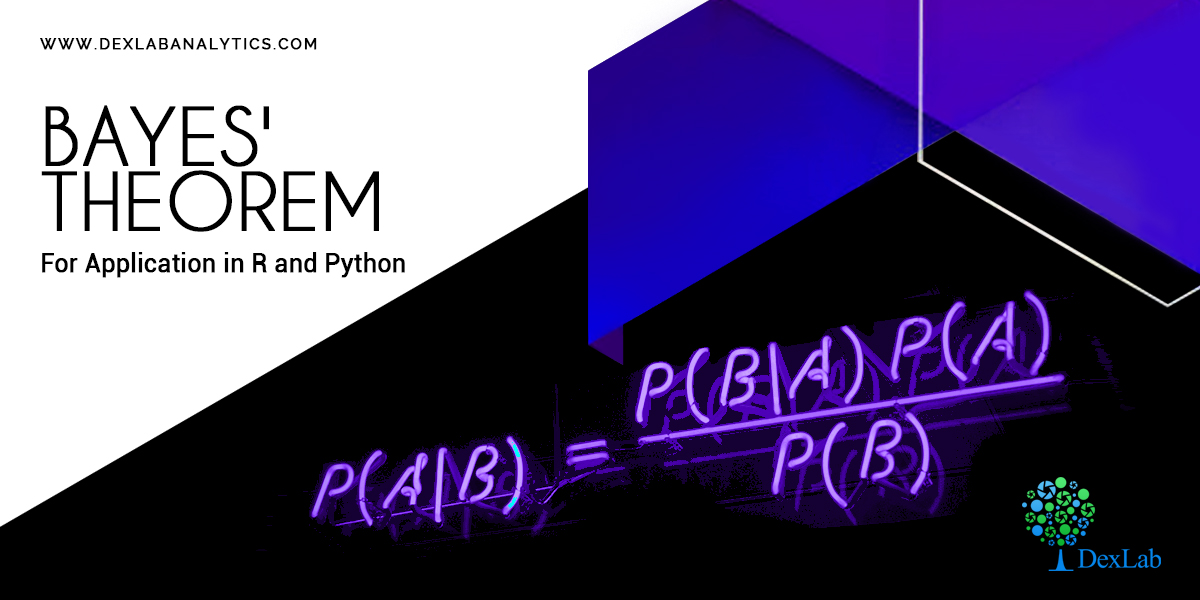
Bayes’ Theorem – Application in R and Python

Bayes’ Theorem – Application in R and Python

Bayes’ theorem, named after 18th century (1763) British mathematician Thomas Bayes, is a mathematical formula for determining conditional probability.  In the discussion of conditional probability we indicated that revising probability when new information is obtained is an important phase of probability analysis. Often, we begin our analysis with initial or prior probability estimates for specific events of interest. Then, from sources such as a sample, a special report, a product test, etc we obtain some additional information about the events. Given this new information, we update the prior probability values by calculating revised probabilities, referred to as posterior probabilities.

The steps involved in this probability revision process are depicted in the digram below:

  • Theorem:

An event A can occur only if one of the mutually exclusive and exhaustive set of events B1, B2,… ,Bn occurs. Suppose that the unconditional probabilities

And the conditional probabilities

are known. Then the conditional probability of a specified event Bi, when A is stated to have actually occurred, is given by

This is known as Bayes’ Theorem.

  • Proof:

An event A can happen in mutually exclusive ways, B1 A, B2A,… Bn A, i.e. either when has occurred, or. So by the theorem of total probability


Again,

Since the events ABi and BiA are equivalent, their probabilities are also equal.

Hence

So that

Substituting for P(A) from above, the theorem is proved.

Equation (1) is also known as “Bayes” formula for calculating probabilities of hypothesis. Because B1, B2,…Bn may be considered as hypothesis which account for the occurrence of A. The probabilities P(B1),P(B2 ),…P(Bn) are called ‘a prior’ probabilities of the hypothesis.

While are known as a‘a posteriori’ probabilities of the same hypothesis.

Data Science Machine Learning Certification

For more on this, do peruse the Dexlab Analytics website today. Dexlab Analytics is a premiere institute for R programming courses in Gurgaon.


.

Machine Learning Jobs in 2019: Freezing your own Job

Machine Learning Jobs in 2019: Freezing your own Job

Machine Learning surely needs no introduction. Joining forces with Data Science and Big Data, Machine Learning is one of the principal technologies, which is carving the future for us. From self-propelled cars to voice assistants, to surgical robots, Artificial Intelligence is already amongst us.

Besides, with this cutting-edge technology, marketing is also witnessing a fresh bloom, irrespective of the field you are working on. Thus, it is obvious that the career opportunities have quickly and radically shifted in the way of the candidates who are well-versed with Machine Learning platforms and languages. If you are also looking forward to shooting your career up, the premium Machine Learning course in India is the place you should reach now!

2

Learning Machine Learning is No More a Pain Now!

Whether you are a professional or a fresher planning your way to be successful as a Machine Learning professional, you must ensure that you are updated. Besides, you should also be careful that you have certain skills in your grip that you can work on!

However, if you are not aware of them still, here are the skills that you need to focus on to rest assured:

Programming Languages

As you speak English and/or your regional languages accepted to your society in order to communicate comprehensibly, you also need to be well-versed with the languages specific to Machine Learning.

In a nutshell, R programming certification and Machine Learning Using Python are undoubtedly the most significant ones when it comes to Machine Learning.

Data Modeling

If you believe that you can already boast of considerable knowledge of R & Python, then you shall extend your knowledge a bit more towards the advanced methods of analysis. Brief know how of the coding structures, Data Modeling and Data Visualization will help you steer your career forwards.

Deep Learning and AI using Python

Statistics and Probability

If you are seeking to make a career out of Machine Learning, it is important to note that you should have a good grip of statistics and probability. Now, with the thorough courses of Python for Data Analysis along with extensive knowledge of statistics and probability from Dexlab Analytics, it will be easier than ever.

Besides all these, you also need to grasp significant insights into the improved algorithms and clustering methods. 


Interested in a career in Data Analyst?

To learn more about Data Analyst with Advanced excel course – Enrol Now.
To learn more about Data Analyst with R Course – Enrol Now.
To learn more about Big Data Course – Enrol Now.

To learn more about Machine Learning Using Python and Spark – Enrol Now.
To learn more about Data Analyst with SAS Course – Enrol Now.
To learn more about Data Analyst with Apache Spark Course – Enrol Now.
To learn more about Data Analyst with Market Risk Analytics and Modelling Course – Enrol Now.

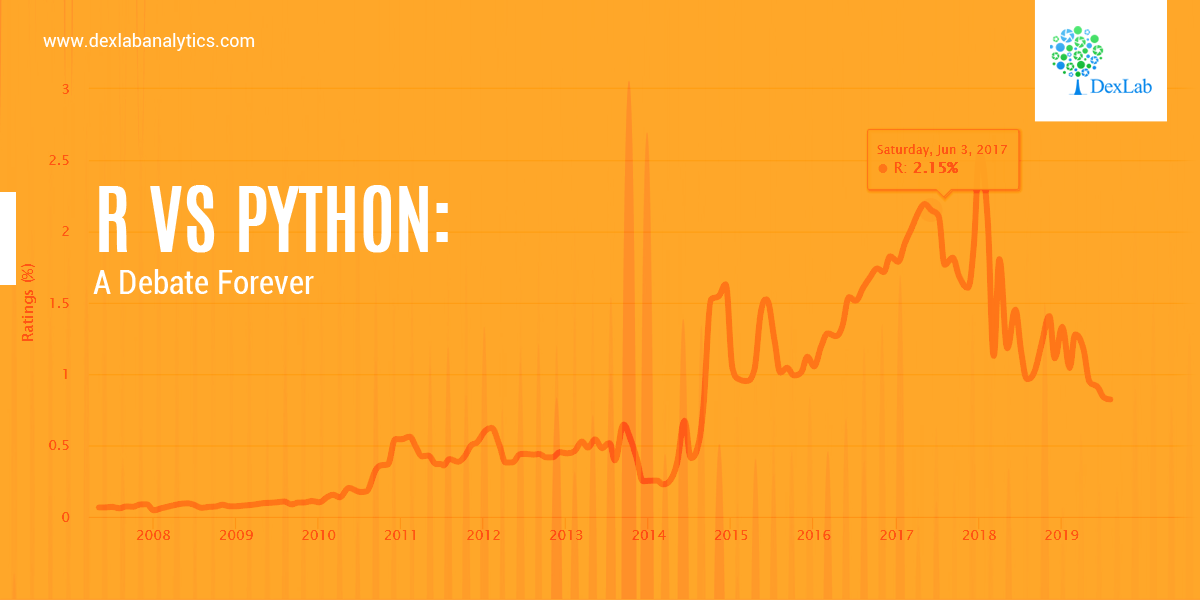
R Vs Python: A Debate Forever

R Vs Python: A Debate Forever

In this blog, we will bring forth the age old question and check which one is better, R programming and Python programming, when it comes to data science?

To be very honest, this question does not have a strict answer to it. However, in this blog we will lay down the key components of both the languages to give you a clearer picture. In the end, please decide for yourself and leave your comments in the section below.

The aim of this blog is to objectively put forward the pros and cons of both languages strictly from the perspective of data science.

We will discuss only about three main components, which are as follows:

  • Syntax
  • Performance
  • Applicability

There are other metrics, such as, trends in Industries and adaptation in the recent years which are beyond the scope of this blog. However, you can safely declare Python as the clear winner if those perspectives were concerned.

So let’s get started:

Syntax

Both R and Python are object-oriented languages. This is to say that everything is created as an object in which the information is mapped with the idea of using that object later in the analysis. However, when it comes to the syntax, i.e., the grammar of programming, R and Python are indeed very different.

R Programming

R programing is more suited to more seasoned coders who have prior experience of coding. The syntax is actually very similar to that of the previous languages, such as C, or C++ or Java and so on. The fundamental rules are that of C programming language. Also, use of semicolons is deemed optional in R. However, semicolons are necessary for multiple lines in a code inside a code block.

Deep Learning and AI using Python

Python

Python on the other hand, is the language more adaptable to the new generation of programmers. You can come from a non-programming background and still learn Python with relative ease.

Python is one of the most user friendly languages for the beginners. The syntax is designed to prioritize readability over preciseness of the code. In layman’s terms – coding in Python is very close to reading and writing with hand. In this regard, it is really popular amongst beginners in Data Science.

Performance

The performance is essentially measured by speed essentially when it comes to programming.

R Programming

As far as the general consensus goes R programming is much slower in terms of speed. The reason behind this is that R programming was initially designed to be used by statisticians for data analysis. Thus, R programming stresses more on precision than the speed.

Python

Python on the other hand, is relatively faster than R. Python offers the same level of precision whilst acting on a faster speed.

Note – The speed is taken into account independent of packages and libraries.

Applicability

Lastly, we will discuss the popular domains in which these languages are used.

2

R Programming

As mentioned above, R was developed specifically for statisticians. For this reason, R is mainly used in various research organizations and academia in general. However, R is now quickly being absorbed in the enterprises as well, mainly because of its popularity and the availability of a large number of packages for statistical computation.

Python

Python is a gene

As Python is a general-purpose programming language we can use to build different kinds of applications. We can use Python to build web applications using popular frameworks like Django or Flask.

Lately, Python is becoming popular amongst data scientists as the language of choice given the simplicity of syntax, high speed and performance it has to offer. There has been a trend which has seen a sharp rise in the adaptability of Python over R in the last few years in Data Science.

So, there you have it folks. Decide for yourself now! We will meet you soon in the next blog.

Dexlab Analytics is a pioneering institute of Data Science and Big Data Analytics with all-inclusive Big data courses in Delhi along with numerous other efficacious courses like Hadoop certification in Delhi, R programming courses in Gurgaon and Python for Data Analysis under experienced trainers and professionals.


Interested in a career in Data Analyst?

To learn more about Data Analyst with Advanced excel course – Enrol Now.
To learn more about Data Analyst with R Course – Enrol Now.
To learn more about Big Data Course – Enrol Now.

To learn more about Machine Learning Using Python and Spark – Enrol Now.
To learn more about Data Analyst with SAS Course – Enrol Now.
To learn more about Data Analyst with Apache Spark Course – Enrol Now.
To learn more about Data Analyst with Market Risk Analytics and Modelling Course – Enrol Now.

Calculating the Standard Deviation Using R & Python

Calculating the Standard Deviation Using R & Python

When it comes to summarizing the data, standard deviation (σ) is the value which tells us about the spread of the data. More specifically, it gives information about the dispersion of each observation from the mean of the data. Now, if you are interested in understanding Mean and knowing how to calculate it, then we have shown you in CALCULATING GEOMETRIC MEAN USING R AND PYTHON And APPLICATION OF HARMONIC MEAN USING R AND PYTHON.

Thus, in essence standard deviation gives us valuable information about the robustness of the mean. The deviation is in both positive and negative direction of the mean.

Therefore, it is desirable for the standard deviation to be a low value in comparison to the mean. This would indicate a smaller spread.

Mathematically speaking, standard deviation is known as the second moment about Mean. Variance is standard deviation squared. The variance does not have any mathematical significance on its own. Think of the variance as a mere mathematical maneuver.

The formula for the Variance is:

Application:

An investor wants to calculate the Standard Deviation experience by his investment portfolio in last 12 months (Year 2017-2018).  The returns are:-

Month (Year 2017-18)

Returns (%)

April

12%

May

10%

June

-8%

July

4%

August

12.25%

September

18%

October

13%

November

-9%

December

-4%

January

3%

February

9%

March

11.05%

Calculate Standard Deviation in R:

Examining the Standard Deviation of the investment portfolio returns of a year in R, we get the deviation = 8.803533 or, 8.81% (Approx).

Calculate Standard Deviation in Python:

First, create a Data Frame in Python.

Now, calculate Standard Deviation of the returns,

Examining the Standard Deviation of the investment portfolio returns of a year in Python, we get the deviation = 8.803533209439092 or, 8.81% (Approx)

Standard Deviation is a key part of calculating margins of errors.

Standard deviation shows the variation from the mean. A low standard deviation indicates that the observations (series of number) are very close to the mean. A high standard deviation indicates that the observations (series of numbers) are spread out over a large range.

In this data the mean of the returns is 5.95%, and standard deviation is 8.81% which is close to the mean. So, the deviation of the data is low.

Thus, the investor now knows that the returns of his portfolio fluctuate by approximately 8.81% month-over-month. The information can be used to modify the portfolio to better the investor’s attitude towards risk. If the investor is risk-loving and is comfortable with investing in higher-risk, higher-return securities and can tolerate a higher standard deviation, he/she may consider adding in some small-cap stocks or high-yield bonds. Conversely, an investor who is more risk-averse may not be comfortable with this standard deviation and would want to add in safer investments such as large-cap stocks or mutual funds.

Endnotes

This article will surely help you to figure out the standard deviation with R and Python. However, if you want to have a general idea about Central tendency, about Mean, Median and Mode, then go through our blog on STATISTICAL APPLICATION IN R & PYTHON: CHAPTER 1 – MEASURE OF CENTRAL TENDENCY.

For all other information about us and our courses, Dexlab Analytics is there with you. You can also follow us on Facebook and LinkedIn and go through our blogs to stay updated always.


Interested in a career in Data Analyst?

To learn more about Data Analyst with Advanced excel course – Enrol Now.
To learn more about Data Analyst with R Course – Enrol Now.
To learn more about Big Data Course – Enrol Now.

To learn more about Machine Learning Using Python and Spark – Enrol Now.
To learn more about Data Analyst with SAS Course – Enrol Now.
To learn more about Data Analyst with Apache Spark Course – Enrol Now.
To learn more about Data Analyst with Market Risk Analytics and Modelling Course – Enrol Now.

R Programming: The Language Marketers Use to Tame Data

R Programming: The Language Marketers Use to Tame Data

How to manage data? This is a question that’s baffles us each and every time, whenever we look at data.

The real challenge is not about managing data, but how to synchronize processes to expose the issues with data. Today’s marketers may have a tough time tackling these challenges. Even more for non-tech-savvy marketers, they may be feel a bit overwhelmed, but we’ve a solution – R programming language is capable of performing specific tasks while preparing data for machine learning models or advanced analytics.

2

Basics of R

R programming is a popular open source language ideal for smart data visualization and statistical modeling. Generally, it functions through a terminal on a laptop, but you can also enjoy development environment software that makes R quite user-friendly.

One of the most sought after Integrated Development Environment (IDE) is RStudio – it’s very popular amongst practitioners mostly owing to its quad-window view, which let users view their results in the terminal beside the whiteboard platform.

Exploring Data with R

Data importing is the starting point of analyzing data. Fortunately, a more than sufficient number of R programming libraries exist today that are up to interface with a database or an API. Some of these libraries are: twitteR, RMongo and Jsonlite. A quick search across Comprehensive R Archive Network will help you find them.

Next, you have to turn your attention to data wrangling. It’s the method of mapping one row format to another, while amalgamating, dividing and rearranging rows and columns. Map out the metrics after ascertaining whether a task falls under one of the following mathematical categories:

  • Discrete Metrics
  • Continuous Metrics

Another significant step is corroborating the columns decided: are headers from the data source given? R Programming helps add headers on data as soon as data is imported. Furthermore, another question that pops up here is that are the headers from the same labels of parties who have access to data? Now, this question is instrumental in answering whether there is any more efficient way to have access to data consecutively without manually rectifying columns before placing the data in a model.

For R programming, some of the basic libraries to consider are as follows:

Readr – It helps estimate functions and read data in rectangular tabular formats

Tidyr – It helps in organizing missing field values and arranging tabular data in an effective and compatible structure

Dplyr – Ideal for transforming data after it’s added in R

Marketing Knowledge Is Still an Add-On Factor

Lastly, marketers should never ignore their domain knowledge, while modeling data. At times, your experience will help you tackle an outlier for a model in the best way possible. Or else, you might ask your technical team to adjust and manage data in cloud in a situation where other teams try to downstream assess data.

Thus, a relevant marketing knowledge is essential. It will help decide which data to be queried or how to parse it well.

If you are thinking of learning a popular yet effective programming language to tame your data, R Programming certification in Delhi NCR is the best solution for you. A good R programming training will help you understand and evaluate data like a pro.


The blog first appeared on ― www.cmswire.com/digital-marketing/how-marketers-can-plan-data-mining-with-r-programming


Interested in a career in Data Analyst?

To learn more about Data Analyst with Advanced excel course – Enrol Now.
To learn more about Data Analyst with R Course – Enrol Now.
To learn more about Big Data Course – Enrol Now.

To learn more about Machine Learning Using Python and Spark – Enrol Now.
To learn more about Data Analyst with SAS Course – Enrol Now.
To learn more about Data Analyst with Apache Spark Course – Enrol Now.
To learn more about Data Analyst with Market Risk Analytics and Modelling Course – Enrol Now.

Most Popular R Programming Interview Questions with Answers to Help You Get Started

Most Popular R Programming Interview Questions with Answers to Help You Get Started

Brainchild of Ross Ihaka and Robert Gentleman, R programming language was first developed in 1993 with an exclusive and extensive catalog of statistical and graphical techniques and processes, including machine learning, time series, linear regression, statistical inference and lot more.

In the following section, we’re about to talk about top interview questions on R programming –perfect for both freshers and experienced consultants, this interesting interview guide covers almost all the major concepts of R and its applications.

Dive Down!

2

What is R programming?

R programming is an ideal language used for data analysis, and to build incredible statistical software. It’s widely used for a wide range of machine learning applications.

How to write syntax for R commands?

When you start writing commands in R, start using # in the beginning of the line, so that the commands are written as #division.

How to project data analysis outcome through R language?

The best way to convey the results would be by combining the results of data, code and analysis on a document and present the data for further reproducible research. It would help the user recheck the result and take part in the following discussions. The reproducible research aids in performing experiments easily and solving crucial problems.

What are the data structures found in R programming?

Homogenous and Heterogeneous are two data structures found in R programming. For same kinds of objects, we suggest using homogenous data structures as for Array, Vectors and Matrix. And for different types of objects, it’s better to stick to heterogeneous data structures.

How should you import data in R language?

Importing of data in R is done with the help of R commander GUI – it’s used to type commands and is also known as Rcmdr.

Here are 3 ways to import data into R:

  • As soon as you select data set from the dialog box, enter the date set name as asked.
  • R command can also be used to enter data – Data-> New Data Set (It’s only applicable for small data sets).
  • The user can also import data directly from URL, through simple ASCII file, statistical package or from clipboards.

Highlight the advantages of R programming language.

  • The user doesn’t get entangled in license restrictions and norms for using R programming.
  • It’s an open source software and completely free of cost.
  • It has several graphical capabilities.
  • It is easily run on a majority of hardware and OS (including 32 and 64-bit processors).

Mention the limit for memory in R.

For a 32-bit system, the memory of R is limited to 3GB. And for a 64-bit system, the limit is extended to 8TB.

With this, hope you are ready to crack a tough job interview on R programming – however, for those, who want to dig deeper into the intricacies of this fascinating programming language, we have fabulous R programming courses in Gurgaon. With them discover the path towards a dream career!


The blog has been sourced from www.janbasktraining.com/blog/r-interview-questions-answers


Interested in a career in Data Analyst?

To learn more about Data Analyst with Advanced excel course – Enrol Now.
To learn more about Data Analyst with R Course – Enrol Now.
To learn more about Big Data Course – Enrol Now.

To learn more about Machine Learning Using Python and Spark – Enrol Now.
To learn more about Data Analyst with SAS Course – Enrol Now.
To learn more about Data Analyst with Apache Spark Course – Enrol Now.
To learn more about Data Analyst with Market Risk Analytics and Modelling Course – Enrol Now.

R Programming, Python or Scala: Which is the Best Big Data Programming Language?

R Programming, Python or Scala: Which is the Best Big Data Programming Language?

For data science and big data, R, Python and Scala are the 3 most important languages to master. It’s a widely-known notion, organizations of varying sizes relies on massive structured and unstructured data to predict trends, patterns and correlations. They are of expectation that such a robust analysis will lead to better business decisions and individual behavior predictions.

In 2017, the adoption of Big Data analytics has spiked up to 53% in companies – says Forbes.

The story of evolution

To start with, big data is just data, after all. The entire game-play depends on its analysis – how well the data is analyzed so as to churn out valuable business intelligence. With years, data burgeoned, and it’s still expanding. The evolution of big data mostly happened because traditional database structures couldn’t cope with such multiplying data – scaling data became an important issue.

For that, here we have some popular big data programming languages. Dive down:

R Programming

R Programming is mainly used for statistical analysis. A set of packages are available for R named Programming with Big Data in R (pbdR), which encourages big data analysis, across multiple systems via R code.

R is robust and flexible; it can be run on almost every OS. To top that, it boasts of excellent graphical capabilities, which comes handy when trying to visualize models, patterns and associations within big data structures.

According to industry standards, the average pay of R Programmers is $115,531 per year.

For R language training, drop by DexLab Analytics.

Python

Compared to R, Python is more of a general-purpose programming language. Developers adore it, because it’s easy to learn, a huge number of tutorials are available online and is perfect for data analysis, which requires integration with web applications.

Python gives excellent performance and high scalability for a series of complicated data science tasks. It is used with high-in-function big data engines, like Apache Spark through available Python APIs.

Their Machine Learning Using Python courses are of highest quality and extremely student-friendly.

Let’s Take Your Data Dreams to the Next Level

Scala

Last but not the least, Scala is a general-purpose programming language developed mainly to address some of the challenges of Java language. It is used to write Apache Spark cluster computing solution. Hence, Scala has been a popular programming language in the field of data science and big data analysis, in particular.

There was a time when Scala was mandatory to work on Spark, but with the proliferation of many API endpoints approachable with other languages, this problem has been addressed. Nevertheless, it’s still the most significant and popular language for several big data tools, including Finagle. Also Scala houses amazing concurrency support, which parallelizes a whole many processes for huge data sets.

The average annual salary for a data scientist with Scala skills is $102,980.

In the end, you can never go wrong with selecting any one of the big data programming languages. All of them are equally good, productive and easy to excel on. However, Python is probably the best one to start off with.

For more updates or information on big data courses, visit DexLab Analytics.

The original article is here at – http://www.i-programmer.info/news/197-data-mining/11622-top-3-languages-for-big-data-programming.html


Interested in a career in Data Analyst?

To learn more about Machine Learning Using Python and Spark – click here.

To learn more about Data Analyst with Advanced excel course – click here.
To learn more about Data Analyst with SAS Course – click here.
To learn more about Data Analyst with R Course – click here.
To learn more about Big Data Course – click here.

Periscope Data Adds Python, R and SQL on A Single Platform for Better, Powerful Data Analysis

Periscope Data Adds Python, R and SQL on A Single Platform for Better, Powerful Data Analysis

Recently, a veteran data analytics software provider, Periscope Data announced some brand new developments while updating their Unified Data Platform for Python, R programming and Structured Query Language. This new Unified Data Platform will enable data professionals to work in sync with 3 key skills all on a single platform.  Far more better analysis will be conducted using less time by altering data in SQL, executing complex statistical analyses in Python or R, followed by improved visualization, collaboration and reporting of results – all performed on Periscope’s dynamic analytics platform.

A massive data explosion is taking place around the world around us. More than 90% of the world’s data has been created in the past two years, and the numbers are still on the rise. To this, new levels of sophistication needs to be added to analyze the complexity of data – “The addition of Python and R support to our Unified Data Platform gives our customers a unique combination of tools – from machine learning to natural language processing to predictive analytics, analysts will be able to answer new questions that have yet to be explored,” says Harry Glaser, co-founder and CEO of Periscope Data.

The inclusion of Python and R support in Periscope framework comes with ample benefits, and some of them are highlighted below:

2

All data at a single place

Instead of relying on several data sources, Periscope Data prefers to combine data together collected from various databases to bring them to a single platform, where nothing but a single source of truth for data is established. The data collected is updated and in crisp format.

Predictive analytics

It’s time to leverage Python and R libraries and move beyond the conventional historical reporting for the sake of modeling predictions. With lead scoring and churning prediction, businesses are now in a better position to derive significant insights about a future of a company.

No more switching between tools

Seamlessly, users can switch between querying data in SQL and analyzing data in R or Python, all at the same time on a same platform. Data professionals will be able to modify their datasets, enhance the performance of their models and update visualizations from a single location.

Mitigate data security concerns

The integration of R, Python and SQL by Periscope Data ensures the data professionals can run and share all sorts of models securely and in full compliance with all the norms, instead of seeking open source tools. Periscope Data is SOC2 and HIPAA compliant. It performs regular internal audits to check compliance requirements and safety issues.

Efficient collaboration with teams

As all the analysis takes place in a central location, be sure all your insights will be thoroughly consistent, secure and free of any version-control issues. Also, Periscope Data allows you and your team members the right to read and write access when required.

Easy visualization of analysis

To develop powerful visualizations that reach one’s heart and mind, leverage Periscope’s resources to the optimum levels. Data teams allow users to easily visualize through R packages and Python libraries so as to nudge users to explore the better horizons of data.

To learn more about R programming or Python, opt for Python & Spark training by DexLab Analytics. R language certification in Delhi NCR empowers students and professionals to collaborate and derive better insights faster and efficiently.


Interested in a career in Data Analyst?

To learn more about Data Analyst with Advanced excel course – Enrol Now.
To learn more about Data Analyst with R Course – Enrol Now.
To learn more about Big Data Course – Enrol Now.

To learn more about Machine Learning Using Python and Spark – Enrol Now.
To learn more about Data Analyst with SAS Course – Enrol Now.
To learn more about Data Analyst with Apache Spark Course – Enrol Now.
To learn more about Data Analyst with Market Risk Analytics and Modelling Course – Enrol Now.

Call us to know more