Python Programming training Archives - Page 3 of 3 - DexLab Analytics | Big Data Hadoop SAS R Analytics Predictive Modeling & Excel VBA

An Introduction to Matplotlib Object Oriented Method: Visualization with Python (Part II)

An Introduction to Matplotlib Object Oriented Method: Visualization with Python (Part II)

In the last blog that covered Part 1 of the visualization series using Python programming language, we have learned the basics of the Matplotlib Library. Now that our grasp on the basics is strong we would move further. Let’s break it all down with a more formal introduction of Matplotlib’s Object Oriented API. This means we will instantiate figure objects and then call methods or attributes from that object.

Introduction to the Object Oriented Method

The main idea in using the more formal Object Oriented method is to create figure objects and then just call methods or attributes off of that object. This approach is nicer when dealing with a canvas that has multiple plots on it.

How to make multiple plots using .add_axes()

To begin, we create a figure instance. Then we can add axes to that figure where .figure()is a method which helps us create an empty canvas and then we use .add_axes() method to give the position where the plot is to be made. The positional arguments [left, bottom, width, height] help us decide from where the graph should begin within the canvas and what should be the width and the height of the graph. Since the area of the graph is 100% (1.0), the range of the positional argument should be between 0 and 1 and in case you want to plot the graph half within and half outside the canvas, you can go beyond the specified range depending upon your needs.

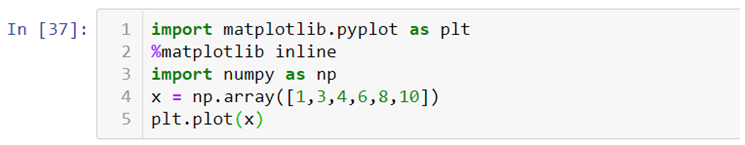
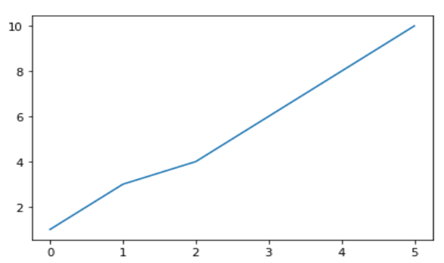
Let’s  quickly get to the coding part now.

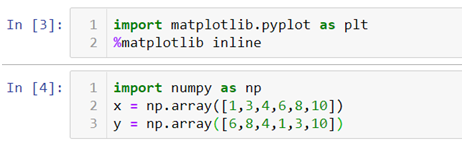
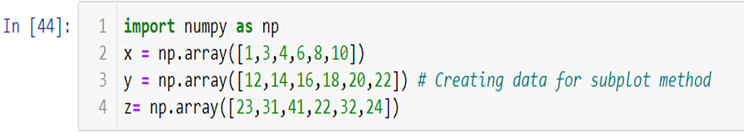
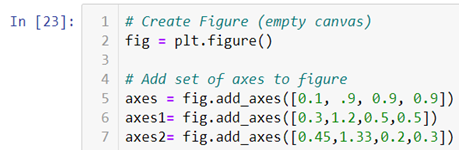
  • In the above line of codes we are simply importing the Matplotlib library and creating a data which we want to plot.

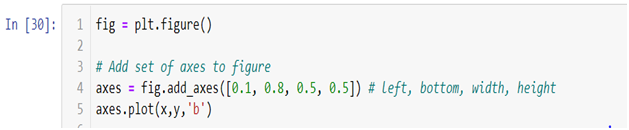
  • plt.figure()method is helping us create an empty canvas and then we are giving the positional values to the .add_axes() method. As you can see we are using a variable named fig to save our canvas and then using the same variable as an object to add an axes to the canvas. Now all we need to do is use that axes to build are graph by adding x and y data.
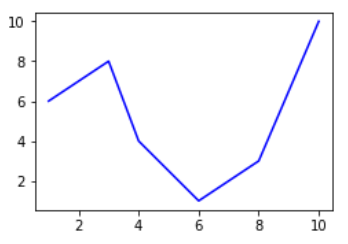
  • Now you must be wondering why we aren’t able to see a plot in the corner of the canvas? It is because this procedure works only if we were to build multiple plots. So now let’s see how we can use the .add_axes() method to build multiple plots on top of each other.

  • In the above line of codes we are creating three axes and each axes is smaller than the other so that we are able to plot multiple graphs on top of each other.

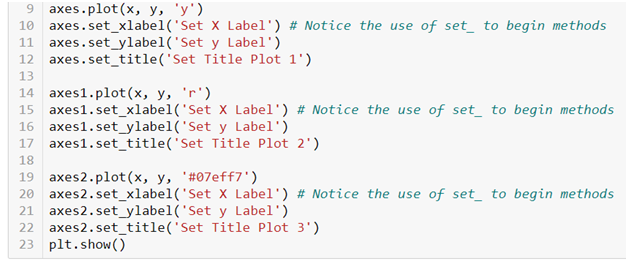
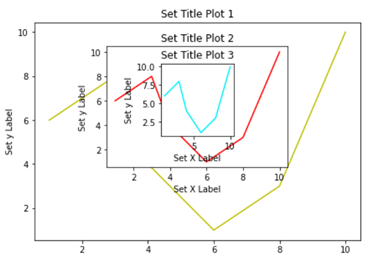
  • Here we are making three different graphs and each graph has its own title and x axis and y axis labels. But to add title and axis labels we are now using .set_title(), .set_xlabel(), and .set_ylabel() instead of .title(), .xlabel() and .ylabel(). In axes2.plot() we are also using RGB color instead of using the predefined color in .plot() method. You can use your favorite color too by simply typing RGB color picker in your Google search and copy pasting the color code in the .plot() method. After running the above code we get the following graph:-

How to make multiple plots using .subplots()

.subplots() method is similar to the previous .subplot() method, the only difference is that now we use it on a canvas.

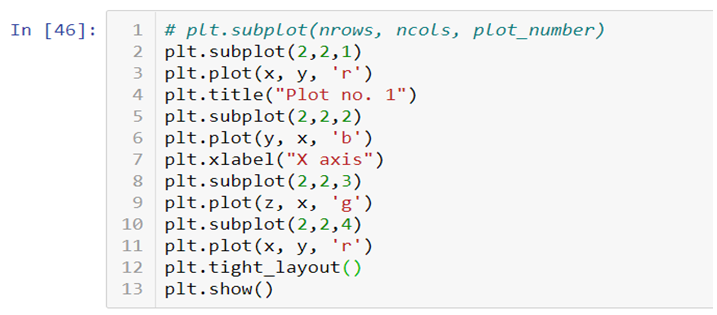
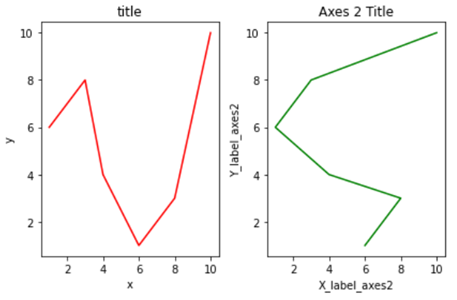
  • In the .subplots() we do not mention the plot number instead we use plot indexing method to build graph.

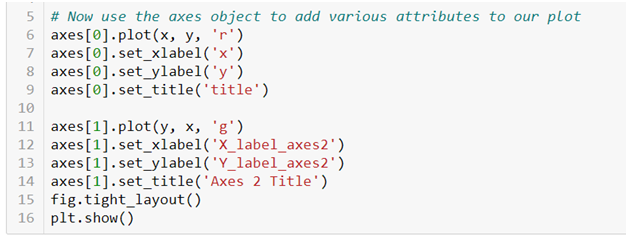
  • As you can see we are accessing the index number to build our plot and then using .tight_layout() method to keep the graphs from overlapping. After running the above code we get the following graphs:-

Do not forget to check out the video tutorial attached below to learn how this method works. Keep following the series to upgrade your skills and to explore more informative posts on topics like Python Programming training you need to follow the Dexlab Analytics blog.


.

A Quick Guide To Using Matplotlib Library (Part I)

A Quick Guide To Using Matplotlib Library

Matplotlib is the “grandfather” library of data visualization with Python. It was created by John Hunter. He created it to try replicating MatLab’s (another programming language) plotting capabilities in Python. So, if you are already familiar with matlab, matplotlib will feel natural to you.

This library gives you the flexibility to plot the graphs the way you want. You can start with a blank canvas and plot the graph on that canvas wherever you want. You can make multiple plots on top of each other, change the line type, change the line color using predefined colors or hex codes, line width etc.

Data Science Machine Learning Certification

Installation

Before you begin you’ll need to install matplotlib first by using the following code:-

There are two ways in which you can built matplotlib graphs:-

  • Method based graphs
  • Object-oriented graphs

Method Based Graphs in Matplotlib:-

There are pre-defined methods in matplotlib library which you can use to  create graphs directly using python language for example:-

Where, import matplotlib.pyplot as plt this code is used to import the library, %matplotlib inline is used to keep the plot within the parameters of the jupyter notebook, import numpy as np and x = np.array([1,3,4,6,8,10]) is used to import the numpy (numerical python) library and create an array x and plt.plot(x) is used to plot the distribution of the x variable.

We can also use .xlabel(), .ylabel() and .title() methods print x axis and y axis labels and title on the graph.

If you want to add text within your graph you can either use .annotate() method or .text() method.

Creating Multiplots

You can also create multiple plots by using .subplot() method by mentioning the number of rows and columns in which you want your graphs to be plotted. It works similar to the way you mention the number of rows and columns in a matrix.

You can add title, axis labels, texts etc., on each plot separately. In the end you can add .tight_layout() to solve the problem of overlapping of the graphs and to make the labels and scales visible.

Check out the video attached below to get an in-depth understanding of how Matplotlib works. This is a part of a visualization series using Python programming language. So, stay tuned for more updates. You can discover more such informative posts on the Dexlab Analytics blog.


.

Data Warehouse: Concept and Benefits

Data Warehouse: Concept and Benefits

A business organization has to deal with a massive amount of data streaming from myriad sources, and data warehousing refers to the process of collection and storage of that data that needs to be analyzed to glean valuable business insight.  Data warehousing plays a crucial role in business intelligence. The concept originated in the 1980s, it basically involves data extraction from disparate sources which later gets processed and post formatting the data stays in the system ready to be utilized for taking important decisions.

Data warehouse basically performs the task of running an analysis on the stored data which could be both structured and unstructured even semi-structured, however, the data that is in the warehouse cannot be modified. Data warehousing basically helps companies gain insight regarding factors influencing business, and they could use the data insight to formulate new strategies, developing products and so on. This highly skilled task demands professionals who have a background in Data science using python training.

What are the different steps in data warehousing?

Data warehousing involves the following steps

Transactional data extraction: In this step, the data is extracted from multiple sources available and loaded into the system.

Data transformation: The transactional data extracted from different sources need to be transformed and it would need relating as well.

Building a dimensional model: A dimensional model comprising fact and dimension tables are built and the data gets loaded.

Getting a front-end reporting tool: The tool could be built or, purchased, a crucial decision that needs much deliberation.

Benefits of data warehousing

An edge over the competition

This is undeniably one benefit every business would be eager to reap from data warehousing.  The data that is untapped could be the source of valuable information regarding risk factors, trends, customers and so many other factors that could impact the business. Data warehousing collates the data and arranges them in a contextual manner that is easy for a company to access and utilize to make informed decisions.

Enhanced data quality

Since data pooled from different sources could be structured or, unstructured and in different formats, working with such data inconsistency could be problematic and data warehousing takes care of the issue by transforming the data into a consistent format. The standardized data that easily conforms to the analytics platform can be of immense value.

Historical data analysis

A data warehouse basically stores a big amount of data and that includes historical data as well. Such data are basically old records of the company regarding sales, employee data, or, product-related information. Now the historical data belonging to different time periods need to be analyzed to predict upcoming trends.

Smarter business intelligence

Since businesses now rely on data-driven insight to devise strategies, they need access to data that is consistent, error-free, and high quality. However, data coming from numerous sources could be erroneous and irrelevant. But, data warehousing takes care of this issue by formatting the data to make it consistent and free from any error and could be analyzed to offer valuable insight that could help the management take decisions regarding sales, marketing, finance.

High ROI

Building a data warehouse requires significant investment but in the long term, the revenue that it generates can be significant. In fact, keen business intelligence now plays a crucial role in determining the success of an organization and with data warehousing the organizations can have access to data that is consistent and high quality thus enabling the company to derive actionable intel.  When a company implements such insight in making smarter strategies, they do gain in the long run.

Data Science Machine Learning Certification

Data warehousing plays a significant role in collating and storing valuable data that fuels a company’s business decisions. However,  given the specialized nature of the task, one must undergo Data Science training, to learn the nuances. The field of big data has plenty of opportunities for the right candidates.


.

A Quick Guide to Data Mining

A Quick Guide to Data Mining

Data mining refers to processing mountainous amount of data that pile up, to detect patterns and offer useful insight to businesses to strategize better. The data in question could be both structured and unstructured datasets containing valuable information and which if and when processed using the right technique could lead towards solutions.

Enrolling in a Data analyst training institute, can help the professionals involved in this field hone their skills. Now that we have learned what data mining is, let’s have a look at the data mining techniques employed for refining data.  

Data cleaning

Since the data we are talking about is mostly unstructured data it could be erroneous, corrupt data. So, before the data processing can even begin it is essential to rectify or, eliminate such data from the data sets and thus preparing the ground for the next phases of operations. Data cleaning enhances data quality and ensures faster processing of data to generate insight. Data Science training is essential to be familiar with the process of data mining.

Classification analysis

Classification analysis is a complicated data mining technique which basically is about data segmentation. To be more precise it is decided which category an observation might belong to. While working with various data different attributes of the data are analyzed and the class or, segments they belong to are identified, then using algorithms further information is extracted.   

Regression analysis

Regression analysis basically refers to the method of deciding the correlation between variables. Using this method how one variable influences the other could be decided. It basically allows the data analyst to decide which variable is of importance and which could be left out. Regression analysis basically helps to predict.  

Anomaly detection

Anomaly detection is the technique that detects data points, observations in a dataset, that deviate from an expected or, normal pattern or behavior. This anomaly could point to some fault or, could lead towards the discovery of an exception that might offer new potential. In fields like health monitoring, or security this could be invaluable.

Clustering

This data mining technique is somewhat similar to classification analysis, but, different in the way that here data objects are grouped together in a cluster. Now objects belonging to one particular cluster will share some common thread while they would be completely different from objects in other clusters. In this technique visual presentation of data is important, for profiling customers this technique comes in handy.  

Association

This data mining technique is employed to find some hidden relationhip patterns among variables, mostly dependent variables belonging to a dataset. The recurring relationships of variables are taken into account in this process. This comes in handy in predicting customer behavior, such as when they shop what items are they likely to purchase together could be predicted.

Data Science Machine Learning Certification

Tracking patterns

This technique is especially useful while sorting out data for the businesses. In this process while working with big datasets, certain trends or, patterns are recognized and these patterns are then monitored to draw a conclusion. This pattern tracking technique could also aid in identifying some sort of anomaly in the dataset that might otherwise go undetected.

Big data is accumulating every day and the more efficiently the datasets get processed and sorted, the better would be the chances of businesses and other sectors be accurate in predicting trends and be prepared for it. The field of data science is full of opportunities now, learning Data science using python training could help the younger generation make it big in this field.


.

Application of Data Science in Healthcare

Application of Data Science in Healthcare

In today’s data-driven world,  it is hard to ignore the growing need for data science, as businesses are busy applying data to devise smarter marketing strategies and urging their employees to upgrade themselves. Data Science training is gaining ground as lucrative career opportunities are beckoning the younger generation.

So, it is not surprising that a crucial sector like healthcare would apply data science to upgrade their service. Health care is among one of the many sectors that have acknowledged the benefits of data science and adopted it.

The Healthcare industry is vast and it comprises many disciplines and branches that intercross generating a ton of unstructured data which if processed and analyzed could lead to revolutionary changes in the field.

Here is taking a look at how the industry can benefit by adopting data science techniques

Diagnostic error prevention

No matter what health issues one might have, accurate diagnosing is the first step that helps a physician prescribe treatment procedure. However, there have been multiple cases where a diagnostic error has led to even death. With the implementation of data science technology, it is now possible to increase the accuracy of the procedures as the algorithm sifts data to detect patterns and come up with accurate results.

Medical imaging procedures such as MRI, X-Ray can now detect even tiniest deformity in the organs which were erstwhile impossible, due to the application of deep learning technology.  Advanced models such as MapReduce is also being put to use to enhance the accuracy level.

Bioinformatics

 Genomics is an interesting field of research where researchers analyze your DNA to understand how it affects your health. As they go through genetic sequences to gain an insight into the correlation, they try to find how certain drugs might work on a specific health issue.

The purpose is to provide a more personalized treatment program. In order to process through the highly valuable genome data, data science tools such as SQL are being applied. This field has a vast scope of improvement and with more advanced research work being conducted in the field of Bioinformatics, we can hope for better results.  Researchers who have studied Data science using python training, would prove to be invaluable assets for this specific field.

Health monitoring with wearables

Healthcare is an ongoing process, if you fall ill, you get yourself diagnosed and then get treatment for the health condition you have. The story in most cases does not end there, with the number of patients with chronic health problems increasing, it is evident that constant monitoring of your health condition is required to prevent your health condition from taking a worse hit.  Data science comes into the picture with wearables and other forms of tracking devices that are programmed to keep your health condition in check. Be it your temperature or, heartbeat the sensors keep tracking even minute changes, the data is analyzed to enable the doctors take preventive measures, the GPS-enabled tracker by Propeller, is an excellent case in point.

Faster approval of new drugs

The application of data science is not restricted to only predicting, preventing, and monitoring patient health conditions. In fact, it has reached out to assist in the drug development process as well. Earlier it would take almost a decade for a drug to be accessible in the market thanks to the numerous testing, trial, and approval procedures.

But, now it is possible to shorten the duration thanks to advanced data science algorithms that enable the researchers to simulate the way a drug might react in the body. Different models are being used by the researchers to process clinical trial data, so, that they can work with different variables. Data Science course enables a professional to carry out research work in such a highly specialized field.

Data Science Machine Learning Certification

In the context of Covid-19

With the entire world crippling under the unprecedented impact of COVID-19, it is needless to point out that the significance of data science in the healthcare sector is only going to increase. If you have been monitoring the social media platforms then you must have come across the #FlattenTheCurve.

The enormity of the situation and erroneous data collection both have caused issues, but, that hasn’t deterred the data scientists. Once, the dust settles they will have a mountainous task ahead of them to process through a massive amount of data the pandemic will have left behind, to offer insight that might help us take preventive measures in the future.

The field of data science has no doubt made considerable progress and so has the field of modern healthcare. Further research and collaboration would enable future data scientists to provide a better solution to bolster the healthcare sector.


.

Top Python Libraries to Know About in 2020

Top Python Libraries To Know About In 2020

Python today is one of the most sought after programming languages in the world. As per Python’s Executive Summary, “Python is an interpreted, object-oriented, high-level programming language with dynamic semantics. Its high-level built in data structures, combined with dynamic typing and dynamic binding, make it very attractive for Rapid Application Development, as well as for use as a scripting or glue language to connect existing components together. Python’s simple, easy to learn syntax emphasizes readability and therefore reduces the cost of program maintenance.”

The most advantageous facet of Python is the richness of its library sources and the myriad uses and applications of these libraries in programming. This essay is dedicated to studying some of the best Python libraries available.

Tensor Flow

Tensor Flow is a highly popular open source library built by Google and Brain Team. It is used in almost all Google projects for machine learning. Tensor Flow 

works as a computational library for writing fresh algorithms that require vast amounts of tensor operations.

Scikit-learn

Unarguably one of the most competent libraries for working with complex data, Scikit-learn is a python library associated with Numpy and SciPy. This library facilitates cross validation or the ability to use more than one metric.

Keras

Keras is one of the most revolutionary libraries in Python in that it makes it easy to express neural networks. Keras provides some of the most competent utilities for compiling models, processing datasets and more.

PyTorch

It is the largest machine learning library that permits developers to perform tensor computation, create dynamic graphs and calculate gradients automatically. Also, it offers a rich repository of APIs for solving applications related to neural networks.

Light GBM

Gradient Boosting is one of the best machine learning libraries that helps developers build new algorithms using elementary models like decision trees. This library is highly scalable and optimal for fast implementation of gradient boosting.

Eli5

This library helps overcome the problem of inaccuracy in machine learning model predictions. It is used in mathematical operations that consume less computational time and it is important when it comes to depending on other Python libraries.

SciPy

This library is built using Numpy and it is used in high-level computations in data science. It is used extensively for scientific and computations, solving differential equations, linear algebra and optimization algorithms.

Data Science Machine Learning Certification

Pandas

Python Data Analysis or Pandas is another highly popular library that is crucial to a data science life cycle in a data science project. Pandas provides super fast and flexible data structures such as data frame CDs that are specifically designed to work with structured data intuitively.

There are many more libraries like Theano and Librosa that are lesser known but very very important for machine learning, the most revolutionary scientific development of our century. To know more on the subject, do peruse the DexLab Analytics website today. DexLab Analytics is a premier Machine Learning institute in Gurgaon.


.

Why Learning Python is Important for Data Scientists Today

Why Learning Python is Important for Data Scientists Today

Data Science is the new rage and if you are looking to make a career, you might as well choose to become a data scientist. Data Scientists work with large sets of data to draw valuable insights that can be worked upon. Businesses rely on data scientists to sieve through tonnes of data and mine out crucial information that becomes the bedrock of business decisions in the future.

With the growth of AI, machine learning and predictive analytics, data science has come to be one of the favoured career choices in the world today. It is imperative for a data scientist to know one of more programming languages from any of those available – Java, R, Python, Scala or MATLAB.

However, Data Scientists prefer Python to other programming languages because of a number of reasons. Here we delve into some of them.

Popular

Python is one of the most popular programming languages used today. This dynamic language is easy to pick up and learn and is the best option for beginners. Secondly, it interfaces with complex high performance algorithms written in Fortran or C. It is also used for web development, data mining and scientific computing, among others.

Preferred for Data Science

Python solves most of the daily tasks a data scientist is expected to perform. “For data scientists who need to incorporate statistical code into production databases or integrate data with web-based applications, Python is often the ideal choice. It is also ideal for implementing algorithms, which is something that data scientists need to do often,” says a report

Packages

Python has a number of very useful packages tailored for specific functions, including pandas, NumPy and SciPy. Data Scientists working on machine learning tasks find scikit-learn useful and Matplotlib is a perfect solution for graphical representation and data visualization in data science projects.

Easy to learn

It is easy to grasp and that is why not only beginners but busy professionals also choose to learn Python for their data science needs. Compared to R, this programming language shows a sharper learning curve for most people choosing to learn it.

Scalability

Unlike other programming languages, Python is highly scalable and perceptive to change. It is also faster than languages like MATLAB. It facilitates scale and gives data scientists multiple ways to approach a problem. This is one of the reasons why Youtube migrated to Python.

Libraries

Python offers access to a wide range of data science and data analysis libraries. These include pandas, NumPy, SciPy, StatsModels, and scikit-learn. And Python will keep building on these and adding to these.  These libraries have made many hitherto unsolvable problems seem easy to crack for data scientists.

Data Science Machine Learning Certification

Python Community

Python has a very robust community and many data science professionals are willing to create new data science libraries for Python users. The Python community is tight-knit one and very active when it comes to finding a solution. Programmers can connect with community members over the Internet and Codementor or Stack Overflow.

So, that is why data scientists tend to opt for Python over other programming languages. This article was brought to you by DexLab Analytics. DexLab Analytics is premiere data science training institute in Gurgaon.


.

Call us to know more