Python Programming course Archives - Page 2 of 3 - DexLab Analytics | Big Data Hadoop SAS R Analytics Predictive Modeling & Excel VBA

Skewness and Kurtosis: A Definitive Guide

Skewness and Kurtosis: A Definitive Guide

While dealing with data distribution, Skewness and Kurtosis are the two vital concepts that you need to be aware of. Today, we will be discussing both the concepts to help your gain new perspective.

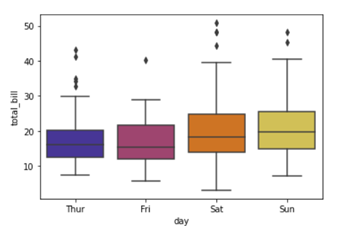
Skewness gives an idea about the shape of the distribution of your data. It helps you identify the side towards which your data is inclined. In such a case, the plot of the distribution is stretched to one side than to the other. This means in case of skewness we can say that the mean, median and mode of your dataset are not equal and does not follow the assumptions of a normally distributed curve.

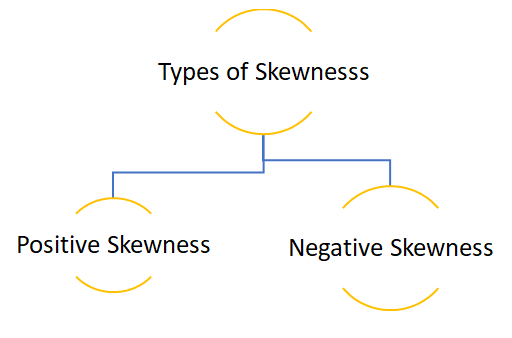
Positive skewness:- When the curve is stretched towards the right side more it is called a positively skewed curve. In this case mean is greater than median and median is the greater mode

(Mean>Median>Mode)

Let’s see how we can plot a positively skewed graph using python programming language.

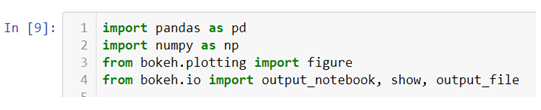
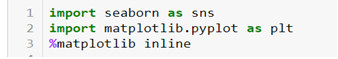
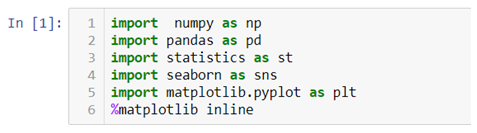
  • First we will have to import all the necessary libraries.

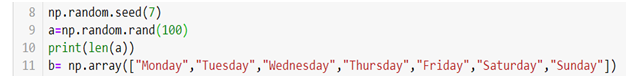
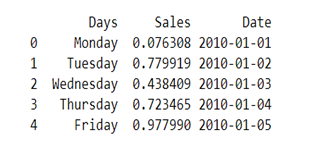
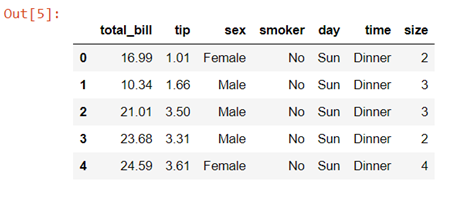
  • Then let’s create a data using the following code:-

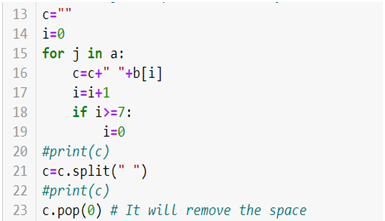
In the above code we first created an empty list and then created a loop where we are generating a data of 100 observations. The initial value is raised by 0.1 and then each observation is raised by the loop count.

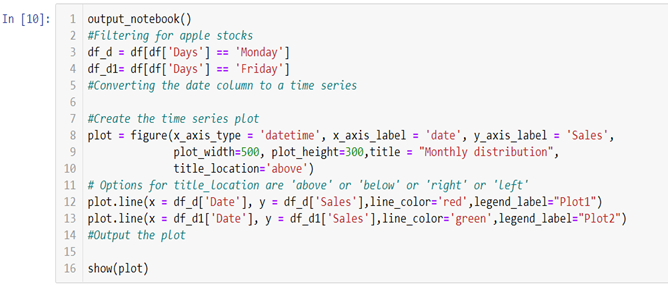
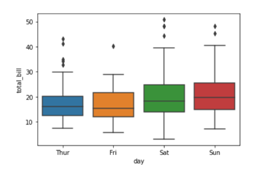
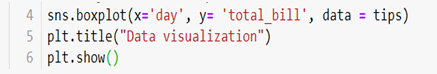
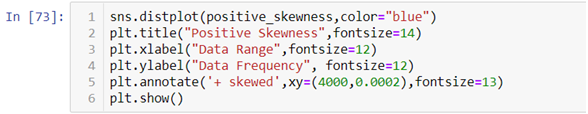
  • To get a visual representation of the above data we will be using the Seaborn library and to add more attributes to our graph we will use the Matplotlib methods.


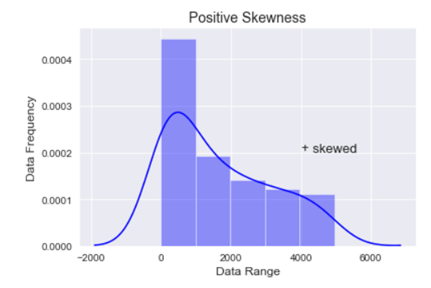
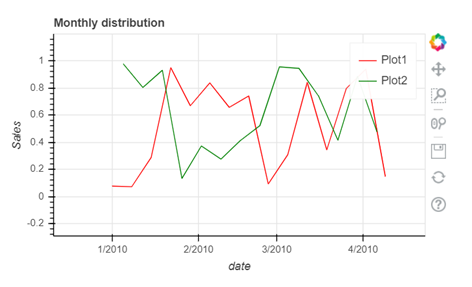
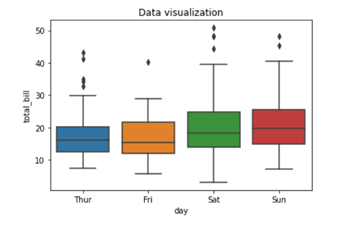
In the above graph you can see that the data is stretched towards right, hence the data is positively skewed.

  • Now let’s cross validate the notion that whether Mean>Median>Mode or not.


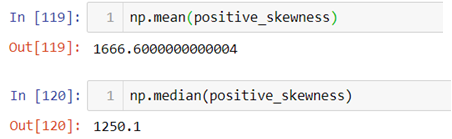
Since each observation in the dataset is unique mode cannot be calculated.

Calculation of skewness:

Formula:-

  • In case we have the value of mode then skewness can be measured by Mode ─ Mean
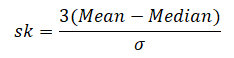
  • In case mode is ill-defined then skewness can be measured by 3(Mean ─ Median)
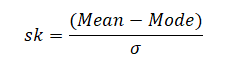
  • To obtain relative measures of skewness, as in dispersion we use the following formula:-

When mode is defined:-
When mode is ill-defined:-


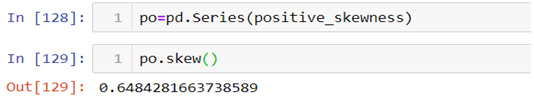
To calculate positive skewness using Python programming language we use the following code:-


Negative skewness:- When the curve is stretched towards left side more it is called a negatively skewed curve. In this case mean is less than median and median is  mode.

(Mean<Median<Mode)

Now let’s see how we can plot a negatively skewed graph using python programming language.

Since we have already imported all the necessary libraries we can head towards generating the data.|


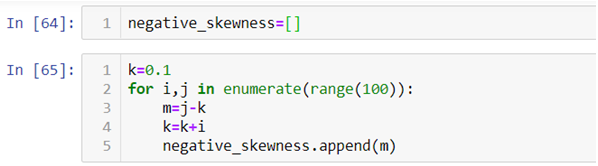
In the above code instead of raising the value of observation we are reducing it.

  • To visualize the data we have created again we will use the Seaborn and Matplotlib library.


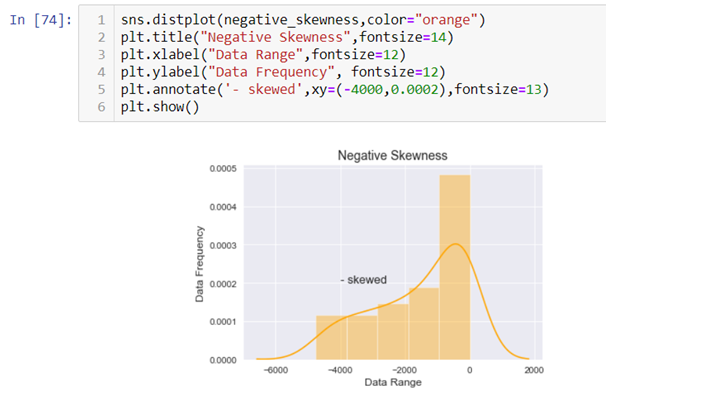
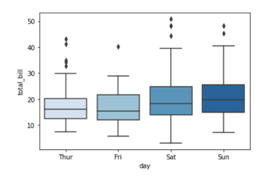
The above graph is stretched towards left, hence it is negatively skewed.

  • To check whether Mean<Median<Mode or not again we will be using the following code:-


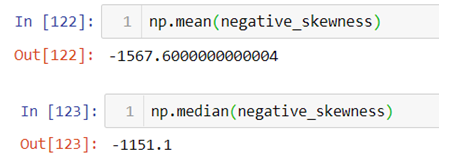
The above result shows that the value of mean is less than mode and since each observation is unique mode cannot be calculated.

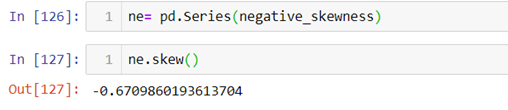
  • Now let’s calculate skewness in Python.


Kurtosis

Kurtosis is nothing but the flatness or the peakness of a distribution curve.   

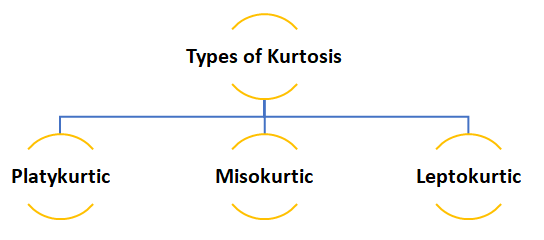
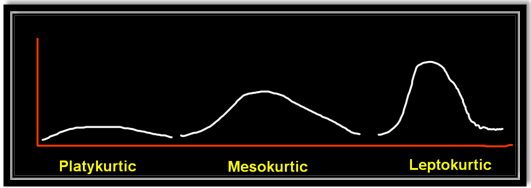
  • Platykurtic :- This kind of distribution has the smallest or the flattest peak.
  • Misokurtic:- This kind of distribution has a medium peak.
  • Leptokurtic:- This kind of distribution has the highest peak.


The video attached below will help you clear any query you might have.

So, this was the discussion on the Skewness and Kurtosis, at the end of this you have definitely become familiar with both concepts. Dexlab Analytics blog has informative posts on diverse topics such as neural network machine learning python which you need to explore to update yourself. Dexlab Analytics offers cutting edge courses like machine learning certification courses in gurgaon.


.

A Definitive Guide to Machine Learning

A Definitive Guide to Machine Learning

In a world that is riveting towards exploring the hidden potential of emerging technologies like artificial intelligence, staying aware can not only keep you in sync but can also ensure your growth. Among all the tech terms doing the rounds now, machine learning is probably the one that you have heard frequently or, it might also be the term that intrigues you the most. You might even have a friend who is pursuing a Machine Learning course in Gurgaon. So, amidst all of this hoopla why don’t you upgrade your knowledge regarding machine learning? It’s not rocket science but, it’s science and it’s really cool!

Machine learning is a subset of AI that revolves round the concept of enabling a system to learn from the data automatically while finding patterns and improve the ability to predict without being explicitly programmed beforehand. One of the examples would be when you shop online from a particular site, you would notice product recommendations are lining up the page that particularly align with your preferences.  The data footprint you leave behind is being picked up and analyzed to find a pattern and machine learning algorithms work to make predictions based on that, it is a continuous process of learning that simulate human learning process.

The same experience you would go through while watching YouTube, as it would present more videos based on your recent viewing  pattern. Being such a powerful technology machine learning is gradually being implemented across different sectors and thereby pushing the demand for skilled personnel.  Pursuing machine learning certification courses in gurgaon from a reputed institute, will enable an individual to pick up the nuances of machine learning to land the perfect career.

What are the different types of machine learning?

When we say machines learn, it might sound like a simple concept, but, the more you delve deeper into the topic to dissect the way it works you would know that there are more to it than meets the eyes. Machine learning could be divided into categories based on the learning aspect, here we will be focusing on 3 major categories which are namely:

  • Supervised Learning
  • Unsupervised Learning
  • Reinforcement Learning

Supervised Learning

Supervised learning as the name suggests involves providing the machine learning algorithm with training dataset, an example of sort to enable the system to learn to work its ways through to form the connection between input and output, the problem and the solution. The data provided for the training purposes needs to be correctly labeled so, that the algorithm is able to identify the relationship and could learn to predict output based on the input and upon finding errors could make necessary modifications. Post training when given a new dataset it should be able to analyze the input to predict a likely output for the new dataset.  This basic form of machine learning is used for facial recognition, for classifying spams.

Unsupervised Learning

Again the term is suggestive like the prior category we discussed above, this is also the exact opposite of supervised learning as here there is no training data available to rely on. The input is available minus the output hence the algorithm does not have a reference to learn from. Basically the algorithm has to work its way through a big mass of unclassified data and start finding patterns on its own, due to the nature of its learning which involves parsing through unclassified data the process gets complicated yet holds potential. It basically involves clustering and association to work its way through data.

Reinforcement Learning

Reinforcement learning could be said to have similarity with the way humans learn through trial and error method. It does not have any guidance whatsoever and involves a reward, in a given situation the algorithm needs to work its way through to find the right solution to get to the reward, and it gets there by overcoming obstacles and learning from the errors along the way. The algorithm needs to analyze and find the best solution to maximize its rewards and minimize penalties as the process involves both. Video games could be an example of reinforcement learning.

Although only 3 core categories have been mentioned here, there remains other categories which deserve as much attention, such as deep learning. Deep learning too is a comparatively new field that deserves a complete discussion solely devoted to understanding this dynamic technology, focusing on its various aspects including how to be adept at deep learning for computer vision with python.

Machine learning is a highly potent technology that has the power to predict the future course of action, industries are waking up to smell the benefits that could be derived from implementation of ML. So, let’s quickly find out what some of the applications are:

Malware and spam filtering

You do not have to be tech savvy to understand what email spams are or, what malware is. Application of machine learning is refining the way emails are filtered with spams being detected and sent to a separate section, the same goes for malware detection as ML powered systems are quick to detect new malware from previous patterns.

Virtual personal assistants

As Alexa and Siri have become a part of life, we are now used to having access to our very own virtual personal assistants. However, when we ask a question or, give a command, ML starts working its magic as it gathers the data and processes it to offer a more personalized service by predicting the pattern of commands and queries.

Refined search results

When you put in a search query in Google or, any of the search engines the algorithms follow and learn from the pattern of the way you conduct a search and respond to the search results being displayed. Based on the patterns it refines the search results that impact page ranking.

Data Science Machine Learning Certification

Social media feeds

Whether it is Facebook or, Pinterest , the presence of machine learning could be felt across all platforms. Your friends, your interactions, your actions all of these are monitored and analyzed by machine learning algorithms to detect a pattern and prepare friend suggestions list. Automatic Friend Tagging Suggestions is another example of ML application.

Those were a couple of examples of machine learning application, but this dynamic field stretches far. The field is evolving and in the process creating new career opportunities. However, to land a job in this field one needs to have a background in Machine Learning Using Python, to become an expert and land the right job.


.

Engineering To Data Science: What’s Causing The Professionals To Consider A Mid-Career Switch?

Engineering To Data Science: What's Causing The Professionals To Consider A Mid-Career Switch?

Among all the decisions we make in our lives, choosing the right career path seems to be the most crucial one. Except for a couple of clueless souls, most students know by the time they clear their boards what they aspire to be. A big chunk of them veer towards engineering, MBA, even pursue masters degree in academics and post completion of their studies they settle for relevant jobs. So far that used to be the happily ever after career story, but, in the last couple of years there seems to be a big paradigm shift and it is causing a stir across industries. Professionals having an engineering background, or, masters degree are opting for a mid-career switch and a majority of them are opting for the data science domain by pursuing a Data Science course. So, what’s pushing them towards DS? Let’s investigate.

What’s causing the career switch?

No matter which field someone has chosen for career, achieving stability is a common goal. However, in many fields be it engineering, or, something else the job opportunities are not unlimited yet the number of job seekers is growing every year. So, thereby one can expect to face a stiff competition grabbing a well-paid job.

There have been many layoffs in recent times especially due to the unprecedented situation the world is going through. Even before that there were reports of job cuts and certain sectors not doing well would directly impact the career of thousands. Even if we do not concentrate on the extremes, the growth prospect in most places could be limited and achieving the desired salary or, promotion oftentimes becomes impossible. This leads to not only frustration but uncertainty as well.

The demand for big data

If you haven’t been living as a hermit, then you are aware of the data explosion that impacted nearly every industry. The moment everyone understood the power of big data they started investing in research and in building a system that can handle, store and process data which is a storehouse of information. Now, who is going to process data to extract the information? And here comes the new breed of data experts, namely the data scientists, who have mastered the technology having undergone Data Science training and are able to develop models and parse through data to deliver the insights companies are looking for to make informed decisions. The data trend is pushing the boundaries and as cutting edge technologies like AI, machine learning are percolating every aspect of the industries, the demand for avant-garde courses like natural language processing course in gurgaon, is skyrocketing.

Lack of trained industry ready data science professionals

Although big data has started trending as businesses started gathering data from multiple sources, there are not many professionals available to handle the data. The trend is only gaining momentum and if you just check the top job portals such as Glassdoor, Indeed and go through the ads seeking data scientists you would immediately know how far the field has traveled. With more and more industries turning to big data, the demand for qualified data scientists is shooting up.

Why data science is being chosen as the best option?

In the 21st century data science is a field which has plethora of opportunities for the right people and this is one field which is not only growing now but is also poised to grow in future as well. The data scientist is one of the most highest paid professional in today’s job market. According to the U.S. Bureau of Labor Statistics report by the year 2026 there is a possibility of creation of 11.5 million jobs in this field.

Now take a look at the Indian context, from agriculture to aviation the demand for data scientists would continue to grow as there is a severe shortage of professionals. As per a report the salary of a data scientist could hover around ₹1,052K per annum and remember the field is growing which means there is not going to be a dearth of job opportunities or, lucrative pay packages.

Data Science Machine Learning Certification

The shift

Considering all of these factors there has been a conscious shift in the mindset of the professionals, who are indeed making a beeline for institutes that offer data science certification. By doing so they hope to-

  • Access promising career opportunities
  • Achieve job satisfaction and financial stability
  • Earn more while enjoying job security
  • Work across industries and also be recruited by industry biggies
  • Gain valuable experience to be in demand for the rest of their career
  • Be a part of a domain that promises innovation and evolution instead of stagnation

Keeping in mind the growing demand for professionals and the dearth of trained personnel, premier institutes like DexLab Analytics have designed courses that are aimed to build industry-ready professionals. The best thing about such courses is that you can hail from any academic background, here you will be taught from scratch so that you can grasp the fundamentals before moving on to sophisticated modules.

Along with providing data science certification training, they also offer cutting edge courses  such as, artificial intelligence certification in delhi ncr, Machine Learning training gurgaon. Such courses enable the professionals enhance their skillset to make their mark in a world which is being dominated by big data and AI.  The faculty consists of skilled professionals who are armed with industry knowledge and hence are in a better position to shape students as per industry demands and standards.

The mid-career switch is happening and will continue to happen. There must be professionals who have the expertise to drive an organization towards the future by unlocking their data secrets. However, something must be kept in mind if you are considering a switch, you need to be ready to meet challenges,  along with knowledge of Python for data science training, you need to have a vision, a hunger and a love for data to be a successful data scientist.


.

Object Detection And Its Applications

Object Detection And Its Applications

When we take a look at a video or, a bunch of images we know what’s what just by taking one look, it is our innate ability that gradually developed. Well, sophisticated technologies such as object detection can do that too. It might sound futuristic but it is happening now in reality. Object detection is a technique of the AI subset computer vision that is concerned with identifying objects and defining those by placing into distinct categories such as humans, cars, animals etc.

It combines machine learning and deep learning to enable machines to identify different objects. However, image recognition and object detection these terms are often used interchangeably but, both techniques are different. Object detection could detect multiple objects in an image or, in a video. The demand for trained experts in this field is pretty high and having a background in deep learning for computer vision with python can help one build a dream career.

Object detection has found applications across industries. Let’s take a look at some of these applications.

Tracking objects

It is needless to point out that in the field of security and surveillance object detection would play an even more important role. With object tracking it would be easier to track a person in a video. Object tracking could also be used in tracking the motion of a ball during a match. In the field of traffic monitoring too object tracking plays a crucial role.

Counting the crowd

Crowd counting or people counting is another significant application of object detection. During a big festival, or, in a crowded mall this application comes in handy as it helps in dissecting the crowd and measure different groups.

Self-driving cars

Another unique application of object detection technique is definitely self-driving cars.  A self-driving car can only navigate through a street safely if it could detect all the objects such as people, other cars, road signs on the road, in order to decide what action to take.

Detecting a vehicle

In a road full of speeding vehicles object detection can help in a big way by tracking a particular vehicle and even its number plate. So, if a car gets into an accident or, breaks traffic rules then it is easier to detect that particular car using object detection model and thereby decreasing the rate of crime while enhancing security.

Data Science Machine Learning Certification

Detecting anomaly

Another useful application of object detection is definitely spotting an anomaly and it has industry specific usages.  For instance, in the field of agriculture object detection helps in identifying infected crops and thereby helps the farmers take measures accordingly.  It could also help identify skin problems in healthcare.  In the manufacturing industry the object detection technique can help in detecting problematic parts really fast and thereby allow the company to take the right step.

Object detection technology has the potential to transform our world in multiple ways. However, the models still need to be developed further so that these can be applied across devices and platforms in real-time to offer cutting-edge solutions. Pursuing a Python Certification course can help develop the required skills needed for making a career in the field of machine learning.


.

Regular Expression in Python Part III: Learn To Substitute With Re

Regular Expression in Python Part III: Learn To Substitute With Re

This is the 3rd part of the ongoing Regex or, regular expression in Python series where we are discussing how to handle textual data. In the second part we introduced you to the re library and in this third segment, we are going to be discussing how to substitute characters or, words with re library.

Re library has a wide range of methods to deal with textual data, one such method is .sub() which helps us substitute alphabets or words based on the patterns we build. This method can be used with .match() method and .search() method, both having differences in the way they extract a pattern.

Difference between .match() & .search()

.match() :- This method extracts the required text only at the begging.

.search() :-This can extract the required string from the entire text but only at the first occurrence

In the above code you can see that even though the word “Hello” is in the middle of the text we are able to fetch it because of the special attribute of the .search() method. Here we are again using “Hello dexlab…!” as an example and .compile() is being used to create and apply our pattern.

Now suppose if we want to substitute the word “Hello” with another string “Hi” we will have to use .sub() method from the re library. But there are ways to use this method directly or indirectly.

 First let’s see the direct method.

In the above line of code we first mention what we want to substitute and with what and then we add the text.

Second way to do this is by first using .compile() method to build the pattern and then use that pattern to substitute the alphabet or word.

The above pattern in the .complie() method states that there is a word with the first alphabet in uppercase combined with lowercase alphabets to be substituted with the word “Hi”. This pattern can match any string with the same characteristics, for example:-

Look at the text used in the .sub() method, now instead of “Hello” we have “Pello” with the same characteristics substituted with the word “Hi”. But one must not forget this pattern can also be used in the .sub() method directly and the use of .compile() method is optional. .compile() method is used only to create an object based code.

So, this wraps up the discussion on how to substitute characters or, words with re library. Hopefully, you found this blog informative, if you wish to find more Python Certification course topics, keep following the Dexlab Analytics blog.


.

Regular Expression in Python Part II: Using re library for textual data

Regex Series Part-II: Using Re Library For Textual Data

This is the second part of the Regex series, where we will be continuing on by introducing you to another library in python, the re library. The previous blog introduced you to the Regex library in Python, and you learned about meta-characters and literals which could be used for creating patterns. This particular segment is about introducing the re library to help you with textual data analysis.

Re library in python holds the key to deal with all the problems relating to textual data analysis. This library provides a range of methods that can help you build patterns and extract or substitute the desired string. For example, suppose you want to change all the negative words to positive in a novel, for that all you need to have is a soft copy of the same and then you can import the re library and use its predefined methods first to make a pattern to extract the words and then substitute it to make the required changes.

Here one such method which we are going to use today from the re library is .compile() combined with .match() method to build and extract the pattern with the help of literals and meta-characters explained in the previous blog.

.compile() and .match() Methods

.complie() is used to build the pattern. You can use the meta-characters and literals within the parenthesis to build the pattern of the word which you want to extract or change. This is practically the first step without which not much can be done in re library. But why do we need a pattern and what is it that makes it necessary? To answer this question I am going to use few steps:-

  1. First thing to do is to observe the word or the string and see what is it that makes that specific word or words which you want to extract different from the rest of the text i.e. is the word a combination of digit or alphabet or special character, is there a special character before and after the word etc.
  2. Now recall all the meta-characters we have studied so far.
  3. Combine them with the .complie() method which basically helps us bring the meta-characters together.
  4. Now all there is left for us to do is apply the pattern on the text.

Therefore knowledge of meta-characters is necessary to form patterns to manipulate your textual data.

Now let’s see how to import re library and practically solve few of the Regex questions.

Use the above code to import the Regex library.

Question 1: How to make a pattern to extract the entire string “Hello dexlab…!!”?

In the above code we are using a combination of. (period)and * where

  • . (period) means match alpha-numeric or special character
  • * means match anything zero or more times

When combined together this means that you can match alpha-numeric or special characters zero or more times. Therefore the end result is:-

.match()method has a special property that it can match anything only at the beginning of the line. Suppose I want to extract “Hello” from a string, .match()method will only work when word is at the 0 index.

Question: How to extract and match only special characters?

The above code is matching only the space which is at the 0th index but not all the simultaneous special characters. To make a pattern that can match all the special characters we can use *

You can try ? and + to check the difference it makes on the output.

Question: How to extract numbers and special characters?

Now you must be wondering why the above code did not recognize the special characters after the numbers like @ and space. Here you must remember that the output you get is based on the pattern you make. In the above code we mentioned nothing that matches anything after the numbers. So we further need to expand our line of codes.

Question: How to extract only the output?

You can use the slice operator [] to extract only the text by using 0 index.

You must have picked up the fundamentals of the re library from the blog, watch the video attached below to follow the tutorial step by step. Follow the Regex series to gain expertise in textual data handling. Dexlab Analytics blog has more interesting and informative posts on Python Programming training.


.

Regular Expression in Python Part I: Introducing Regex Library

Regular Expression in Python Part I: Introducing Regex Library

Python is a versatile programming language and it has a rich library. In the visualization series we introduced you to different libraries used for data visualization purposes. Now, we introduce you to the Regex library in Python for handling textual data.

In Python to perform pattern recognition on textual data Regex is a library that provides a range of methods which when used with right pattern gives us the desired results. For example, if you want to change the spelling of colour to color in your text you can easily do so with the help of a given method provided that you form the pattern correctly.

Type of textual data in Regex

Literals:- In Python literals are the characters or words with their original meaning intact like the word dog means a literal dog and there is no hidden meaning behind that word.

Meta-characters:- These are the words or characters which hold special meaning for example \n means a new line or \t means tab separated values.

Given below are few of the meta-characters used in python with their meanings:-

\d – Matches a digit .i.e. \d= 1 ,\d\d= 23, \d\d\d = 345

\w – Matches alpha-numeric characters i.e. \w= 1, \w= a, \w\w= a1

\W– Matches special characters i.e. \W= %

Dog[ogn]– Matches a single character within the square bracketsi.e. Dogo, Dogg, Dogn

Dog(ogn) – Matches the entire string within the parenthesisi.e. Dogogn

Dog(ogn|aaa)– Matches either ogn or aaa i.e. Dogogn or Dogaaa

*– Matches 0 or more characters i.e. tre* = tree, tre*= tr, tre*= treeeeee

?– Matches 0 or 1 character i.e. colou?r= color, colou?r= colour

+ – Matches 1 or more character i.e. tre+= tree, tre+= treee, tre+≠tre

. – Matches alpha-numeric or special characters but only one time i.e. tre.= tree, tre.= tre#, tre.=tre1, tre.≠tre#1

The above meta-characters alone or in combination are used to form a pattern  which then are used for text mining for example tre.* means match anything 0 or more times that means now we can match tre#1 or tre.

Watch the video tutorial attached below to learn more about the fundamentals of this library. 

Hopefully you found the discussion on Regex library helpful and at the end of it you must have become familiar with the way this particular library works. To learn more about python for data analysis, keep on exploring Dexlab Analytics blog, where you will always find informative posts.


.

Visualization with Python Part-V: Introducing the Pandas_bokeh library

Visualization with Python Part-V: Introducing the Pandas_bokeh library

In our fifth installment of the visualization series using Python programming language, we introduce you to another powerful library in Python that is the Pandas_bokeh library. So, let’s find out what you can achieve with Pandas_bokeh library.

Pandas_bokeh is a library which can help you create interactive graphs in python. One can zoom in, zoom out, select a certain portion of the graph to see, move the plot left, right and center, create tabs in case they want to see a single plot at a time, create multiple plots at a time, create widgets like dropdown list, check boxes, radio buttons, slider etc. It is similar to the shiny app which is used in the r programming language  but simpler and faster.

How to install pandas_bokeh?

In the above code we are changing our jupyter notebook code cell into a command line by using ! and then we can use pip (python installation package) to install the library.

How to create a simple line plot using pandas_bokeh ?

The first thing to do is import the libraries which we will be using to create a line plot.

  • We will be creating our own dataset here and for that we need to import Numpy and Pandas libraries. Also we will be importing .figure() method from plotting module to create our canvas on which we will be building our graph from the scratch and we will also be importing .output_notebook() method to visualize our graph on jupyter notebook and to visualize our graph on a new tab and save at the same time we can use .output_file() method.
  • The Dataset we are creating here will have three columns ‘Days’, ‘Sales’ and ‘Date’.
  • We will be creating a dataset with hundred observations in each column so for that we are using .rand() method to generate hundred random numbers and that will be our ‘Sales’ column data. Now for our ‘Days’ column we will be creating a loop which will run hundred times and each time an array index value will be saved in a variable c which has an empty string and .split() method is then used to create a list of that string.
  • For creating a ‘Date’ column we will be using the following code

  • At last create a data frame we will be using .DataFrame() method.

  • Now to create two line graphs on a single canvas we will be using object-oriented programming.

  • To build the graph on the jupyter notebook we are using .output_notebook() method and in case you want to plot the graph on a new tab you can use .output_file(“filename.html”) method.

In the above line of codes we are creating two separate data frames df_d and df_d1 each containing Monday and Friday’s sales and dates separately now all we need to do is build a canvas using .figure() method and use few other arguments like x_axis_type to define the data type of the x axis and x_axis_label and y_axis_label to set graph labels, to adjust width and height of the canvas we have used plot_width and plot_height argument and to set title and title location we have used title and title_location. Once we have our canvas ready we can use .line() method and add x axis and y axis data to plot our graphs.

  • To interact with your graph you can use the icons on the right hand side corner which will help you zoom in and out, look at a certain part of the graph, scroll to zoom in and out, save your plot and reset the changes made by you using the side icons.

The video tutorial attached below will help you gain better understanding. 

At the end of this segment you must have become familiar with the nuances of the Pandas_bokeh library. As you continue on with the series, you will realize that you are becoming an expert in visualization. On Dexlab Analytics blog, you will find interesting blogs on various topics related to Python certification training.


.

Visualization with Python Part IV: Learn To Create A Box Plot Using Seaborn Library

Visualization with Python Part-IV: Learn To Create A Box Plot Using Seaborn Library

This is the 4th part of the series on visualization using Python programming language, where we will continue our discussion on the Seaborn library. Now that you have become familiar with the basics of the Seaborn library, you will be learning specific skills such as learning to create a box plot using Seaborn. So, let’s begin.

Seaborn library offers a list of pre-defined methods to create semi-flexible plots in Python and one of them is. boxplot() method. But what is a box plot?

Answer:- A box plot often known as box and whisker plot is a graph created to visualize the distribution of numerical data and skewness through displaying the data quartiles (or percentiles) and median.

Creating a box plot

Let’s begin by importing the Seaborn and Matplotlib library.

We will again be using the tips dataset which is a pre-defined dataset in Seaborn

Data description:- This is a dataset of a restaurant which keeps a record of the amount of bill paid by a customer, tip amount over the total bill paid, gender of the customer, whether he or she was a smoker or not, the day on which they ate at the restaurant, what was the time when they ate at the restaurant and the size of the table they booked.

To create a box plot we will be using .boxplot() method.

On the x axis we have day column having categorical data type and on the y axis we have total_bill column having numerical data type. Thus for each day with the help of a box plot we will  be able to visualize how the total_bill changes around its median value.

To add title to the graph we can use. title() method from the Matplotlib library

To add color to your graph you can use palette argument

We are adding a list of palette colors in this blog down below:-

You can replace the color mentioned in the above code to see which color variations you would prefer in your graph. For example

Here we are using color palette ‘CMRmap’ to change my graph color from different shades of blues to a completely different color range i.e. from blues to orange, violet, pale yellow etc.

This tutorial hopefully, has clarified the concept and you can now create boxplots with Seaborn. Since this is a series you need to keep track of all the parts to be a visualization expert as we take you through the process step by step. Follow the Dexlab Analytics blog to access more informative posts on different topics including python for data analysis.

Go through the video tutorial attached below to get more in-depth knowledge.


.

Call us to know more