python for data analysis Archives - Page 4 of 5 - DexLab Analytics | Big Data Hadoop SAS R Analytics Predictive Modeling & Excel VBA

R Vs Python: A Debate Forever

R Vs Python: A Debate Forever

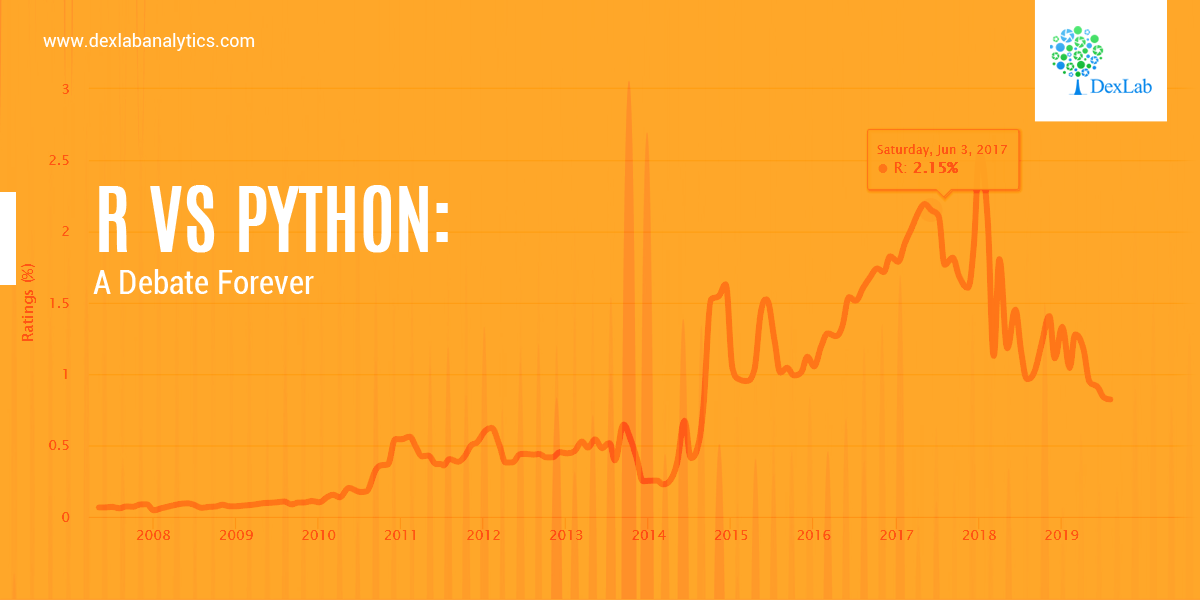
In this blog, we will bring forth the age old question and check which one is better, R programming and Python programming, when it comes to data science?

To be very honest, this question does not have a strict answer to it. However, in this blog we will lay down the key components of both the languages to give you a clearer picture. In the end, please decide for yourself and leave your comments in the section below.

The aim of this blog is to objectively put forward the pros and cons of both languages strictly from the perspective of data science.

We will discuss only about three main components, which are as follows:

  • Syntax
  • Performance
  • Applicability

There are other metrics, such as, trends in Industries and adaptation in the recent years which are beyond the scope of this blog. However, you can safely declare Python as the clear winner if those perspectives were concerned.

So let’s get started:

Syntax

Both R and Python are object-oriented languages. This is to say that everything is created as an object in which the information is mapped with the idea of using that object later in the analysis. However, when it comes to the syntax, i.e., the grammar of programming, R and Python are indeed very different.
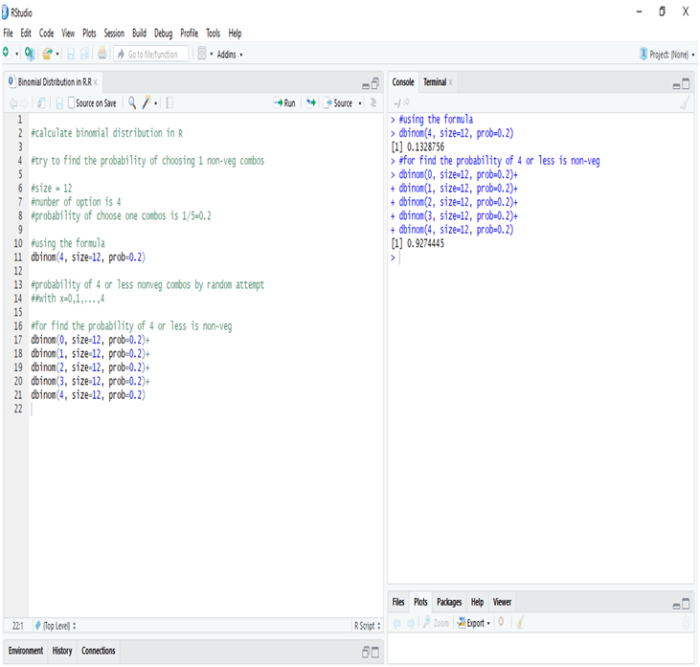
R Programming

R programing is more suited to more seasoned coders who have prior experience of coding. The syntax is actually very similar to that of the previous languages, such as C, or C++ or Java and so on. The fundamental rules are that of C programming language. Also, use of semicolons is deemed optional in R. However, semicolons are necessary for multiple lines in a code inside a code block.
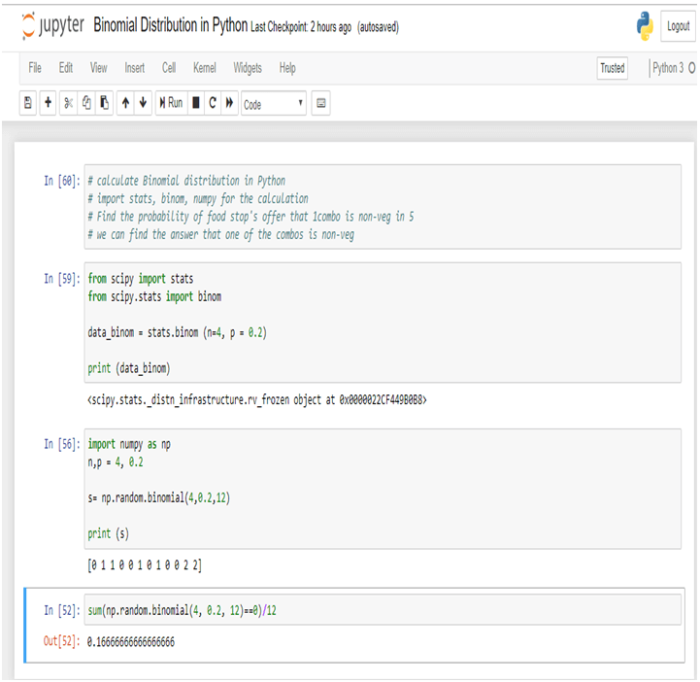
Deep Learning and AI using Python

Python

Python on the other hand, is the language more adaptable to the new generation of programmers. You can come from a non-programming background and still learn Python with relative ease.

Python is one of the most user friendly languages for the beginners. The syntax is designed to prioritize readability over preciseness of the code. In layman’s terms – coding in Python is very close to reading and writing with hand. In this regard, it is really popular amongst beginners in Data Science.

Performance

The performance is essentially measured by speed essentially when it comes to programming.

R Programming

As far as the general consensus goes R programming is much slower in terms of speed. The reason behind this is that R programming was initially designed to be used by statisticians for data analysis. Thus, R programming stresses more on precision than the speed.

Python

Python on the other hand, is relatively faster than R. Python offers the same level of precision whilst acting on a faster speed.

Note – The speed is taken into account independent of packages and libraries.

Applicability

Lastly, we will discuss the popular domains in which these languages are used.

2

R Programming

As mentioned above, R was developed specifically for statisticians. For this reason, R is mainly used in various research organizations and academia in general. However, R is now quickly being absorbed in the enterprises as well, mainly because of its popularity and the availability of a large number of packages for statistical computation.

Python

Python is a gene

As Python is a general-purpose programming language we can use to build different kinds of applications. We can use Python to build web applications using popular frameworks like Django or Flask.

Lately, Python is becoming popular amongst data scientists as the language of choice given the simplicity of syntax, high speed and performance it has to offer. There has been a trend which has seen a sharp rise in the adaptability of Python over R in the last few years in Data Science.

So, there you have it folks. Decide for yourself now! We will meet you soon in the next blog.

Dexlab Analytics is a pioneering institute of Data Science and Big Data Analytics with all-inclusive Big data courses in Delhi along with numerous other efficacious courses like Hadoop certification in Delhi, R programming courses in Gurgaon and Python for Data Analysis under experienced trainers and professionals.


Interested in a career in Data Analyst?

To learn more about Data Analyst with Advanced excel course – Enrol Now.
To learn more about Data Analyst with R Course – Enrol Now.
To learn more about Big Data Course – Enrol Now.

To learn more about Machine Learning Using Python and Spark – Enrol Now.
To learn more about Data Analyst with SAS Course – Enrol Now.
To learn more about Data Analyst with Apache Spark Course – Enrol Now.
To learn more about Data Analyst with Market Risk Analytics and Modelling Course – Enrol Now.

Statistical Application in R & Python: Poisson Distribution

Statistical Application in R & Python: Poisson Distribution

Continuing with the series of blogs, the first of which was Statistical Application In R & Python: Normal Probability Distribution, here we bring you a post on how you can calculate Poisson distribution effortless using R & Python. So, stay tuned!

Poisson distribution is a counting process which is a discrete probabilistic model. It has only one parameter, (lambda or “m”) which is essentially the average rate of change. Poisson distribution is used to model “number of anything”. The probability distribution function of a Poisson distribution is given by the below expression.

If m is the mean occurrence per interval, then the probability of having x occurrence with in a given interval is:

Application:

A business firm receives on an average 6.5 telephone calls per day during the time period 11:00 – 11:15 A.M., Find the probability that on a certain day, the firm receives exactly9 calls during the same period.

The random variable x is the ‘number of telephone calls received during the period 11:00 – 11:15 A.M, since x is assumed to Poisson distribution. The parameter m is equal to the mean of the distribution; i.e.  m = 6.5 and x = 9, then the equation is:

Calculate Poisson Distribution in R:

So, while calculating Poisson distribution in R, we notice that the probability of occurring exactly 9 calls instead of average 6.5 calls in a given particular time (11:00 A.M – 11:15 A.M ) = 85.81%

Calculate Poisson Distribution in Python:

So, while we calculate Poisson distribution in Python, we notice that the probability of occurring exactly 9 calls instead of average 6.5 calls in a given particular time (11:00 A.M – 11:15 A.M) = 85.81%

Conclusion:

Companies can use the Poisson distribution to contrive effective steps to improve their operational efficiency. For instance, an analysis done with the Poisson distribution might reveal how a company can arrange staffing in order to be able to handle the peak periods efficiently, when the customer service calls keep on pouring.

In this problem we see that the business firm receives on an average 6.5 telephone calls per day during the time period 11:00A.M – 11:15A.M, then the probability of the firm receives exactly 9 calls in a same is 85.81%.

Dexlab Analytics is the best Python training institute in Delhi, bringing you the all-inclusive courses of Python for Data Analysis and R Predictive Modelling Certification, among others to start your career in Data Science and Analytics.


Interested in a career in Data Analyst?

To learn more about Data Analyst with Advanced excel course – Enrol Now.
To learn more about Data Analyst with R Course – Enrol Now.
To learn more about Big Data Course – Enrol Now.

To learn more about Machine Learning Using Python and Spark – Enrol Now.
To learn more about Data Analyst with SAS Course – Enrol Now.
To learn more about Data Analyst with Apache Spark Course – Enrol Now.
To learn more about Data Analyst with Market Risk Analytics and Modelling Course – Enrol Now.

Statistical Application in R & Python: Normal Probability Distribution

Statistical Application in R & Python: Normal Probability Distribution

Gauss, the famous French Mathematician is responsible for developing one of the most significant distributions in all of statistics, i.e. – The Normal Distribution. Please refer to the blog on Central Limit Theorem: www.dexlabanalytics.com/blog/the-almighty-central-limit-theorem. It will help you fully grasp the significance of the Normal Distribution. However, if you want to revisit our series of blogs by following it from the start, you can reach STATISTICAL APPLICATION IN R & PYTHON: CHAPTER 1 – MEASURE OF CENTRAL TENDENCY right now!

Essentially, the Normal Distribution provides “approximations” to most other distributions such as the Binomial, Poisson, Gamma, Exponential, etc. This is to say as sample sizes get statistically large enough, most distributions approximate into a normal shaped curve.

Every distribution has important features known as its “parameters”. Normal distribution has two parameters. These are Mean ( ) and Variance (σ²). The normal distribution has a bell-shaped curve, where the probability of likelihood peaks at its mean in the middle.

The Normal Distribution has vast practical applications in the field of Business, Finance, Medicine, and Physics and so on. Things like weights, heights, IQ scores follow the Normal Distribution.

Normal Distribution, Gaussian distribution, is a continuous probability distribution and is defined by the Probability Density Function (PDF).

Where,

Application:

Assume that the credit score fits a Normal Distribution.

Suppose Mr. Arjun’s last 10 month’s credit score are:

789, 635, 739, 687, 724, 810, 817, 735, 819, 820

What is the probability that the percentage of credit score will 825 or more in the 11th month?

Months

Credit Score

January

789

February

635

March

739

April

687

May

724

June

810

July

817

August

735

September

819

October

820


Calculating Normal Distribution in R:

If we go to calculate Normal Probability Distribution in R, we can predict that the probability of the 11th month credit score will be 825 or greater than that is 14.60%, whereas in another case, the probability of the 11th month credit score will be 825 or less than that is 85.40%.

Calculate Normal Distribution in Python:

Make a data frame of the data and calculate Mean and Standard Deviation for calculate Normal Distribution.

Now, we can easily calculate Normal Distribution in Python

So, in calculating the Normal Probability Distribution in Python, we can predict that the probability of the 11th month credit score will be 825 or greater than that is 14.60%, whereas in another case, the probability of the 11th month credit score will be 825 or less than that is 85.40%.

Conclusion:

Normal Distribution is used for calculating parameters. It is represented by the bell curve, where the total area of the curve is 1. Normal Distribution has its use in Finance, Business, Salaries, Blood Pressures, Measurement etc and many other fields.

Here, we have used Normal Distribution to predict Mr. Arjun’s 11th month credit score, and set the target (825). By Normal Distribution we can predict the percentage of possibility to achieve the target.

Calculating Binomial Distribution might be tricky for many but with Dexlab Analytics it won’t be hassle anymore. So, get hold of our STATISTICAL APPLICATION IN R AND PYTHON: CALCULATING BINOMIAL DISTRIBUTION blog, to get around all your problems.


Interested in a career in Data Analyst?

To learn more about Data Analyst with Advanced excel course – Enrol Now.
To learn more about Data Analyst with R Course – Enrol Now.
To learn more about Big Data Course – Enrol Now.

To learn more about Machine Learning Using Python and Spark – Enrol Now.
To learn more about Data Analyst with SAS Course – Enrol Now.
To learn more about Data Analyst with Apache Spark Course – Enrol Now.
To learn more about Data Analyst with Market Risk Analytics and Modelling Course – Enrol Now.

Retail 4.0: How Trending Technologies Are Influencing the Retail Industry?

Retail 4.0: How Trending Technologies Are Influencing the Retail Industry?

The retail industry is undergoing unprecedented changes: courtesy Retail 4.0! It is the term used to denote the transformation that’s taking place at a rapid pace. Technological advancements and customer expectation are key driving factors behind the evolution.

Customers are the bedrock of the retail industry. They are fickle and demanding. With higher spending power and low brand loyalty, they are redefining the consumer trends and forcing retailers to harness the power of big data to ensure a seamless, positive customer experience coupled more secure payment methods and easier online store formats.

2

Data is Power

For years, retailers have been working on consumer’s behavior and how to serve them well. Today, amidst increasing competition, data explosion and advanced technological implementations, they seem to lose their erstwhile charm. Data is the answer. In a digital-enabled landscape, retail industry players need to leverage several emerging technologies, such as augmented reality, virtual reality, mixed reality, AI and Internet of Things and draw clear actionable insights.

Gone are the days when retailers relied on their instincts and formulated marketing strategies. Today, predictive analytics is used to boost informed decision-making and conclude the future success of an enterprise. Put simply, retail analytics using Python is the tool to drive optimization, follow corrective measures and reduce revenue leakage. With data at the forefront, retail analytics and its diverse platforms are providing customers with relevant products, superior service and the facility to experience the products even before purchase.

How Does It Work?

Retail analytics targets customer acquisition and focuses on customer study. Through data analysis, the retailers ascertain buying patterns and curated customer engagement strategies. For that, deep insights are generated based on their search criteria, purchase records and frequency of shopping.

Also, retailers can now predict demand precisely. Based on a customer’s historical data, they anticipate when he/she is likely to make a purchase decision and within what duration of time. They can also predict the products the customers are going to re-purchase with the help of AI. Robust machine learning algorithms deliver insights that specify accurate customer recommendations, which help increase retailers’ profit margin.

Deep Learning and AI using Python

Understanding the nuances of consumer behavior is of utmost importance. This is why IoT and AI are combined and used in monitoring customer-store interactions – resulting in better service engagements and higher revenue. Social media has added to the effect. Extracting user information from social media platforms has become a piece of cake. Retail market players can now leverage the social media data, influence customer purchase decisions and enjoy a certain edge against the tailing rivals.

As endnotes, retailers need to embrace the digital transformation and create fresh, enhanced experiences to entice the consumers. After all, the future belongs to the data-inspired companies. So, just stay ahead of the curve using data as the power tool.


Interested in a career in Data Analyst?

To learn more about Data Analyst with Advanced excel course – Enrol Now.
To learn more about Data Analyst with R Course – Enrol Now.
To learn more about Big Data Course – Enrol Now.

To learn more about Machine Learning Using Python and Spark – Enrol Now.
To learn more about Data Analyst with SAS Course – Enrol Now.
To learn more about Data Analyst with Apache Spark Course – Enrol Now.
To learn more about Data Analyst with Market Risk Analytics and Modelling Course – Enrol Now.

Python vs. Scala: Which is Better for Data Analytics?

Python vs. Scala: Which is Better for Data Analytics?

Data Science and Analytics seem to be synonymous to progress as far as the field of computer science is concerned. Now, with the rise of these technologies, everything goes down to the programming languages, which single-handedly help in the growth of them. 

This gave rise to Python, now known as the most significant language in the world of technology. Scala is another versatile language which is not unknown to the researchers and tech geeks. These two languages are the most talked about in the industry today. Nevertheless, both of them are extensively used in data analytics and data science. However, the debate regarding which one to opt for among the two has always been constant. But worry no longer because here we will discuss both of them, in brief, to help you with your choice!

Deep Learning and AI using Python

Python

Python is really one of the most popular languages in the industry. The open-source nature of the language makes it a popular choice for scripting and automation works. 

Besides, Python is powerful, effective, and easy to learn. Moreover, Neural Network Machine learning Python boasts of its efficient high-level data structures and for object-oriented programming.

Advantages

  • Easy to learn and effective too.
  • Exhaustive support from active communities.
  • Python enjoys built-in support for the datatypes.

Disadvantages

  • Your computer might slow down a little when you are running Python. This is in contrast to when you are running other languages like C or Java.

Scala

If you want an object-oriented, functional programming language, then Scala would certainly be your first choice. It was basically built for the Java Virtual Machine (JVM) and remains the most compatible programming language with Java code till date.

Advantages

  • Scala can utilise the majority of the JVM libraries, thus helping them to be embedded in the enterprise code.
  • It shares an array of readable syntax features of the popular languages, like Ruby.
  • Scala brags about numerous incredible features like string comparison advancements, pattern matching and its likes.

2

Disadvantages

  • Scala has a limited number of users in the communities, which encourages lesser interactions and stunted growth.
  • At times the type-information in Scala is really complex to comprehend. This difficulty can be attributed to the functional and object-oriented nature of the language.

We hope that this article helps you to have a brief insight into two of the most demanding programming languages: Python and Scala.

Now, if you want to enrol yourself in Computer vision course Python, you can reach us right at Dexlab Analytics, the most reputable institute for Big Data Analytics. Also, if you are looking for all-inclusive Deep learning for computer vision Course, turn no further than our premium institute to shoot your career up!


Interested in a career in Data Analyst?

To learn more about Data Analyst with Advanced excel course – Enrol Now.
To learn more about Data Analyst with R Course – Enrol Now.
To learn more about Big Data Course – Enrol Now.

To learn more about Machine Learning Using Python and Spark – Enrol Now.
To learn more about Data Analyst with SAS Course – Enrol Now.
To learn more about Data Analyst with Apache Spark Course – Enrol Now.
To learn more about Data Analyst with Market Risk Analytics and Modelling Course – Enrol Now.

Most Demanding Programming Languages for Machine Learning: A Knowhow

Most Demanding Programming Languages for Machine Learning: A Knowhow

Machine Learning is among a handful of technologies which we can see going on for long. It is a process or a technology which applies Artificial Intelligence (AI) to enable the machines/computers to learn things all by them and continue improving them subsequently.

Andrew Ng, a computer scientist from Stanford University, describes Machine Learning as the science which helps the computers to act without any explicit programming.

2

This new stream, as we are seeing it now, was originally conceived in the 1950s, however, it was not until the 21st century that Machine Learning started to revolutionise the world.

Several industries have already adopted this ground-breaking technology successfully to ensure the growth of their business. Moreover, this new technology has also boosted the demand for advanced programming languages, which were only rarely pursued earlier.

Here are some of the programming languages which seem quite promising with the rise of Machine Learning:

Python

This high-level programming language dates back to the early 1990s and has been widely popular since then, for Data Science, back-end development and Deep Learning for computer vision with Python. Python for data analysis is regarded as a powerful tool and is actively used in Big Data Technology.

R

R has been developed in the 1990s along with Python and was a part of the GNU project. Ever since it was discovered, R finds its uses extensively in Data Analysis, Machine Learning and the development of Artificial Intelligence. Furthermore, R is revered by the world of statisticians. 

Application to R and Python are effectively used to calculate the Arithmetic mean, Harmonic mean, Geometric Mean, Skewness & Kurtosis. Statistical Application Of R & Python: Know Skewness & Kurtosis And Calculate It Effortlessly shows you the way how.

Deep Learning and AI using Python

JavaScript, C++, Java are some other notable programming languages that are dominant. So, hurry up and join the exclusive computer vision course Python now. With Dexlab Analytics, a formidable institute in the Big Data Analytics industry, you can enroll for our tailor-made Artificial Intelligence course in Delhi with just a click from the comfort of your house.


Interested in a career in Data Analyst?

To learn more about Data Analyst with Advanced excel course – Enrol Now.
To learn more about Data Analyst with R Course – Enrol Now.
To learn more about Big Data Course – Enrol Now.

To learn more about Machine Learning Using Python and Spark – Enrol Now.
To learn more about Data Analyst with SAS Course – Enrol Now.
To learn more about Data Analyst with Apache Spark Course – Enrol Now.
To learn more about Data Analyst with Market Risk Analytics and Modelling Course – Enrol Now.

Straight Out of College? Grasp These Killer Data Science Skills

Straight Out of College? Grasp These Killer Data Science Skills

Data Science is one of the most demanding fields in the present world. Going hand in hand with the Artificial Intelligence, Data Science is showing a colossal growth in the coming years. So, honestly speaking, you should be prepared with all of the cutting-edge tools and up skill yourself accordingly to pace up with the modern world.

According to Derek Steer, CEO of Mode, the world will generate 50 times more data than what we were present in 2011. Moreover, with the data processing power becoming easy and inexpensive for most of the firms, candidates with real skill and a hunger for knowledge would only see their way through till the end, added Steer.

Among various other skills like retail analytics using Python, neural network machine learning Python, which are dominating and/or expected to rule the world of technology in the upcoming years, here we list you some of them:

2

Data Visualization

This is one of the top notch skills that you can find now. It is process of maintaining data with the help of graphical representations. This further makes the interpretation and thereby, the comprehension of data, much easier.

This is an extremely relevant skill which is not to be found among the high schoolers. This makes the undergraduates or post graduates with the knowhow of data visualisation all the more important everywhere.

Data Modelling

Data Modelling is the second most wanted skill that the entire world is seeking for. In a nutshell, Data Modelling is the process of understanding and using data to seek relationships across varied sets of information.

It is, in fact, a skill which is gaining an immense popularity among the fresh graduates. You can also reach Dexlab Analytics to gain an insight of all the industry relevant courses and enrol yourself asap to speed up your career!

Deep Learning and AI using Python

Python

Python is undoubtedly the most demanding language ever in the history of computer science; hence, it enjoys all the attention that it gets.

With its welcoming nature to every other architecture, which is in sharp contradiction to Java and C++, Python is preferred all the way. Secondly, Python is quite a powerful language and effective too, when it comes to bulk data and a need to process them faster.

It is basically an open source program which is easy accessible and largely customised. This is really a gift for upcoming world of Data Science. Thus, Python for data analysis is an invaluable skill that you can develop to make yourself marketable like never before.

We hope you liked our post! You can Take A Deep Look On How Machine Learning Boosts Business Growth! and more such topics on our website.


Interested in a career in Data Analyst?

To learn more about Data Analyst with Advanced excel course – Enrol Now.
To learn more about Data Analyst with R Course – Enrol Now.
To learn more about Big Data Course – Enrol Now.

To learn more about Machine Learning Using Python and Spark – Enrol Now.
To learn more about Data Analyst with SAS Course – Enrol Now.
To learn more about Data Analyst with Apache Spark Course – Enrol Now.
To learn more about Data Analyst with Market Risk Analytics and Modelling Course – Enrol Now.

Statistical Application in R and Python: Calculating Binomial Distribution

Statistical Application in R and Python: Calculating Binomial Distribution

In this blog, we will take a look at the Binomial distribution. This blog is among the series of blogs through which you’ll have a vivid idea of the Statistical Application using R and Python. Statistical Application In R & Python: Chapter 1 – Measure Of Central Tendency is the first of such blogs.

The binomial distribution is an extension of the Bernoulli distribution. In Bernoulli, we have only one parameter, i.e. the probability of success.

Now, consider a case where we have “n” number of trials and we want to predict the probability of success from it. This is the Binomial case.

Binomial distribution has two parameters, i.e.: number of trails (n) AND probability of success (p). The mean of the binomial is a product of its two parameters, i.e. n multiplied by p. It is a discrete probability distribution. Here, each trial is assumed to have only two outcomes, either success or failure.

If X be a discrete random variable (taking only non-negative values), it is said to be following binomial distributions with a probability mass function as:-


Application:

A food shop starts a offer for a festive season, They have 12 different baskets, each basket has 5 combos and only 1 of them is non-veg. Find the probability of having 4 or less non-veg combos, if a consumer tries every combos at random.

Since, only 1 out of 5 combos is non-veg, the probability of choose a non-veg combos by random is 1/5 = 0.2

Calculate Binomial Distribution in R:

In R the probability of one non-veg combos choose by random in 5 is 13.28%, whereas the probability of four or less combos choose by random in a twelve baskets is 92.44%

Calculate Binomial Distribution in Python:

In Python the probability of one non-veg combos choose by random in 5 is 16.66%.

Conclusion:-

Binomial Distribution is the process by which we can calculate the probability of success from “n” number of trails. In Binomial Distribution we can find only two outcomes like “Yes” or “No”.

Dexlab Analytics is a pioneering institute of Data Science, with peerless trainers to help you ease your journey with Python Certification, R Programming Certification and Big Data Certification along with numerous other advanced and/or career oriented courses in Computer Science.


Interested in a career in Data Analyst?

To learn more about Data Analyst with Advanced excel course – Enrol Now.
To learn more about Data Analyst with R Course – Enrol Now.
To learn more about Big Data Course – Enrol Now.

To learn more about Machine Learning Using Python and Spark – Enrol Now.
To learn more about Data Analyst with SAS Course – Enrol Now.
To learn more about Data Analyst with Apache Spark Course – Enrol Now.
To learn more about Data Analyst with Market Risk Analytics and Modelling Course – Enrol Now.

Hacking is Wide and Dangerous in India, CBI Reports

Hacking is Wide and Dangerous in India, CBI Reports

The recent conference organized by the Central Bureau of Investigation on Cyber forensic notes that over 22,000 websites were hacked in India between April 2017 – Jan 2018. Not the best of the news for the nation which is largely counting on their citizens to be tech-savvy.

In the conference, CBI disclosed of its plans to build a cutting edge Centralised Technology Vertical (CTV) to fight crimes, voiced by Minister of State for Personnel, Jitendra Singh. The CTV is a huge project involving around Rs 99 crore, which will not only share the real-time information about the cyber attacks but also of the perpetrators.

From young superintendents of police to top brass of security agencies, police forces, law enforcement officers and the Intelligence attended this conference and discussed about the alarming rise of cybercrimes throughout the country.

2

The Major Issue

Jurisdictional issues were a main problem and hit greatly on the investigation in these cases because most of the incidents of cybercrimes are triggered from foreign lands. Though the total loss of money from the recent cybercrimes weren’t disclosed, some debilitating cases in cybercrimes were dicussed once again, which included the loss of USD 171 million from union Bank of India’s Swift.

To End it

To lessen the magnitude of the cybercrimes, the CBI is on their way towards reinforcing them with the state of the art technology. Besides, you can also take up courses in PHP, HTML, Python Certification Training in Delhi, to be informed of the trending languages and be future proof.


Interested in a career in Data Analyst?

To learn more about Data Analyst with Advanced excel course – Enrol Now.
To learn more about Data Analyst with R Course – Enrol Now.
To learn more about Big Data Course – Enrol Now.

To learn more about Machine Learning Using Python and Spark – Enrol Now.
To learn more about Data Analyst with SAS Course – Enrol Now.
To learn more about Data Analyst with Apache Spark Course – Enrol Now.
To learn more about Data Analyst with Market Risk Analytics and Modelling Course – Enrol Now.

Call us to know more