python course in Gurgaon Archives - Page 5 of 9 - DexLab Analytics | Big Data Hadoop SAS R Analytics Predictive Modeling & Excel VBA

A Handbook of the Basic Data Types in Python 3: Strings

A Handbook of the Basic Data Types in Python 3: Strings

In general, a data type defines the format, sets the upper & lower bounds of the data so that a program could use it appropriately. Data types are the classification or categorization of data items which describes the character of a variable. The most used data types are numeric, non-numeric and Boolean (true/false).

Python has the following standard Data Types:

  • Booleans
  • Numbers
  • String
  • List
  • Tuple
  • Set
  • Dictionary

Mutable and Immutable Objects

Data objects of the above types are stored in a computer’s memory for processing. Some of these values can be modified during processing, but the contents of the others can’t be altered once they are created in the memory.

Number values, strings, and tuple are immutable, which means their contents can’t be altered after creation.

On the other hand, the collection of items in a List or Dictionary object can be modified. It is possible to add, delete, insert, and rearrange items in a list or dictionary. Hence, they are mutable objects.

Booleans

A Boolean is such a data type that almost every programming language has, and so does Python. Boolean in Python can have two values – True or False. These values can be used for assigning and comparison.

Numbers

Numbers are one of the most prominent Python data types. In Numbers, there are mainly 3 types which include Integer, Float, and Complex.

String

A sequence of one or more characters enclosed within either single quotes ‘or double quotes” is considered as String in Python. Any letter, a number or a symbol could be a part of the string. Multi-line strings can be represented using triple quotes,”’ or “””.

Data Science Machine Learning Certification

List

Python list is an array-like construct which stores a heterogeneous collection of items of varied data typed objects in an ordered sequence. It is very flexible and does not have a fixed size. The Index in a list begins with a zero in Python.

Tuple

A tuple is a sequence of Python objects separated by commas. Tuples are immutable, which means tuples once created cannot be modified. Tuples are defined using parentheses ().

Set

A set is an unordered collection of items. Set is defined by values separated by a comma inside braces { }. Amongst all the Python data types, the set is one which supports mathematical operations like union, intersection, symmetric difference etc. Since the set derives its implementation from the “Set” in mathematics, so it can’t have multiple occurrences of the same element.

Dictionary

A dictionary in Python is an unordered collection of key-value pairs. It’s a built-in mapping type in Python where keys map to values. These key-value pairs provide an intuitive way to store data. To retrieve the value we must know the key. In Python, dictionaries are defined within braces {}.

This article is about one specific data type, which is a string. The String is a sequence of characters enclosed in single (”) or double quotation (“”) marks.

Here are examples of creating strings in Python.

Counting Number of Characters Using LEN () Function

The LEN () built-in function counts the number of characters in the string.

Creating Empty Strings

Although variables S3 and S4 do not contain any characters they are still valid strings. S3 and S4 both represent empty strings here.

We can verify this fact by using the type () function.

String Concatenation

String concatenation means joining one or more strings together. To concatenate strings in Python we use + operator.

String Repetition Operator (*)

Just like in numbers, * operator can also be used with strings. When used with strings * operator repeats the string n number of times. Its general format is: 1 string * n,

where n is a number of type int.

Membership Operators – in and not in

The in or not in operators are used to check the existence of a string inside another string. For example:

Indexing in a String

In Python, characters in a string are stored in a sequence. We can access individual characters inside a string by using an index.

An index refers to the position of a character inside a string. In Python, strings are 0 indexed. This means that the first character is at index 0; the second character is at index 1 and so on. The index position of the last character is one less than the length of the string.

To access the individual characters inside a string we type the name of the variable, followed by the index number of the character inside the square brackets [].

Instead of manually counting the index position of the last character in the string, we can use the LEN () function to calculate the string and then subtract 1 from it to get the index position of the last character.

We can also use negative indexes. A negative index allows us to access characters from the end of the string. Negative index starts from -1, so the index position of the last character is -1, for the second last character it is -2 and so on.

Slicing Strings

String slicing allows us to get a slice of characters from the string. To get a slice of string we use the slicing operator. Its syntax is:

str_name[start_index:end_index]

str_name[start_index:end_index] returns a slice of string starting from index start_index to the end_index. The character at the end_index will not be included in the slice. If end_index is greater than the length of the string then the slice operator returns a slice of string starting from start_index to the end of the string. The start_index and end_index are optional. If start_index is not specified then slicing begins at the beginning of the string and if end_index is not specified then it goes on to the end of the string. For example:

Apart from these functionalities, there are so many built-in methods for strings which make the string as the useful data type of Python. Some of the common built-in methods are as follows: –

capitalize ()

Capitalizes the first letter of the string

join (seq)

Merges (concatenates) the string representations of elements in sequence seq into a string, with separator string.

lower ()

Converts all the letters in a string that are in uppercase to lowercase.

max (str)

Returns the max alphabetical character from the string str.

min (str)

Returns the min alphabetical character from the string str.

replace (old, new [, max])

Replaces all the occurrences of old in a string with new or at most max occurrences if max gave.

 split (str=””, num=string.count(str))

Splits string according to delimiter str (space if not provided) and returns list of substrings; split into at most num substrings if given.

upper()

Converts lowercase letters in a string to uppercase.

Conclusion

So in this article, firstly, we have seen a brief introduction of all the data types of python. Later in this article, we focused on the strings. We have seen several Python operations on strings as well as the most common useful built-in methods of strings.

Python is the language of the present age, wherein almost every field there is a need for Python. For example, Python for data analysisMachine Learning Using Python has been easy and comprehensible than they were ever before. Thus, if you are also interested in Python and looking for promising courses Computer Vision Course PythonRetail Analytics using PythonNeural Network Machine Learning Python, then get in touch with Dexlab Analytics now and step into the world of opportunities!


Interested in a career in Data Analyst?

To learn more about Data Analyst with Advanced excel course – Enrol Now.
To learn more about Data Analyst with R Course – Enrol Now.
To learn more about Big Data Course – Enrol Now.

To learn more about Machine Learning Using Python and Spark – Enrol Now.
To learn more about Data Analyst with SAS Course – Enrol Now.
To learn more about Data Analyst with Apache Spark Course – Enrol Now.
To learn more about Data Analyst with Market Risk Analytics and Modelling Course – Enrol Now.

Python Statistics Fundamentals: How to Describe Your Data? (Part II)

Python Statistics Fundamentals: How to Describe Your Data? (Part II)

In the first part of this article, we have seen how to describe and summarize datasets and how to calculate types of measures in descriptive statistics in Python. It’s possible to get descriptive statistics with pure Python code, but that’s rarely necessary.

Python is an advanced programming language extensively used in all of the latest technologies of Data Science, Deep Learning and Machine learning. Furthermore, it is particularly responsible for the growth of the Machine Learning course in IndiaMoreover, numerous courses like Deep Learning for Computer vision with Python, Text Mining with Python course and Retail Analytics using Python are pacing up with the call of the age. You must also be in line with the cutting-edge technologies by enrolling with the best Python training institute in Delhi now, not to regret it later.

In this part, we will see the Python statistics libraries which are comprehensive, popular, and widely used especially for this purpose. These libraries give users the necessary functionality when crunching data. Below are the major Python libraries that are used for working with data.

Data Science Machine Learning Certification

NumPy and SciPy – Fundamental Scientific Computing

NumPy stands for Numerical Python. The most powerful feature of NumPy is the n-dimensional array. This library also contains basic linear algebra functions, Fourier transforms, advanced random number capabilities. NumPy is much faster than the native Python code due to the vectorized implementation of its methods and the fact that many of its core routines are written in C (based on the CPython framework).

For example, let’s create a NumPy array and compute basic descriptive statistics like mean, median, standard deviation, quantiles, etc.

SciPy stands for Scientific Python, which is built on NumPy. NumPy arrays are used as the basic data structure by SciPy.

Scipy is one of the most useful libraries for a variety of high-level science and engineering modules like discrete Fourier transforms, Linear Algebra, Optimization and Sparse matrices. Specifically in statistical modelling, SciPy boasts of a large collection of fast, powerful, and flexible methods and classes. It can run popular statistical tests such as t-test, chi-square, Kolmogorov-Smirnov, Mann-Whitney rank test, Wilcoxon rank-sum, etc. It can also perform correlation computations, such as Pearson’s coefficient, ANOVA, Theil-Sen estimation, etc.

Pandas – Data Manipulation and Analysis

Pandas library is used for structured data operations and manipulations. It is extensively used for data preparation. The DataFrame() function in Pandas takes a list of values and outputs them in a table. Seeing data enumerated in a table gives a visual description of a data set and allows for the formulation of research questions on the data.

The describe() function outputs various descriptive statistics values, except for the variance. The variance is calculated using the var() function in Pandas.

The mean() function, returns the mean of the values for the requested axis.

Matplotlib – Plotting and Visualization

Matplotlib is a Python library for creating 2D plots. It is used for plotting a wide variety of graphs, starting from histograms to line plots to heat plots. One can use Pylab feature in IPython notebook (IPython notebook –pylab = inline) to use these plotting features inline. If the inline option is ignored, then pylab converts IPython environment to an environment, very similar to Matlab.

matplotlib.pylot is a collection of command style functions.

If a single list array is provided to the plot() command, matplotlib assumes it is a sequence of Y values and internally generates the X value for you.

Each function makes some change to a figure, like creating a figure, creating a plotting area in a figure, decorating the plot with labels, etc. Now, let us create a very simple plot for some given data, as shown below:

Scikit-learn – Machine Learning and Data Mining

Scikit-learn built on NumPy, SciPy and matplotlib. Scikit-learn is the most widely used Python library for classical machine learning. But, it is necessary to include it in the discussion of statistical modeling as many classical machine learning (i.e. non-deep learning) algorithms can be classified as statistical learning techniques. This library contains a lot of efficient tools for machine learning and statistical modeling including classification, regression, clustering and dimensional reduction.

Conclusion

In this article, we covered a set of Python open-source libraries that form the foundation of statistical modelling, analysis, and visualization. On the data side, these libraries work seamlessly with the other data analytics and data engineering platforms, such as Pandas and Spark (through PySpark). For advanced machine learning tasks (e.g. deep learning), NumPy knowledge is directly transferable and applicable in popular packages such as TensorFlow and PyTorch. On the visual side, libraries like Matplotlib, integrate nicely with advanced dashboarding libraries like Bokeh and Plotly.


https://pandas.pydata.org/pandas-docs/stable/reference/api/pandas.DataFrame.html


Interested in a career in Data Analyst?

To learn more about Data Analyst with Advanced excel course – Enrol Now.
To learn more about Data Analyst with R Course – Enrol Now.
To learn more about Big Data Course – Enrol Now.

To learn more about Machine Learning Using Python and Spark – Enrol Now.
To learn more about Data Analyst with SAS Course – Enrol Now.
To learn more about Data Analyst with Apache Spark Course – Enrol Now.
To learn more about Data Analyst with Market Risk Analytics and Modelling Course – Enrol Now.

Automation is to Highly Impact the Knowledge Workers

Automation is to Highly Impact the Knowledge Workers

Automation will mainly target the knowledge workers, who are highly paid and educated and involved in thinking and analytical jobs.

The robot revolution is anticipated for quite some time now and with the ongoing advancements in Machine Learning, Artificial Intelligence and Data Science, the future is near. However, it is also one of the most dreaded events for the workers going forward, who would be vulnerable to losing their respective jobs.

Going back to the 2017 McKinsey study, around 50% of the jobs in the manufacturing industries are automatable using the latest technology. However, according to the latest report, the white-collar workers, who are well-read and engaged in thinking and analytical jobs, are more likely to suffer the most.

According to a new study conducted by Michael Webb, Stanford University Economist, the powerful technologies of computer science like Artificial Intelligence and Machine Learning, which can make human-like decisions and grow using real-time data, will eventually target the white-collar workers. Artificial Intelligence has already made marked intrusions in the white-collar jobs, like telemarketing, which are primarily overseen by the bots. However, with the tireless efforts of the Data Scientists, along with the expansion of the Machine Learning course in India, it is believed to oust the majority of the knowledge workers, like chemical engineers, market researchers, market analysts, physicists, librarians and more.

Data Science Machine Learning Certification

The new research focuses on the intersecting subject-noun pairs in AI patents and job descriptions to find out the jobs that will be heavily affected by the Ai technology. For example, the job descriptions of market research analysts comprise of “data analysis”, “identifying markets” and “track market trends”, which are in fact, all covered by the AI patents that are existing. This new study looks far more progressive than the previous ones because it analyzes patents for the technology which are yet to develop completely.

With the rising trends of Data Science and Machine Learning, Artificial Intelligence has really come a long way from what an imaginary concept. Thus, courses like Machine Learning Using Python and Python for Data Analysis, are in heavy demands. 


This article has been sourced fromwww.vox.com/recode/2019/11/20/20964487/white-collar-automation-risk-stanford-brookings


Interested in a career in Data Analyst?

To learn more about Data Analyst with Advanced excel course – Enrol Now.
To learn more about Data Analyst with R Course – Enrol Now.
To learn more about Big Data Course – Enrol Now.

To learn more about Machine Learning Using Python and Spark – Enrol Now.
To learn more about Data Analyst with SAS Course – Enrol Now.
To learn more about Data Analyst with Apache Spark Course – Enrol Now.
To learn more about Data Analyst with Market Risk Analytics and Modelling Course – Enrol Now.

Python Statistics Fundamentals: How to Describe Your Data? (Part I)

Python Statistics Fundamentals: How to Describe Your Data?

Statistics is a branch of mathematics which deals with the collection, analysis, interpretation and presentation of masses of numerical data. Statistics is a tool used to communicate our understanding of data. It helps us understand the world better, make assertions, and communicate our confidence in the statements we are making.

Two main statistical methods are used in data analysis:

  1. Descriptive statistics: This method is used to summarize data from a sample using measures such as the mean or standard deviation
  2. Inferential statistics: With this method, you can conclude data that are subject to random variation (e.g., observational errors, sampling variation).

This article is about the descriptive statistics which are used to describe and summarize the datasets. We are also going to see the available Python libraries to get those numerical quantities.

This whole topic will be covered in a series of two blogs. This first blog is about the types of measures in descriptive statistics. Furthermore, we will also see the built-in Python “Statistics” library, which has a relatively small number of the most important statistics functions.

Descriptive statistics can be defined as the measures that summarize a given data, and these measures can be broken down further into the measures of central tendency and the measures of dispersion. Measures of central tendency include mean, median, and the mode, while the measures of dispersion include standard deviation and variance.

We will cover the following topics in descriptive statistics:

  • Measures of Central Tendency
  1. Mean
  2. Median
  3. Mode
  • Measures of Dispersion
  1. Variation
  2. Standard Deviation

First, we need to import the Python statistics module.

Mean

The arithmetic mean is the sum of data divided by the number of data-points. It is a measure of the central location of data in a set of values that vary in range. In Python, we usually do this by dividing the sum of given numbers with the count of the number present. Python mean function can be used to calculate the mean/average of the given list of numbers. It returns the mean of the data set passed as parameters.

mean( ): Arithmetic mean (“average”) of data.

harmonic_mean( ): It is the reciprocal of the arithmetic mean of the reciprocals of the data (say for three numbers a, b and c, 1/mean = 3/(1/a + 1/b + 1/c)).

Median

median( ): Median or middle value of data is calculated as the mean of middle two. When the number of data points is odd, the middle data point is returned. The median is a robust measure of a central location and is less affected by the presence of outliers in your data compared to the mean.

median_low( ): Low median of data is calculated when the number of data points is odd. Here the middle value is usually returned. When it is even, the smaller of the two middle values is returned.

median_high( ): High median of data is calculated when the number of data points is odd. Here, the middle value is usually returned. When it is even, the larger of the two middle values is returned.

Mode

mode( ): Mode (most common value) of discrete data. The mode (when it exists) is the most typical value and is a robust measure of central location.

Measures of Dispersion

Measures of dispersion are statistics that describe how data varies, usually relative to the typical value. While measures of centre give us an idea of the typical value, measures of spread give us a sense of how much the data tends to diverge from the typical value.

These following functions (from the statistics module in python) calculate a measure of how much the population or sample tends to deviate from the typical or average values.

Data Science Machine Learning Certification

Population Variance

pvariance( ): Returns the population variance of data. Use this function to calculate the variance from the entire population. To estimate the variance from a sample, the variance ( ) function is usually a better choice. When called with the entire population, this gives the population variance σ². When called on a sample instead, this is the biased sample variance s², also known as variance with N degrees of freedom.

Population Standard Deviation

pstdev( ): Return the population standard deviation (the square root of the population variance)

Sample Variance

variance ( ): Returns the sample variance of data, an iterable of at least two real-valued numbers. Variance, or second moment about the mean, is a measure of the variability (spread or dispersion) of data. A large variance indicates that the data is spread out; a small variance indicates it is clustered closely around the mean. If the optional second argument is given to the function, it should be the mean of data. This is the sample variance s² with Bessel’s correction, also known as variance with N-1 degrees of freedom.

Sample Standard Deviation

stdev( ): Returns the sample standard deviation (the square root of the sample variance)

Conclusion

So, this article focuses on describing and summarizing the datasets, also helping you to calculate numerical quantities in Python. It’s possible to get descriptive statistics with pure Python code, but that’s rarely necessary. In the next series of this blog we will see the Python statistics libraries which are comprehensive, popular, and widely used especially for this purpose.


Interested in a career in Data Analyst?

To learn more about Data Analyst with Advanced excel course – Enrol Now.
To learn more about Data Analyst with R Course – Enrol Now.
To learn more about Big Data Course – Enrol Now.

To learn more about Machine Learning Using Python and Spark – Enrol Now.
To learn more about Data Analyst with SAS Course – Enrol Now.
To learn more about Data Analyst with Apache Spark Course – Enrol Now.
To learn more about Data Analyst with Market Risk Analytics and Modelling Course – Enrol Now.

A Step-by-Step Guide on Python Variables

A Step-by-Step Guide on Python Variables

Variable is the name given to the memory location where data is stored. Once a variable is stored, space is allocated in memory. Variables are named locations that are used to store references to the object stored in memory.

With the rapid rise of the advanced programming techniques, matching with the pacing advancements of Machine Learning and Artificial Intelligence, the need for Python for Data Analysis an Machine Learning Using Python is growing. However, when it comes to trustworthy courses, it is better to go for the best Python Certification Training in Delhi.

Now, coming to this article, here are some of the topics that will be covered in this article:

  • Rules to Define a Variable
  • Assigning Values to a Variable
  • Re-declaring a Variable in Python
  • Variable Scope
  • Deleting a Variable

Data Science Machine Learning Certification

Rules to Define a Variable

These are the few rules to define a python variable:

  1. Python variable name can contain small case letters (a-z), upper case letters (A-Z), numbers (0-9), and underscore (_).
  2. A variable name can’t start with a number.
  3. We can’t use reserved keywords as a variable name.
  4. The variable name can be of any length.
  5. Python variable can’t contain only digits.
  6. The variable names are case sensitive.

Assigning Values to a Variable

There is no need for an explicit declaration to reserve memory. The assignment is done using the equal to (=) operator.

Multiple Assignment in Python

Multiple variables can be assigned to the same variable.

Multi-value Assignment in Python

Multiple variables can be assigned to multiple objects.

Re-declaring a Variable in Python

After declaring a variable, one can again declare it and assign a new value to it. Python interpreter discards the old value and only considers the new value. The type of the new value can be different than the type of the old value.

Variable Scope

A variable scope defines the area of accessibility of the variable in the program. A Python variable has two scopes:

  1. Local Scope
  2. Global Scope

Python Local Variable

When a variable is defined inside a function or a class, then it’s accessible only inside it. They are called local variables and their scope is only limited to that function or class boundary.

If we try to access a local variable outside its scope, we get an error that the variable is not defined.

Python Global Variable

When the variable is not inside a function or a class, it’s accessible from anywhere in the program. These variables are called global variables.

Deleting a Variable

One can delete variable using the command “del”.

In the example below, the variable “d” is deleted by using command Del and when it is further proceeded to print, we get an error “variable name is not defined” which means the variable is already deleted.

Conclusion

In this article we have learned the concepts of Python variables which are used in every program. We also learned the rules associated to the naming of a variable, assigning value to a variable, scope of a variable and deleting a variable.

So, if you are also hooked into Python and looking for the best courses, Python course in Gurgaon is certainly a gem of a course!


This technical blog is sourced from: www.askpython.com and intellipaat.com


Interested in a career in Data Analyst?

To learn more about Data Analyst with Advanced excel course – Enrol Now.
To learn more about Data Analyst with R Course – Enrol Now.
To learn more about Big Data Course – Enrol Now.

To learn more about Machine Learning Using Python and Spark – Enrol Now.
To learn more about Data Analyst with SAS Course – Enrol Now.
To learn more about Data Analyst with Apache Spark Course – Enrol Now.
To learn more about Data Analyst with Market Risk Analytics and Modelling Course – Enrol Now.

An In-depth Analysis of Game Theory for AI

An In-depth Analysis of Game Theory for AI

Game Theory is a branch of mathematics used to model the strategic interaction between different players in a context with predefined rules and outcomes. With the rapid rise of AI, along with the extensive time and research we are devoting to it, Game Theory is experiencing steady growth. If you are also interested in AI and want to be well-versed with it, then, opt for the Best Artificial Intelligence Training Institute in Gurgaon now!

Games have been one of the main areas of focus in artificial intelligence research. They often have simple rules that are easy to understand and train for. It is clear when one party wins, and frankly, it is fun watching a robot beat a human at chess. This trend of AI research being directed towards games is not at all an accident. Researchers know that the underlying principles of many tasks lie in understanding and mastering game theory. Both AI and game theory seek to find out how participants will react in different situations, figuring out the best response to situations, optimizing auction prices and finding market-clearing prices.

Some Useful Terms in Game Theory

  • Game: Like games in popular understanding, it can be any setting where players take actions and its outcome will depend on them.
  • Player: A strategic decision-maker within a game.
  • Strategy: A complete plan of actions a player will take, given the set of circumstances that might arise within the game.
  • Payoff: The gain a player receives from arriving at a particular outcome of a game.
  • Equilibrium: The point in a game where both players have made their decisions and an outcome is reached.
  • Dominant Strategy: When one strategy is better than another strategy for one player, regardless of the opponent’s play, the better strategy is known as a dominant strategy.
  • Agent: Agent is equivalent to a player.
  • Reward: A payoff of a game can also be termed as a reward.
  • State: All the information necessary to describe the situation an agent is in.
  • Action: Equivalent of a move in a game.
  • Policy: Similar to a strategy. It defines the action an agent will make when in particular states
  • Environment: Everything the agent interacts with during learning.

Different Types of Games in Game Theory

In the game theory, different types of games help in the analysis of different types of problems. The different types of games are formed based on number of players involved in a game, symmetry of the game, and cooperation among players.

Cooperative and Non-Cooperative Games

Cooperative games are the ones in which the players are convinced to adopt a particular strategy through negotiations and agreements between them.

Non-Cooperative games refer to the games in which the players decide on their strategy to maximize their profit. Non-cooperative games provide accurate results. This is because in non-cooperative games, a very deep analysis of a problem takes place.

Data Science Machine Learning Certification

Normal Form and Extensive Form Games

Normal form games refer to the description of the game in the form of a matrix. In other words, when the payoff and strategies of a game are represented in a tabular form, it is termed as normal form games.

Extensive form games are the ones in which the description of the game is done in the form of a decision tree. Extensive form games help in the representation of events that can occur by chance.

Simultaneous Move Games and Sequential Move Games

Simultaneous games are the ones in which the move of two players (the strategy adopted by two players) is simultaneous. In a simultaneous move, players do not know the move of other players.

Sequential games are the ones in which the players do not have a deep knowledge about the strategies of other players.

Constant Sum, Zero Sum, and Non-Zero Sum Games

Constant sum games are the ones in which the sum of outcome of all the players remains constant even if the outcomes are different. 

Zero sum games are the ones in which the gain of one player is always equal to the loss of the other player. 

Non-zero sum games can be transformed to zero sum game by adding one dummy player. The losses of the dummy player are overridden by the net earnings of players. Examples of zero sum games are chess and gambling. In these games, the gain of one player results in the loss of the other player.

Symmetric and Asymmetric Games

Symmetric games are the ones where the strategies adopted by all the players are the same. Symmetry can exist in short-term games only because in long-term games the number of options with a player increases. 

Asymmetric games are the ones where the strategies adopted by players are different. In asymmetric games, the strategy that provides benefit to one player may not be equally beneficial for the other player.

Game Theory in Artificial Intelligence

Development of the majority of the popular games which we play in this digital world is with the help of AI and game theory. Game theory is used in AI whenever there is more than one person involved in solving a logical problem. There are various algorithms of Artificial Intelligence which are used in Game Theory. Minimax algorithm in Game Theory is one of the oldest algorithms in AI and is used generally for two players. Also, game theory is not only restricted to games but also relevant to the other large applications of AI like GANs (Generative Adversarial Networks).

GANs (Generative Adversarial Networks)

GAN consists of 2 models, a discriminative model and a generative model. These models are participants on the training phase which looks like a game between them, and each model tries to better than the other.

The target of the generative model is to generate samples that are considered to be fake and are supposed to have the same distribution of the original data samples; on the other hand, the target of discriminative is to enhance itself to be able to recognize the real samples among the fake samples generated by the generative model.

It looks like a game, in which each player (model) tries to be better than the other, the generative model tries to generate samples that deceive and tricks the discriminative model, while the discriminative model tries to get better in recognizing the real data and avoid the fake samples. It is the same idea of the Minimax algorithm, in which each player targets to outclass the other and minimize the supposed loss.

This game continues until a state where each model becomes an expert on what it is doing. The generative model increases its ability to get the actual data distribution and produces data like it, and the discriminative becomes an expert in identifying the real samples, which increases the system’s classification task. In such a case, each model satisfied by its output (strategy), this is called Nash Equilibrium in Game Theory.

Nash Equilibrium

Nash equilibrium, named after Nobel winning economist, John Nash, is a solution to a game involving two or more players who want the best outcome for themselves and must take the actions of others into account. When Nash equilibrium is reached, players cannot improve their payoff by independently changing their strategy. This means that it is the best strategy assuming the other has chosen a strategy and will not change it. For example, in the Prisoner’s Dilemma game, confessing is Nash equilibrium because it is the best outcome, taking into account the likely actions of others.

Conclusion

So in this article, the fundamentals of Game Theory and essential topics are covered in brief. Also, this article gives an idea of the influence of game theory artefacts in the AI space and how Game Theory is being used in the field of Machine Learning and its real-world implementations.

Machine Learning is an ever-expanding application of Artificial Intelligence with numerous applications in the other existing fields. Besides, Machine Learning Using Python is also on the verge of proving itself to be a foolproof technology in the coming years. So, don’t wait and enrol in the world-class Artificial Intelligence Certification in Delhi NCR now and rest assured! 


Interested in a career in Data Analyst?

To learn more about Data Analyst with Advanced excel course – Enrol Now.
To learn more about Data Analyst with R Course – Enrol Now.
To learn more about Big Data Course – Enrol Now.

To learn more about Machine Learning Using Python and Spark – Enrol Now.
To learn more about Data Analyst with SAS Course – Enrol Now.
To learn more about Data Analyst with Apache Spark Course – Enrol Now.
To learn more about Data Analyst with Market Risk Analytics and Modelling Course – Enrol Now.

What is a Neural Network?

What is a Neural Network?

Before we get started with the process of building a Neural Network, we need to understand first what a Neural Network is.

A neural network is a collection of neurons connected by synapses. This collection is organized into three main layers: the input layer, the hidden layer, and the output layer.

In an artificial neural network, there are several inputs, which are called features, producing a single output, known as a label.

Analogy between Human Mind and Neural Network

Scientists believe that a living creature’s brain processes information through the use of a biological neural network. The human brain has as many as 100 trillion synapses – gaps between neurons – which form specific patterns when activated.

In the field of Deep Learning, a neural network is represented by a series of layers that work much like a living brain’s synapses. It is becoming a popular course now, with an array of career opportunities. Thus, Deep learning Certification in Gurgaon is a must for everyone.

Scientists use neural networks to teach computers how to do things for themselves. The whole concept of Neural network and its varied applications are pretty interesting. Moreover, with the matchless Neural Networks Training in Delhi, you need not look any further.

There are numerous kinds of deep learning and neural networks:

  1. Feedforward Neural Network – Artificial Neuron
  2. Radial basis function Neural Network
  3. Kohonen Self Organizing Neural Network
  4. Recurrent Neural Network (RNN) – Long Short Term Memory
  5. Convolutional Neural Network
  6. Modular Neural Network
  7. Generative adversarial networks (GANs)

Data Science Machine Learning Certification

Working of a Simple Feedforward Neural Network

  1. It takes inputs as a matrix (2D array of numbers).
  2. Multiplies the input by a set weight (performs a dot product aka matrix multiplication).
  3. Applies an activation function.
  4. Returns an output.
  5. Error is calculated by taking the difference from the desired output from the data and the predicted output. This creates our gradient descent, which we can use to alter the weights.
  6. The weights are then altered slightly according to the error.
  7. To train, this process is repeated 1,000+ times. The more the data is trained upon, the more accurate our outputs will be.

Implementation of a Neural Network with Python and Keras

Keras has two types of models:

  • Sequential model
  • The model class used with functional API

Sequential model is probably the most used feature of Keras. Primarily, it represents the array of Keras Layers. It is convenient and builds different types of Neural Networks really quick, just by adding layers to it. Keras also has different types of Layers like Dense Layers, Convolutional Layers, Pooling Layers, Activation Layers, Dropout Layers etc.

The most basic layer is Dense Layer. It has many options for setting the inputs, activation function and so on. So, let’s see how one can build a Neural Network using Sequential and Dense. 

First, let’s import the necessary code from Keras:

After this step, the model is ready for compilation. The compilation step asks to define the loss function and the kind of optimizer which should be used. These options depend on the problem one is trying to solve.

Now, the model is ready to get trained. Thus, the parameters get tuned to provide the correct outputs for a given input. This can be done by feeding inputs at the input layer and then, getting an output.

After this one can calculate the loss function using the output and use backpropagation to tune the model parameters. This will fit the model parameters to the data.

Output of the above cell:-

This output shows the loss decrease and the accuracy increase over time. At this point, one can experiment with the hyper-parameters and neural network architecture to get the best accuracy.

After getting the final model architecture, one can now take the model and use feed-forward passes and predict inputs. To start making predictions, one can use the testing dataset in the model that has been created previously. Keras enables one to make predictions by using the .predict() function.

Some points to be remembered while building a strong Neural Network

1. Adding Regularization to Fight Over-Fitting

The predictive models mentioned above are prone to a problem of overfitting. This is a scenario whereby the model memorizes the results in the training set and isn’t able to generalize on data that it hasn’t seen.

In neural networks, regularization is the technique that fights overfitting by adding a layer in the neural network. It can be done in 3 ways:

  • L1 Regularization
  • L2 Regularization
  • Dropout Regularization

Out of these, Dropout is a commonly used regularization technique. In every iteration, it adds a Dropout layer in the neural network and thereby, deactivates some neurons. The process of deactivating neurons is usually random.

2. Hyperparameter Tuning

Grid search is a technique that you can use to experiment with different model parameters to obtain the ones that give you the best accuracy. This is done by trying different parameters and returning those that give the best results. It helps in improving model accuracy.

Conclusion

Neural Network is coping with the fast pace of the technology of the age remarkably well and thereby, inducing the necessity of courses like Neural Network Machine Learning PythonNeural Networks in Python course and more. Though these advanced technologies are just at their nascent stage, they are promising enough to lead the way to the future. 

In this article, Building and Training our Neural Network is shown. This simple Neural Network can be extended to Convolutional Neural Network and Recurrent Neural Network for more advanced applications in Computer Vision and Natural Language Processing respectively.

Reference Blogs:

https://keras.rstudio.com

https://www.khanacademy.org/math/precalculus/x9e81a4f98389efdf:matrices/x9e81a4f98389efdf:multiplying-matrices-by-matrices/v/matrix-multiplication-intro


Interested in a career in Data Analyst?

To learn more about Data Analyst with Advanced excel course – Enrol Now.
To learn more about Data Analyst with R Course – Enrol Now.
To learn more about Big Data Course – Enrol Now.

To learn more about Machine Learning Using Python and Spark – Enrol Now.
To learn more about Data Analyst with SAS Course – Enrol Now.
To learn more about Data Analyst with Apache Spark Course – Enrol Now.
To learn more about Data Analyst with Market Risk Analytics and Modelling Course – Enrol Now.

How to Structure Python Programs? An Extensive Guide

How to Structure Python Programs? An Extensive Guide

Python is an extremely readable and versatile high-level programming language. It supports both Object-oriented programming as well as Functional programming. It is generally referred to as an interpreted language which means that each line of code is executed one by one and if the interpreter finds an error it stops proceeding further and gives an error message to the user. This makes Python a widely regarded language, fueling Machine Learning Using Python, Text Mining with Python course and more. Furthermore, with such a high-end programming language, Python for data analysis looks ahead for a bright future.

Data Science Machine Learning Certification

In the Structure of Python

Computer languages have a structure just like human languages. Therefore, even in Python, we have comments, variables, literals, operators, delimiters, and keywords.

To understand the program structure of Python we will look at the following in this article: –

  1. Python Statement
    • Simple Statement
    • Compound Statement
  2. Multiple Statements Per Line
  3. Line Continuation
    • Implicit Line Continuation
    • Explicit Line Continuation
  4. Comments
  5. Whitespace
  6. Indentation
  7. Conclusion

Python Statement

A statement in Python is a logical instruction that the interpreter reads and executes. The interpreter executes statements sequentially, one by one. In Python, it could be an assignment statement or an expression. The statements are mostly written in such a style so that each statement occupies a single line.

Simple Statements

A simple statement is one that contains no other statements. Therefore, it lies entirely within a logical line. An assignment is a simple statement that assigns values to variables, unlike in some other languages; an assignment in Python is a statement and can never be part of an expression.

Compound Statement

A compound statement contains one or more other statements and controls their execution. A compound statement has one or more clauses, aligned at the same indentation. Each clause has a header starting with a keyword and ending with a colon (:), followed by a body, which is a sequence of one or more statements. When the body contains multiple statements, also known as blocks, these statements should be placed on separate logical lines after the header line, indented four spaces rightward.

Multiple Statements per Line

Although it is not considered good practice multiple statements can be written in a single line in Python. It is advisable to avoid multiple statements in a single line. But, if it is necessary, then it can be written with the help of semicolon (;) as the terminator of every statement.

Line Continuation

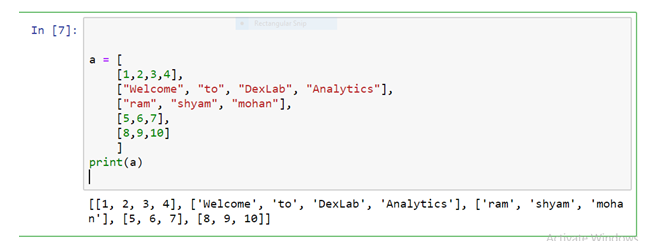
In Python there might be some cases when a single statement is too long that does not fit the browser window and one needs to scroll the screen left or right. This can be a case of assignment statement with many terms or defining a lengthy nested list. These long statements of code are generally considered a poor practice.

To maintain readability, it is advisable to split the long statement into parts across several lines. In Python code, a statement can be continued from one line to the next in two different ways: implicit and explicit line continuation.

Implicit Line Continuation

This is the more straightforward technique for line continuation. In implicit line continuation, one can split a statement using either of parentheses ( ), brackets [ ] and braces { }. Here, one needs to enclose the target statement using the mentioned construct.

Explicit Line Continuation

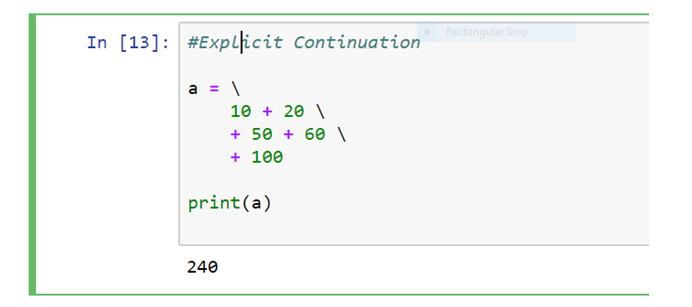
In cases where implicit line continuation is not readily available or practicable, there is another option. This is referred to as an explicit line continuation or explicit line joining. Here, one can right away use the line continuation character (\) to split a statement into multiple lines.

Comments

A comment is text that doesn’t affect the outcome of a code; it is just a piece of text to let someone know what you have done in a program or what is being done in a block of code. This is especially helpful when a code is written and someone is analyzing it for bug fixing or making a change in logic, by reading a comment one can understand the purpose of code much faster than by just going through the actual code.

There are two types of comments in Python.
1. Single line comment
2. Multiple line comment

Single line comment

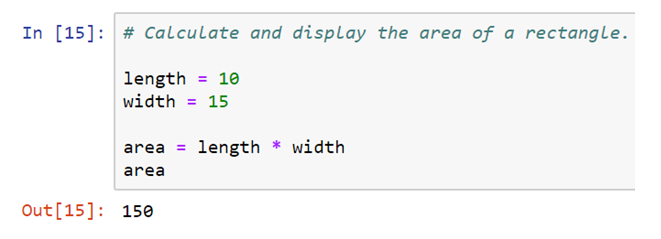
In python, one can use # special character to start the comment.

Multi-line comment

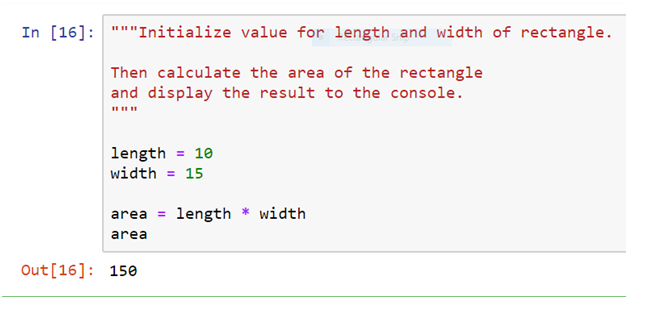
To have a multi-line comment in Python, one can use Triple Double Quotation at the beginning and the end of the comment.

Whitespace

One can improve the readability of the code with the use of whitespaces. Whitespaces are necessary for separating the keywords from the variables or other keywords. Whitespace is mostly ignored by the Python interpreter.

Indentation

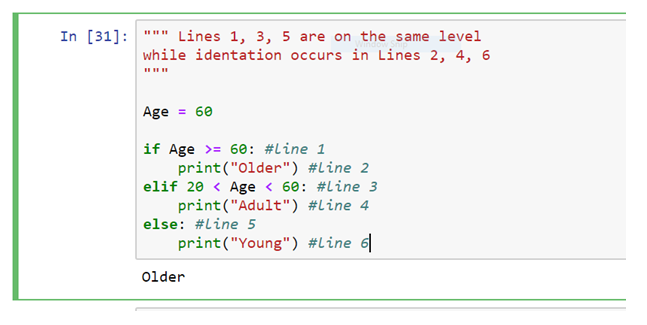
Most of the programming languages provide indentation for better code formatting and don’t enforce to have it. However, in Python, it is mandatory to obey the indentation rules. Typically, we indent each line by four spaces (or by the same amount) in a block of code. Also for creating compound statements, the indentation will be of utmost necessity.

Conclusion

So, this article was all about how to structure the Python program. Here, one can learn what constitutes a valid Python statement and how to use implicit and explicit line continuation to write a statement that spans multiple lines. Furthermore, one can also learn about commenting Python code, and about the use of whitespace and indentation to enhance the overall readability.

Our Machine Learning Certifications have undergone an industrial upgradation

We hope this article was helpful to y ou. If you are interested in similar blogs, stay glued to our website, and keep following all the news and updates from Dexlab Analytics.


Interested in a career in Data Analyst?

To learn more about Data Analyst with Advanced excel course – Enrol Now.
To learn more about Data Analyst with R Course – Enrol Now.
To learn more about Big Data Course – Enrol Now.

To learn more about Machine Learning Using Python and Spark – Enrol Now.
To learn more about Data Analyst with SAS Course – Enrol Now.
To learn more about Data Analyst with Apache Spark Course – Enrol Now.
To learn more about Data Analyst with Market Risk Analytics and Modelling Course – Enrol Now.

Alteryx is Inclined to Make Things Easy

Alteryx is Inclined to Make Things Easy

Alteryx Analytics is primarily looking to ease the usability of the platform in all of the updates that are yet to come. The esteemed data analytics platform is concentrating on reducing the complexities to attract more users and thus, widen their age-old user base beyond that of the data scientists and data analytics professionals.

Alteryx is headquartered in Irvine, California. It was founded as SRC LLC in 1997 and comes with a suite of four tools to help the world of data scientists and data analysts to manage and interpret data easily. Alteryx Connect, Alteryx Designer, Alteryx Promote and Alteryx Server are the main components of the analytics platform of Alteryx. Thus, it is worth mentioning that the Alteryx Certification Course is a must if you are looking to make a career out of data science/data analytics.

Deep Learning and AI using Python

A Quick Glance at the Recent Updates 

The reputed firm launched a recent version of Alteryx 2019.3, in October, and is likely to release the Alteryx 2019.4 as a successor to it. The latter is scheduled for a December release.

What’s in the Update?

Talking about the all-new version Alteryx 2019.3, Ashley Kramer, senior vice president of product management at Alteryx, said that the latest version promises 25 new and upgraded features, all of them focussing on the user-friendliness of the platform at large.

One of the prominent features of the new version is a significant decrease in the total number of clicks that a user will take to arrive at the option of visualizing data to make analytic decisions.

Data profiling helps the users to visualize the data while they are working with it. Here, Alteryx discovered a painless way to work with data by modeling the bottom of the screen in a format similar to that of MS Excel.

All of these changes and additions are done keeping in mind the features that the “customers had been asking for,” according to Kramer.

Now, with the December update, which will come with an enhanced mapping tool, the Alteryx analytics will strive to further lower the difficulties surrounding the platform.

2

If you are interested in knowing all the latest features, it is better to join one of the finest AlterYX Training institutes in Delhi NCR, with exhaustive Analytics Courses in Delhi NCRalong with other demanding courses like Python for Data Analysis, R programming courses in Gurgaonmatchless course of Big Data, Data Analytics and more.

 
The blog has been sourced fromsearchbusinessanalytics.techtarget.com/news/252474294/Alteryx-analytics-platform-focuses-on-ease-of-use
 

Interested in a career in Data Analyst?

To learn more about Data Analyst with Advanced excel course – Enrol Now.
To learn more about Data Analyst with R Course – Enrol Now.
To learn more about Big Data Course – Enrol Now.

To learn more about Machine Learning Using Python and Spark – Enrol Now.
To learn more about Data Analyst with SAS Course – Enrol Now.
To learn more about Data Analyst with Apache Spark Course – Enrol Now.
To learn more about Data Analyst with Market Risk Analytics and Modelling Course – Enrol Now.
Call us to know more