In our previous blog we discussed about few of the basic functions of MQL like .find() , .count() , .pretty() etc. and in this blog we will continue to do the same. At the end of the blog there is a quiz for you to solve, feel free to test your knowledge and wisdom you have gained so far.
Given below is the list of functions that can be used for data wrangling:-
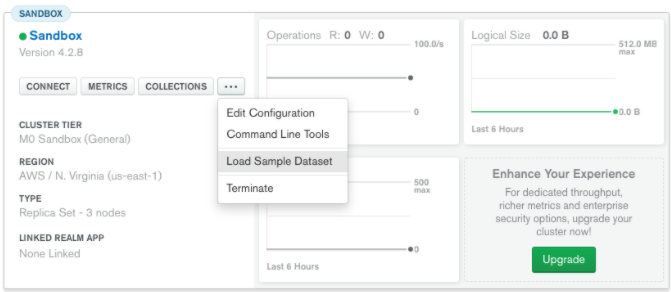
- updateOne() :- This function is used to change the current value of a field in a single document.
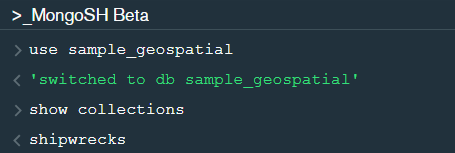
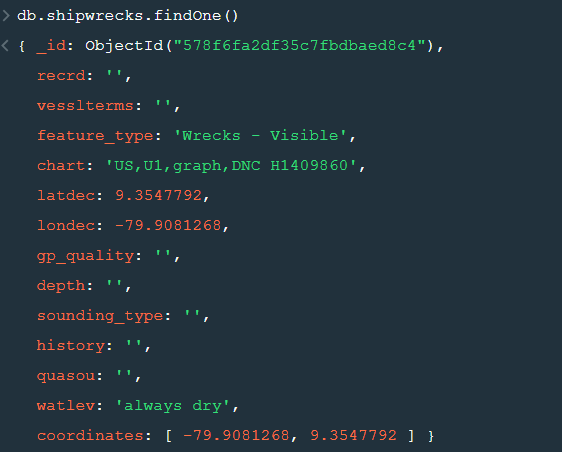
After changing the database to “sample_geospatial” we want to see what the document looks like? So for that we will use .findOne() function.
Now lets update the field value of “recrd” from ‘ ’ to “abc” where the “feature_type” is ‘Wrecks-Visible’.
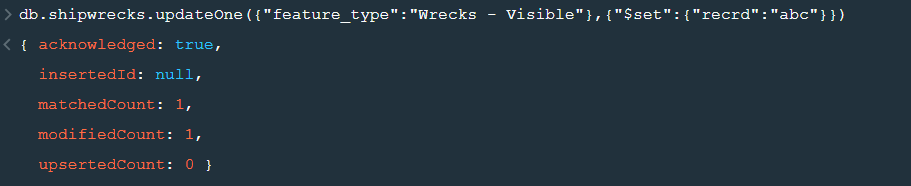
Now within the .updateOne() funtion any thing in the first part of { } is the condition on the basis of which we want to update the given document and the second part is the changes which we want to make. Here we are saying that set the value as “abc” in the “recrd” field . In case you wanted to increase the value by a certain number ( assuming that the value is integer or float) you can use “$inc” instead.
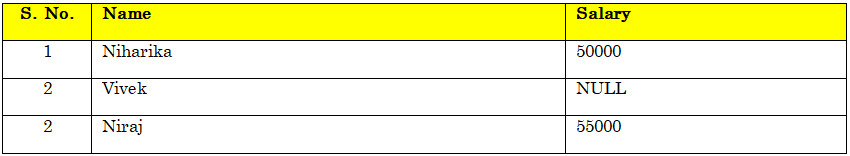
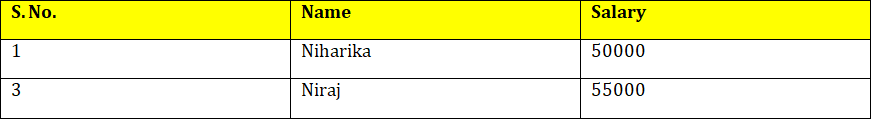
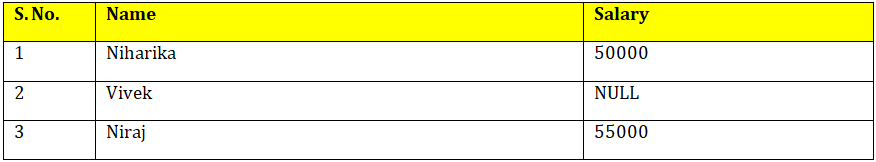
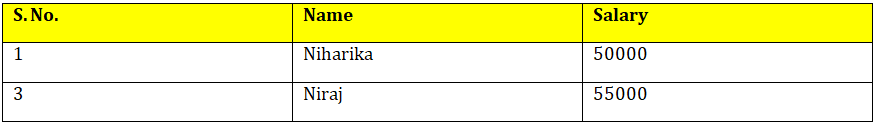
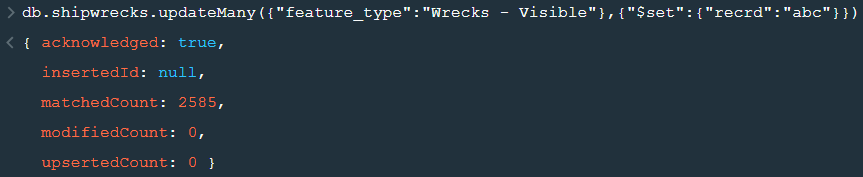
2. updateMany() :- This function updates many documents at once based on the condition provided.
3. deleteOne() & deleteMany() :- These functions are used to delete one or many documents based on the given condition or field.
![]()
![]()
4. Logical Operators :-
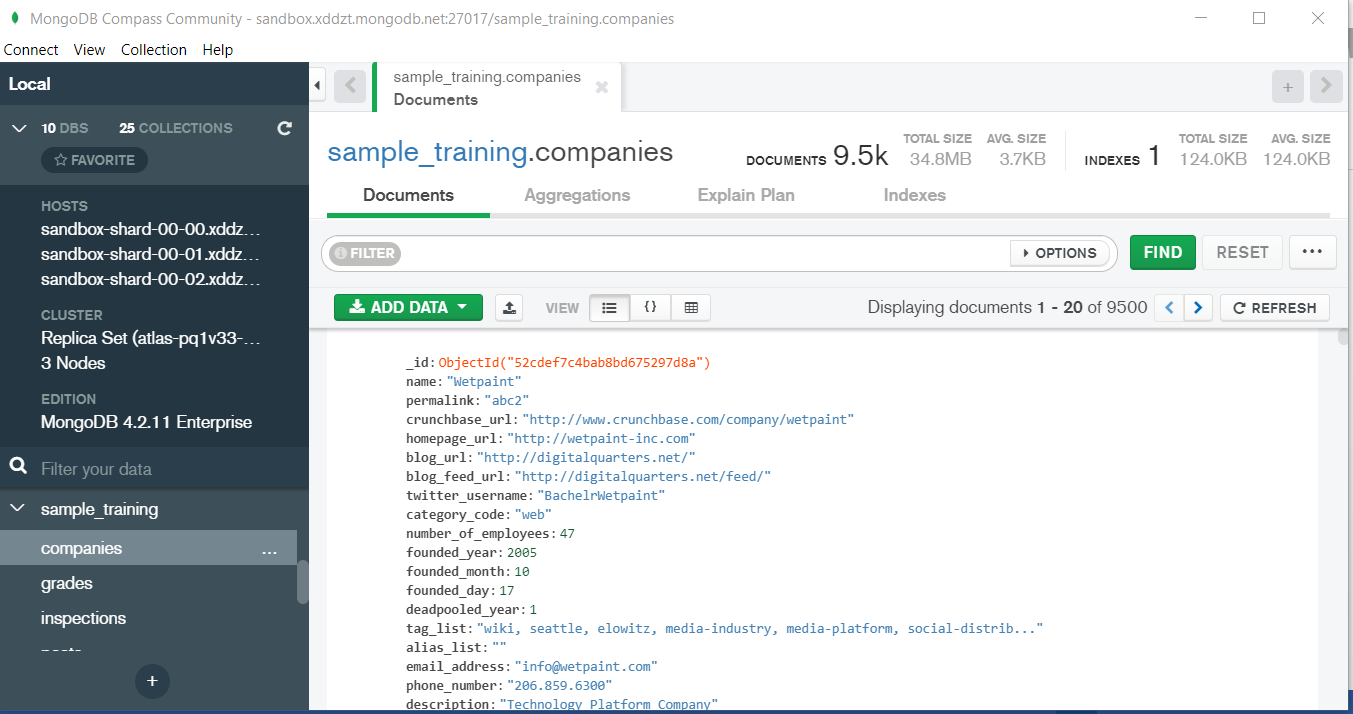
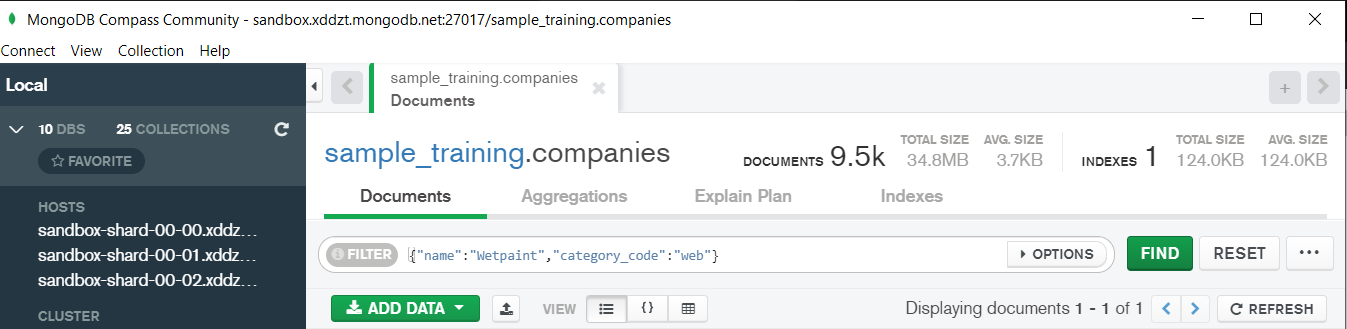
“$and” : It is used to match all the conditions.
“$or” : It is used to match any of the conditions.
![]()
![]()
The first code matches both the conditions i.e. name should be “Wetpaint” and “category_code” should be “web”, whereas the second code matches any one of the conditions i.e. either name should be “Wetpaint” or “Facebook”. Try these codes and see the difference by yourself.
So, with that we come to the end of the discussion on the MongoDB Basics. Hopefully it helped you understand the topic, for more information you can also watch the video tutorial attached down this blog. The blog is designed and prepared by Niharika Rai, Analytics Consultant, DexLab Analytics DexLab Analytics offers machine learning courses in Gurgaon. To keep on learning more, follow DexLab Analytics blog.
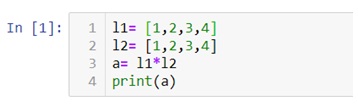
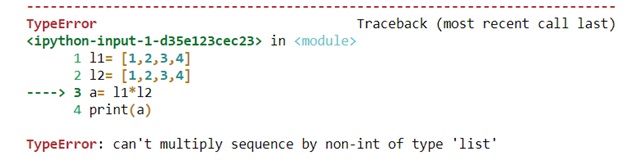
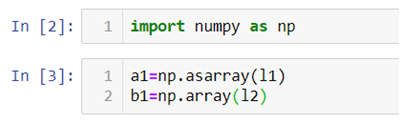
.