Statistical analysis helps explore data relationship and develop high-end models to frame better decisions. It’s an intricate process of collecting and evaluating data to define the nature of data that has to be analyzed.
Below, we dig into the basics of statistical application in R and Python using the measure of central tendency.
Introduction:-
As body methods for the study of numerical data, if some rows or columns are too long, in such cases, it becomes necessary to summarize data in an easily manageable form. The purpose is to serve by classifying the data in the form of frequency distribution and various graphs. When data relate to a variable, the process of summarization can be taken a step further by using certain descriptive measures. The dim is to focus on certain features that are central frequency and description.

Central Tendency :
In a set of data, they have a tendency, notwithstanding their variability, to cluster-around a central value and the tendency of the quantitative statistical observations is called central tendency.
The three measures of the central tendency are commonly used is:-
- Mean
- Median
- Mode
The description of these 3 estimators start below:-
Mean:-
Mean is the average of central tendency and is the most commonly used measures.
The concept of mean is divided into three parts:-
- Arithmetic mean.
- Geometric mean.
- Harmonic mean.
Mainly the mean refers to an arithmetic mean.
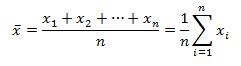
Arithmetic Mean (A.M.):-
The arithmetic mean of a set of observations is defined to be their sum, divided by the number of observations.
For n numbers of observation (x1,x2,… ,xn )
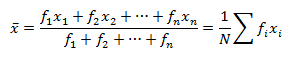
Weighted A.M.
For frequency distribution where have frequencies. (i=1,2,3…)
Application of A.M.:-
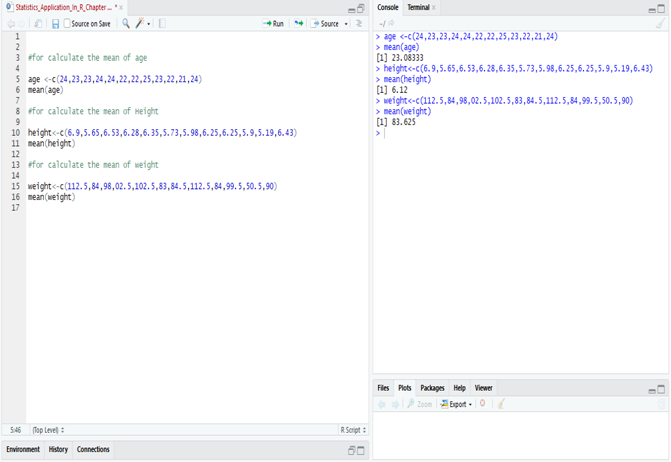
Let’s, calculate the mean of Age, Height & Weight from the given data.
| Name | Sex | Age | Height | Weight |
| Ritesh | M | 24 | 6.9 | 112.5 |
| Heena | F | 23 | 5.65 | 84 |
| Kritika | F | 23 | 6.53 | 98 |
| Anuradha | F | 24 | 6.28 | 102.5 |
| Gaurav | M | 24 | 6.35 | 102.5 |
| Prakash | M | 22 | 5.73 | 83 |
| Aarti | F | 22 | 5.98 | 84.5 |
| Meena | F | 25 | 6.25 | 112.5 |
| Utkarsh | M | 23 | 6.25 | 84 |
| Chirag | M | 22 | 5.9 | 99.5 |
| Neha | F | 21 | 5.13 | 50.5 |
| Smrita | F | 24 | 6.43 | 90 |
Calculating Mean in Python:
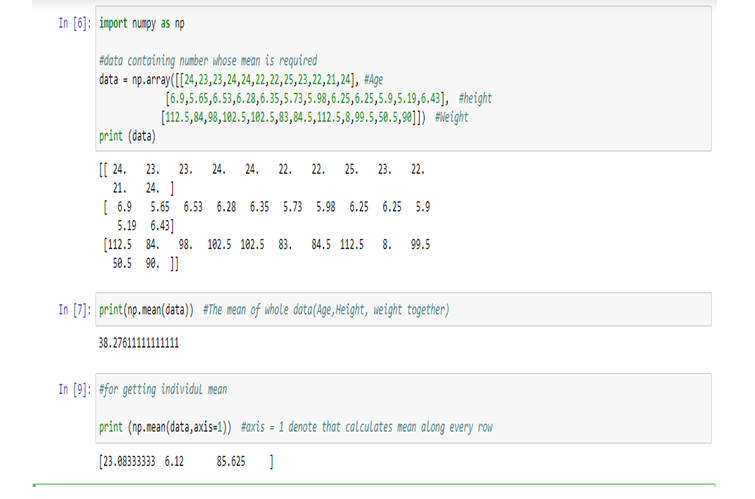
Therefore,
Age (Mean) = 23.08333333, Height (Mean) = 6.12, weight(Mean) = 85.625
Calculating Mean in R:
Application of Weighted A.M.:-
The weighted mean is denoted that the mean with frequency.
Data to solve:
Calculate the average price per ton of coal purchased by the industry for the half-year.
Month | Price Per Ton | Tons Purchased |
January | Rs. 52.49 | 26 |
February | Rs. 62.23 | 34 |
| March | Rs. 87.26 | 40 |
| April | Rs. 45.25 | 54 |
| May | Rs. 78.56 | 13 |
June | Rs. 69.25 | 45 |
Data to solve:
Month | Price (Rs) Per Ton (x) | Tons Purchased (f) | fx=y (Main Data) |
January | 52.49 | 26 | 1364.74 |
February | 62.23 | 34 | 2115.82 |
March | 87.26 | 40 | 3490.4 |
April | 45.25 | 54 | 2443.5 |
May | 78.56 | 13 | 1021.28 |
June | 69.25 | 45 | 3116.25 |
| Total | 395.04 | N=212 | 13551.99 |
The price is denoted as x (52.49, 62.23, 87.26, 45.25, 78.56, 69.25 [in Rs.])=395.04
The amount of purchased (frequency) is denoted by f (26, 34, 40, 54, 13, 45) = 212 (N)
Then multiply the x and f and we get the total amount which is denoted by y, fx(y) = 13551.99
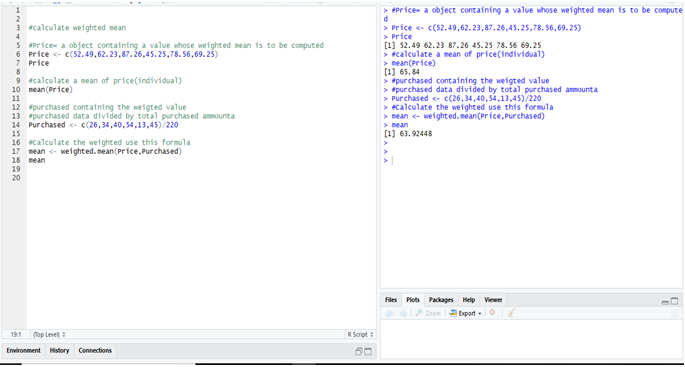
Calculate Weighted Mean in R:
Calculate Weighted Mean in Python:
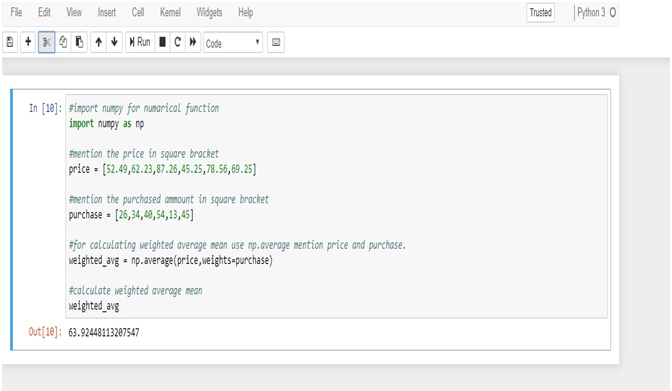
To calculate the weighted mean from R & Python we get the same result = 63.9244811.
Want to know more about the nature of data? Keen to perform high-end statistical analysis using Python and R? Follow DexLab Analytics, an excellent Python training center in Gurgaon, India. Our team of consultants will help you learn the basics of R and Python in the easiest manner possible.
Interested in a career in Data Analyst?
To learn more about Data Analyst with Advanced excel course – Enrol Now.
To learn more about Data Analyst with R Course – Enrol Now.
To learn more about Big Data Course – Enrol Now.To learn more about Machine Learning Using Python and Spark – Enrol Now.
To learn more about Data Analyst with SAS Course – Enrol Now.
To learn more about Data Analyst with Apache Spark Course – Enrol Now.
To learn more about Data Analyst with Market Risk Analytics and Modelling Course – Enrol Now.