neural networks in python course Archives - Page 2 of 3 - DexLab Analytics | Big Data Hadoop SAS R Analytics Predictive Modeling & Excel VBA

Statistical Application in R & Python: Normal Probability Distribution

Statistical Application in R & Python: Normal Probability Distribution

Gauss, the famous French Mathematician is responsible for developing one of the most significant distributions in all of statistics, i.e. – The Normal Distribution. Please refer to the blog on Central Limit Theorem: www.dexlabanalytics.com/blog/the-almighty-central-limit-theorem. It will help you fully grasp the significance of the Normal Distribution. However, if you want to revisit our series of blogs by following it from the start, you can reach STATISTICAL APPLICATION IN R & PYTHON: CHAPTER 1 – MEASURE OF CENTRAL TENDENCY right now!

Essentially, the Normal Distribution provides “approximations” to most other distributions such as the Binomial, Poisson, Gamma, Exponential, etc. This is to say as sample sizes get statistically large enough, most distributions approximate into a normal shaped curve.

Every distribution has important features known as its “parameters”. Normal distribution has two parameters. These are Mean ( ) and Variance (σ²). The normal distribution has a bell-shaped curve, where the probability of likelihood peaks at its mean in the middle.

The Normal Distribution has vast practical applications in the field of Business, Finance, Medicine, and Physics and so on. Things like weights, heights, IQ scores follow the Normal Distribution.

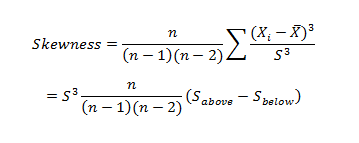
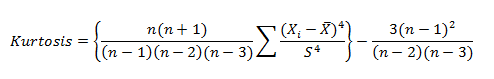
Normal Distribution, Gaussian distribution, is a continuous probability distribution and is defined by the Probability Density Function (PDF).
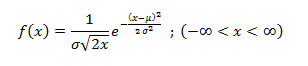
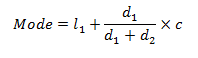
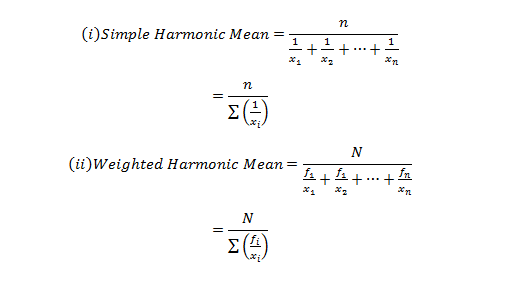
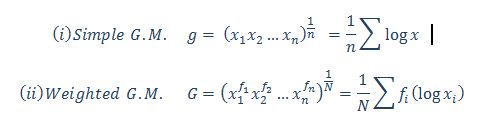
Where,

Application:

Assume that the credit score fits a Normal Distribution.

Suppose Mr. Arjun’s last 10 month’s credit score are:

789, 635, 739, 687, 724, 810, 817, 735, 819, 820

What is the probability that the percentage of credit score will 825 or more in the 11th month?

Months

Credit Score

January

789

February

635

March

739

April

687

May

724

June

810

July

817

August

735

September

819

October

820


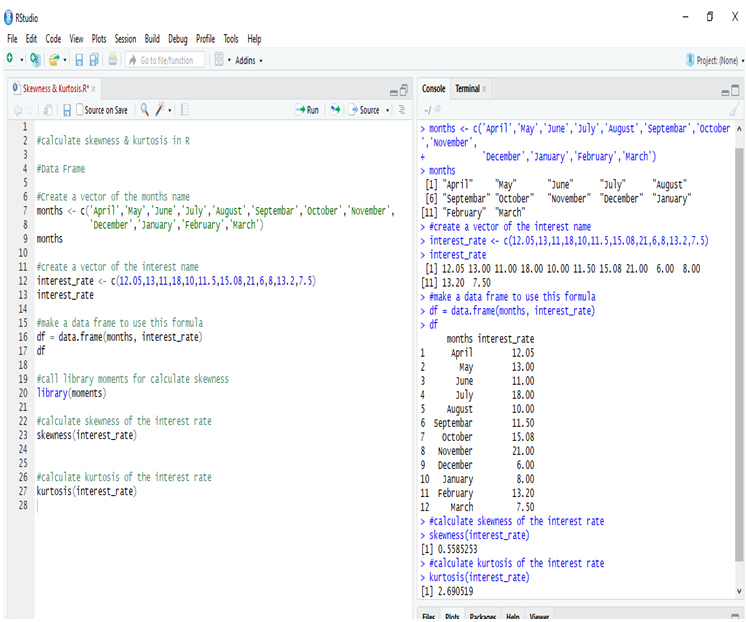
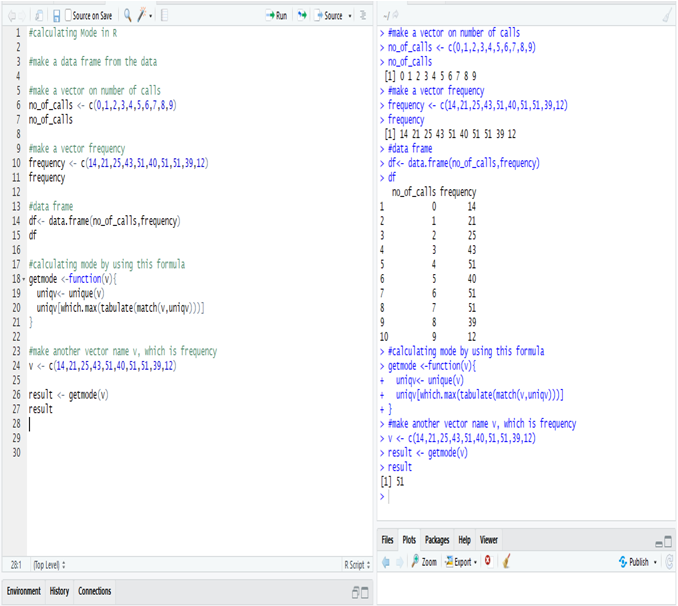
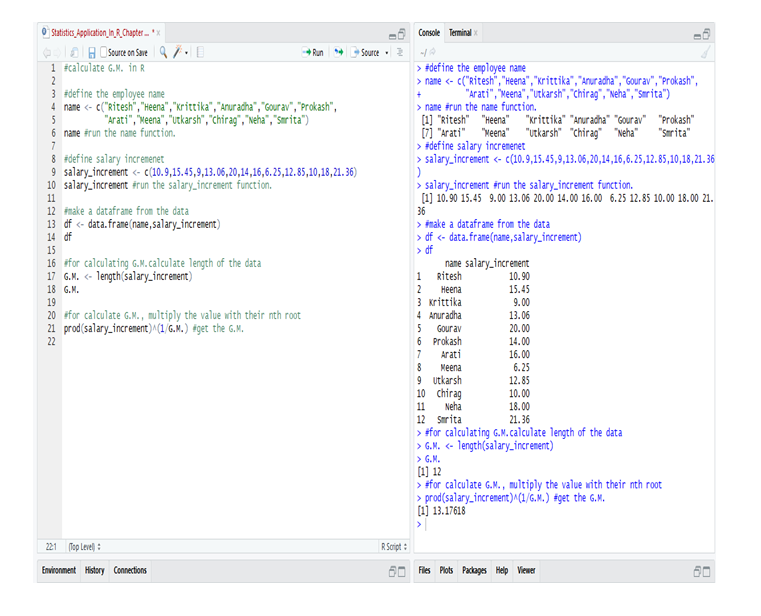
Calculating Normal Distribution in R:

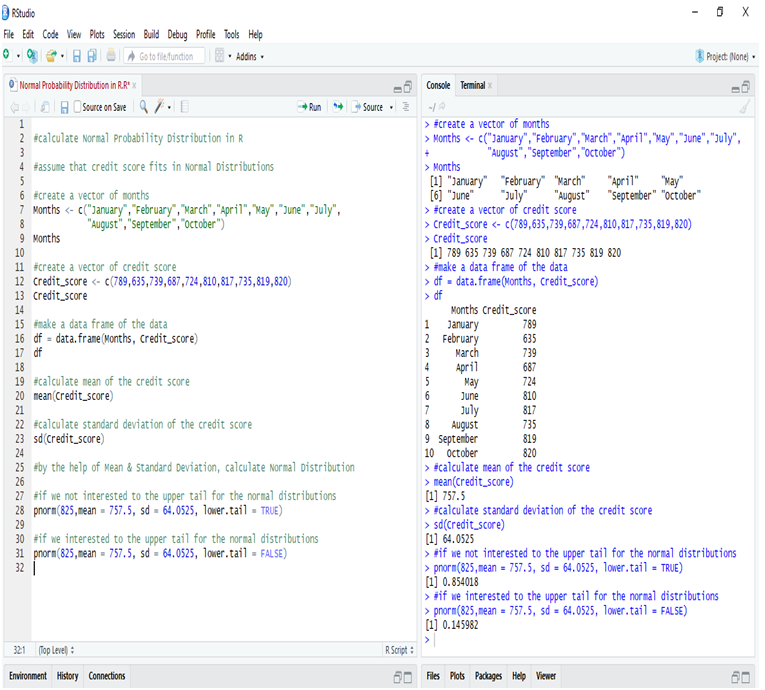
If we go to calculate Normal Probability Distribution in R, we can predict that the probability of the 11th month credit score will be 825 or greater than that is 14.60%, whereas in another case, the probability of the 11th month credit score will be 825 or less than that is 85.40%.

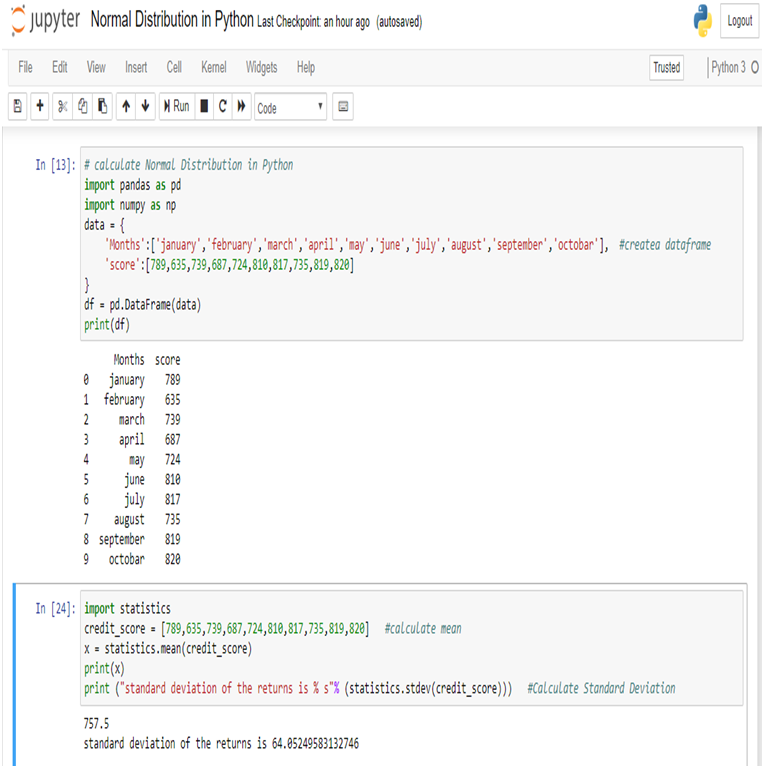
Calculate Normal Distribution in Python:

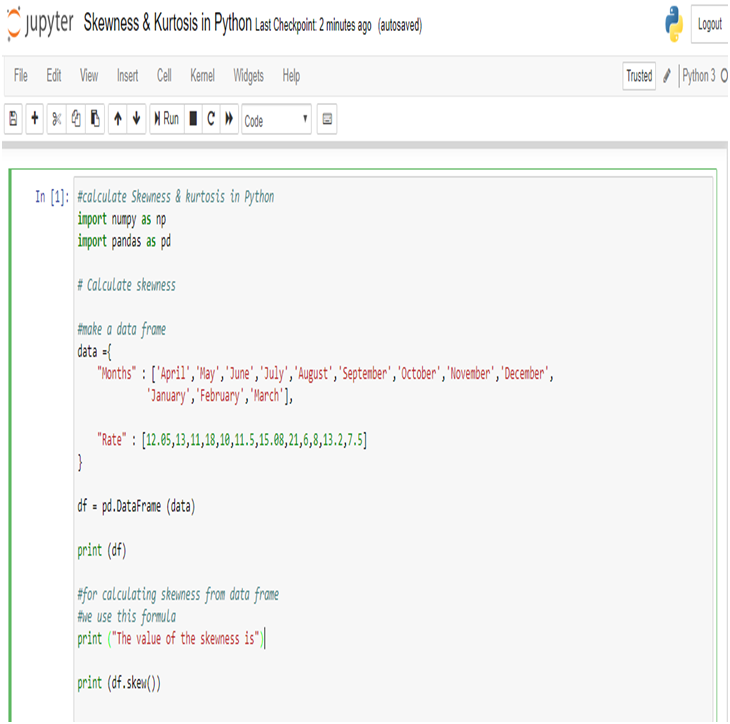
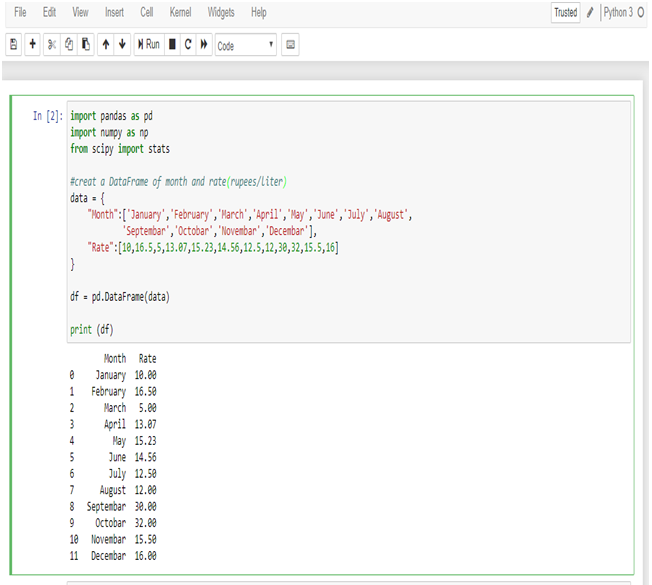
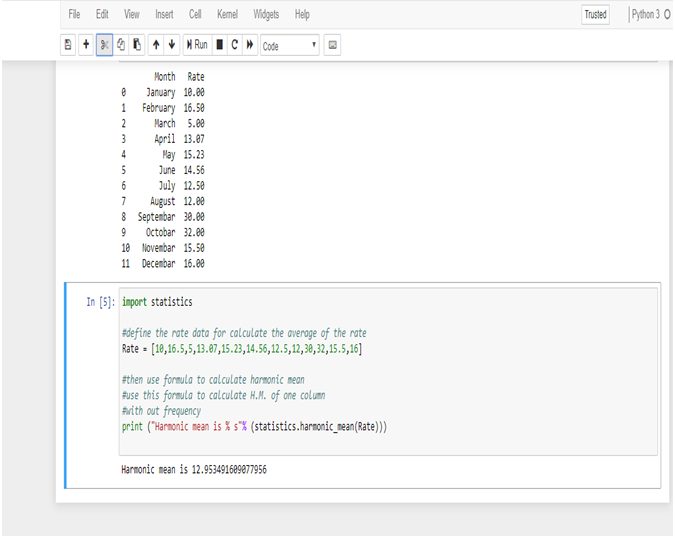
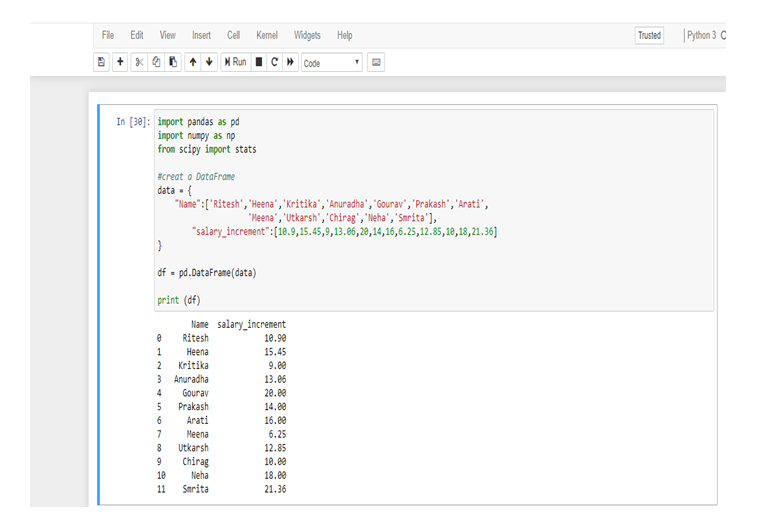
Make a data frame of the data and calculate Mean and Standard Deviation for calculate Normal Distribution.

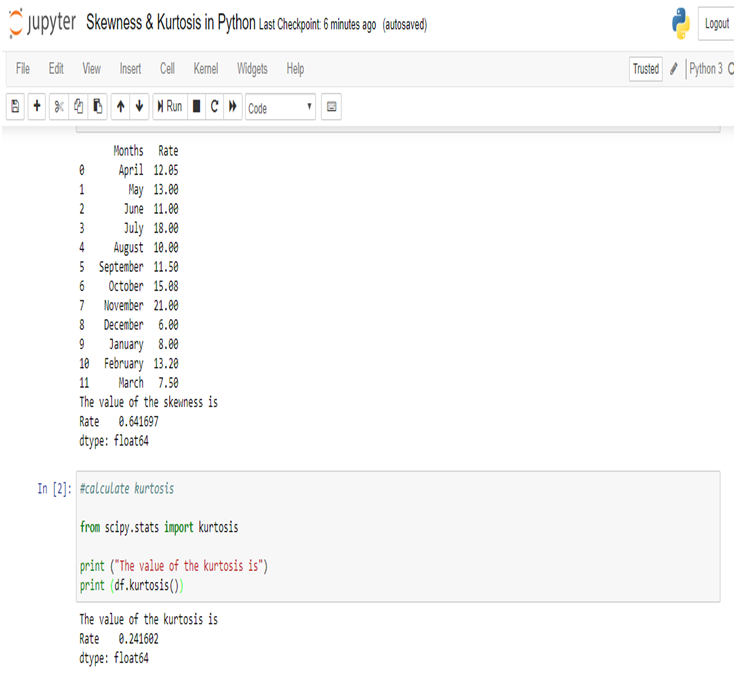
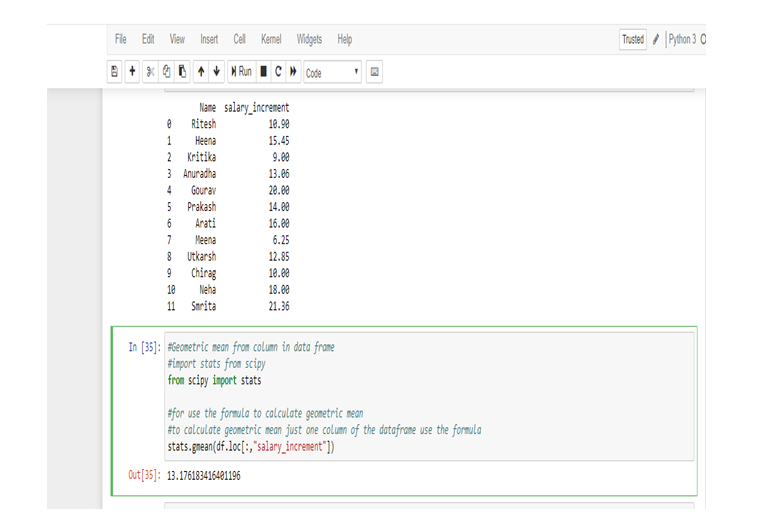
Now, we can easily calculate Normal Distribution in Python

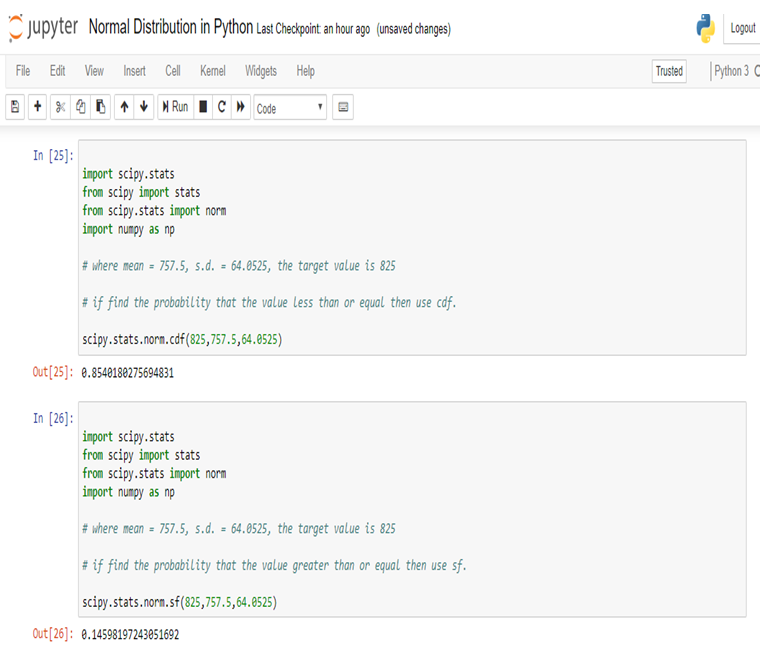
So, in calculating the Normal Probability Distribution in Python, we can predict that the probability of the 11th month credit score will be 825 or greater than that is 14.60%, whereas in another case, the probability of the 11th month credit score will be 825 or less than that is 85.40%.

Conclusion:

Normal Distribution is used for calculating parameters. It is represented by the bell curve, where the total area of the curve is 1. Normal Distribution has its use in Finance, Business, Salaries, Blood Pressures, Measurement etc and many other fields.

Here, we have used Normal Distribution to predict Mr. Arjun’s 11th month credit score, and set the target (825). By Normal Distribution we can predict the percentage of possibility to achieve the target.

Calculating Binomial Distribution might be tricky for many but with Dexlab Analytics it won’t be hassle anymore. So, get hold of our STATISTICAL APPLICATION IN R AND PYTHON: CALCULATING BINOMIAL DISTRIBUTION blog, to get around all your problems.


Interested in a career in Data Analyst?

To learn more about Data Analyst with Advanced excel course – Enrol Now.
To learn more about Data Analyst with R Course – Enrol Now.
To learn more about Big Data Course – Enrol Now.

To learn more about Machine Learning Using Python and Spark – Enrol Now.
To learn more about Data Analyst with SAS Course – Enrol Now.
To learn more about Data Analyst with Apache Spark Course – Enrol Now.
To learn more about Data Analyst with Market Risk Analytics and Modelling Course – Enrol Now.

How progressive is an Artificial Neural Network? Tracking ANNs

How progressive is an Artificial Neural Network? Tracking ANNs

The major improvements that Artificial Neural Network is bringing about in favour of deep learning for computer vision with Python are ground-breaking. Machine vision, in general, is hugely benefitted with the inclusion of the computer vision course Pythonspurred by the all-new technology of Neural Networks. This is by and large a huge advancement in the field of computer science and gives much of an insight into what the future holds for us.

However, along with an array of experiments that are performed day in day out with Neural Network Machine Learning Python, numerous other fields are also likely to be revamped in much the same way. Predicting the weather, studying animals and other critical studies of cosmology are also believed to be easing soon holding the hands of the Artificial Neural Network technology.

2

Some Well-known Feats of the Artificial Neural Network

Artificial Neural networks (ANNs) are used in studying the patterns, relationships from the collected data just like humans. Going by the name, ANNs are modelled on the neural networks found in our brains, which are used to infuse the machines with the ability to learn by them. Besides, ANNs have been hugely successful in bringing about the concept of self-driving cars, boosting medical technology and numerous other fields. But, here we lay down some other fields which are soaking in the Artificial Neural Network extensively.

Meteorology

The accurate prediction of hailstorms and providing relevant alerts to the specific areas are expected to boost shortly. With the inclusion of Convolutional neural networks, (CNNs) the study of meteorology is deemed to achieve new heights. Besides, this improved technology would also be capable of identifying the size of the hails during this storm.

Tracking Bird Migration

We are all aware of the phenomenon of migration for the birds. But with the changing age, the routes of the birds are also different from what they used to be. However, if you need to track the migration of the birds, you can opt for the exclusive Neural Networks in Python course.

Deep Learning and AI using Python

Interpreting the Dark Matter

Dark matter has been a topic which remains largely unexplored till date. Nothing beyond the name and the fact that it binds the universe together is brought to light. However, with the marked progress of the premium institutes like the Neural Networks Training in Delhithe dark matter will no longer be a mystery.


Interested in a career in Data Analyst?

To learn more about Data Analyst with Advanced excel course – Enrol Now.
To learn more about Data Analyst with R Course – Enrol Now.
To learn more about Big Data Course – Enrol Now.

To learn more about Machine Learning Using Python and Spark – Enrol Now.
To learn more about Data Analyst with SAS Course – Enrol Now.
To learn more about Data Analyst with Apache Spark Course – Enrol Now.
To learn more about Data Analyst with Market Risk Analytics and Modelling Course – Enrol Now.

Straight Out of College? Grasp These Killer Data Science Skills

Straight Out of College? Grasp These Killer Data Science Skills

Data Science is one of the most demanding fields in the present world. Going hand in hand with the Artificial Intelligence, Data Science is showing a colossal growth in the coming years. So, honestly speaking, you should be prepared with all of the cutting-edge tools and up skill yourself accordingly to pace up with the modern world.

According to Derek Steer, CEO of Mode, the world will generate 50 times more data than what we were present in 2011. Moreover, with the data processing power becoming easy and inexpensive for most of the firms, candidates with real skill and a hunger for knowledge would only see their way through till the end, added Steer.

Among various other skills like retail analytics using Python, neural network machine learning Python, which are dominating and/or expected to rule the world of technology in the upcoming years, here we list you some of them:

2

Data Visualization

This is one of the top notch skills that you can find now. It is process of maintaining data with the help of graphical representations. This further makes the interpretation and thereby, the comprehension of data, much easier.

This is an extremely relevant skill which is not to be found among the high schoolers. This makes the undergraduates or post graduates with the knowhow of data visualisation all the more important everywhere.

Data Modelling

Data Modelling is the second most wanted skill that the entire world is seeking for. In a nutshell, Data Modelling is the process of understanding and using data to seek relationships across varied sets of information.

It is, in fact, a skill which is gaining an immense popularity among the fresh graduates. You can also reach Dexlab Analytics to gain an insight of all the industry relevant courses and enrol yourself asap to speed up your career!

Deep Learning and AI using Python

Python

Python is undoubtedly the most demanding language ever in the history of computer science; hence, it enjoys all the attention that it gets.

With its welcoming nature to every other architecture, which is in sharp contradiction to Java and C++, Python is preferred all the way. Secondly, Python is quite a powerful language and effective too, when it comes to bulk data and a need to process them faster.

It is basically an open source program which is easy accessible and largely customised. This is really a gift for upcoming world of Data Science. Thus, Python for data analysis is an invaluable skill that you can develop to make yourself marketable like never before.

We hope you liked our post! You can Take A Deep Look On How Machine Learning Boosts Business Growth! and more such topics on our website.


Interested in a career in Data Analyst?

To learn more about Data Analyst with Advanced excel course – Enrol Now.
To learn more about Data Analyst with R Course – Enrol Now.
To learn more about Big Data Course – Enrol Now.

To learn more about Machine Learning Using Python and Spark – Enrol Now.
To learn more about Data Analyst with SAS Course – Enrol Now.
To learn more about Data Analyst with Apache Spark Course – Enrol Now.
To learn more about Data Analyst with Market Risk Analytics and Modelling Course – Enrol Now.

Statistical Application of R & Python: Know Skewness & Kurtosis and Calculate it Effortlessly

Statistical Application of R & Python: Know Skewness & Kurtosis and Calculate it Effortlessly

This is a blog which shall widen your approach on the Statistical Application using R & Python. You perhaps already have been calculating Geometric Mean using R & Python and are already aware of the Application of Harmonic Mean using R & Python. However, if you are eager to further your knowledge about Skewness & Kurtosis and interested to know of their application using R and Python, then this is the right place.

Skewness:

Skewness is a metric which tells us about the location of my dataset. That is, if you want to know where most of the values are concentrated on an ascending scale.

Skewness is of two kinds: Positive skew and Negative skew. A positively skewed dataset will have most of the values concentrated at the beginning of the scale. Eg: If a woman is asked to rate 100 tinder profiles based on the looks on a scale of 1 – 10, 1 being the ugliest and 10 being the most handsome. Then the resulting ratings will be positively skewed. This is to say that women are harsh critiques of looks.

Now, consider another example: Say if the wealth of the 1% richest people were to be plotted on a scale of say $0 – $200 billion. Then, most of the values will be concentrated at the end of the scale. This will be an example of a negatively skewed dataset.

In essence, skewness is the third central moment about mean and gives us a feel for the location of the data set values. It is recommended to go through STATISTICAL APPLICATION IN R & PYTHON: CHAPTER 1 – MEASURE OF CENTRAL TENDENCY to have an understanding of the Central Tendency and its measures. Having no skewness will mean the data set is fairly symmetrical and has a bell shaped curve.

Where n is the sample size, Xi is the ith X value, X is the average and S is the sample standard deviation.  Note the exponent in the summation.  It is “3”.

Kurtosis:

Kurtosis is a statistical measure that’s used to describe, or Skewness, of observed data around the mean, sometimes referred to as the volatility to volatility. Kurtosis is used generally in the statistical field to describe trends in charts. Kurtosis can be present in a chart with fat tails and a low, even distribution, as well as be present in a chart with skinny tails and a distribution concentrated toward the mean.

Kurtosis for a normal distribution is 3.  Most software packages use the formula:


The types of kurtosis are:-


Application:

A person tries to analyze last 12months interest rate of the investment firm to understand the risk factor for the future investment.

The interest rates are:

12.05%, 13%, 11%, 18%, 10%, 11.5%, 15.08%, 21%, 6%, 8%, 13.2%, 7.5%.

Here is the table:

Months

(One Year)

Interest

Rate (%)

April12.05
May13
June11
July18
August10
September11.5
October15.08
November21
December6
January8
February13.2
March7.5


Calculate skewness & Kurtosis in R:

Calculate skewness & Kurtosis in R:
Calculating the Skewness & Kurtosis of interest rate in R, we get the positive skewed value, which is near to 0. The skewness of the interest rate is 0.5585253.

The kurtosis of the interest rate is 2.690519

Kurtosis is less than 3, so this is Platykurtic distribution.

Calculate Skewness & Kurtosis in Python:

Calculate Skewness & Kurtosis in Python:
Calculating the Skewness & Kurtosis of interest rate in Python, we get the positive skewed value and near from 0. The skewness of the interest rate is 0.641697.

The kurtosis of the interest rate is 0.241602.

Kurtosis is less than 3, so this is Platykurtic distribution.

Conclusion:

Firstly, according to the output of the data the value is positively skewed(R & Python), positive skewness indicates a distribution with an asymmetric tail extending toward more positive values.

And the kurtosis is less than 3 (R & Python), it is a platykurtic distribution. Positive kurtosis indicates a relatively peaked distribution. And the distribution is light tails.

Secondly, the value of the skewness and kurtosis are different in R and Python, but the actual effects are more or less the same. The results are different because skewness and kurtosis are calculated with different formulae or method for the measurement like Bowley’s measure, Pearson’s(First, Second) measures, Fisher’s measure & Moment’s measure. And different software (ex. R, Python, SAS, Excel etc) using different processes to calculate skewness & kurtosis brings the same ultimate result. The numerical values change only when the numbers are also changed. So, we sometimes get different results.

2

There are numerous other blogs that you can follow with Dexlab Analytics. Also, if you want to explore computer vision course Python, neural network machine learning Python and more extensive courses on R & Python, then you can also join us and boost both your passion and career.


Interested in a career in Data Analyst?

To learn more about Data Analyst with Advanced excel course – Enrol Now.
To learn more about Data Analyst with R Course – Enrol Now.
To learn more about Big Data Course – Enrol Now.

To learn more about Machine Learning Using Python and Spark – Enrol Now.
To learn more about Data Analyst with SAS Course – Enrol Now.
To learn more about Data Analyst with Apache Spark Course – Enrol Now.
To learn more about Data Analyst with Market Risk Analytics and Modelling Course – Enrol Now.

Hacking is Wide and Dangerous in India, CBI Reports

Hacking is Wide and Dangerous in India, CBI Reports

The recent conference organized by the Central Bureau of Investigation on Cyber forensic notes that over 22,000 websites were hacked in India between April 2017 – Jan 2018. Not the best of the news for the nation which is largely counting on their citizens to be tech-savvy.

In the conference, CBI disclosed of its plans to build a cutting edge Centralised Technology Vertical (CTV) to fight crimes, voiced by Minister of State for Personnel, Jitendra Singh. The CTV is a huge project involving around Rs 99 crore, which will not only share the real-time information about the cyber attacks but also of the perpetrators.

From young superintendents of police to top brass of security agencies, police forces, law enforcement officers and the Intelligence attended this conference and discussed about the alarming rise of cybercrimes throughout the country.

2

The Major Issue

Jurisdictional issues were a main problem and hit greatly on the investigation in these cases because most of the incidents of cybercrimes are triggered from foreign lands. Though the total loss of money from the recent cybercrimes weren’t disclosed, some debilitating cases in cybercrimes were dicussed once again, which included the loss of USD 171 million from union Bank of India’s Swift.

To End it

To lessen the magnitude of the cybercrimes, the CBI is on their way towards reinforcing them with the state of the art technology. Besides, you can also take up courses in PHP, HTML, Python Certification Training in Delhi, to be informed of the trending languages and be future proof.


Interested in a career in Data Analyst?

To learn more about Data Analyst with Advanced excel course – Enrol Now.
To learn more about Data Analyst with R Course – Enrol Now.
To learn more about Big Data Course – Enrol Now.

To learn more about Machine Learning Using Python and Spark – Enrol Now.
To learn more about Data Analyst with SAS Course – Enrol Now.
To learn more about Data Analyst with Apache Spark Course – Enrol Now.
To learn more about Data Analyst with Market Risk Analytics and Modelling Course – Enrol Now.

Application of Mode using R and Python

Application of Mode using R and Python

Mode, for a given set of observations, is that value of the variable, where the variable occurs with the maximum or the highest frequency.

This blog is in continuation with STATISTICAL APPLICATION IN R & PYTHON: CHAPTER 1 – MEASURE OF CENTRAL TENDENCY. However, here we will elucidate the Mode and its application using Python and R.

Mode is the most typical or prevalent value, and at times, represents the true characteristics of the distribution as a measure of central tendency.

Application:

The numbers of the telephone calls received in 245 successive one minute intervals at an exchange are shown in the following frequency distribution table:


No of Calls
Frequency
0
14
1
21
2
25
3
43
4
51
5
40
6
51
7
51
8
39
9
12
Total
245


 [Note: Here we assume total=245 when we calculate Mean from the same data]

Evaluate the Mode from the data.

Evaluate the Mode from the data

Calculate Mode in R:

Calculate mode in R from the data, i.e. the most frequent number in the data is 51.

The number 51 repeats itself in 5, 7 and 8 phone calls respectively.

Calculate Median in Python:

First, make a data frame for the data.

Now, calculate the mode from the data frame.

Calculate mode in Python from the data, i.e. the most frequent number in the data is 51.

The number 51 repeats itself in 5, 7 and 8 phone calls respectively.

Mode is used in business, because it is most likely to occur. Meteorological forecasts are, in fact, based on mode calculations.

The modal wage of a group of the workers is the wages which the largest numbers of workers receive, and as such, this wage may be considered as the representative wage of the group.

In this particular data set we use the mode function to know the occurrence of the highest number of phone calls.

It will thus, help the Telephone Exchange to analyze their data flawlessly.

2

Note – As you have already gone through this post, now, if you are interested to know about the Harmonic Mean, you can check our post on the APPLICATION OF HARMONIC MEAN USING R AND PYTHON.

Dexlab Analytics is a formidable institute for Deep learning for computer vision with PythonHere, you would also find more information about courses in Python, Deep LearningMachine Learning, and Neural Networks which will come with proper certification at the end.

We are there in the Social Media where you can follow us both in Facebook and Instagram.


Interested in a career in Data Analyst?

To learn more about Data Analyst with Advanced excel course – Enrol Now.
To learn more about Data Analyst with R Course – Enrol Now.
To learn more about Big Data Course – Enrol Now.

To learn more about Machine Learning Using Python and Spark – Enrol Now.
To learn more about Data Analyst with SAS Course – Enrol Now.
To learn more about Data Analyst with Apache Spark Course – Enrol Now.
To learn more about Data Analyst with Market Risk Analytics and Modelling Course – Enrol Now.

Application of Harmonic Mean using R and Python

Application of Harmonic Mean using R and Python

Harmonic mean, for a set of observations is the number of observations divided by the sum of the reciprocals of the values and it cannot be defined if some of the values are zero.

This blog is in continuation with STATISTICAL APPLICATION IN R & PYTHON: CHAPTER 1 – MEASURE OF CENTRAL TENDENCY. However, here we will discover Harmonic mean and its application using Python and R.

2

Application:

A milk company sold milk at the rates of 10,16.5,5,13.07,15.23,14.56,12.5,12,30,32, 15.5, 16 rupees per liter in twelve different months (January-December), If an equal amount of money is spent on milk by a family in the ten months. Calculate the average price in rupees per month.

Table for the problem:

Month

Rates (Rupees/Liter)

January

10

February

16.5

March

5

April

13.07

May

15.23

June

14.56

July

12.5

August

12

September

30

October

32

November

15.5

December

16

Calculate Harmonic Mean in R:-

So, the average rate of the milk in rupees/liter is 12.95349 = 13 Rs/liter (Approx)

We get this answer from the Harmonic Mean, calculated in R.

Calculate Harmonic Mean in Python:-

First, make a data frame of the available data in Python.

Now, calculate the Harmonic mean from the following data frame.

So, the average rate of the milk in rupees/liter is 12.953491609077956 = 13 Rs/Liter (Approx)

We get this answer from Harmonic mean, calculated in Python.

Summing it Up:

In this data, we have a few large values which are putting an effect on the average value, if we calculate the average in Arithmetic mean, but in Harmonic mean, we get a perfect average from the data, and also for calculating the average rate.

Use of Harmonic mean is very limited. Harmonic mean gives the largest value to the smallest item and smallest value to the largest item.

Where there are a few extremely large or small values, Harmonic mean is preferable to Arithmetic mean as an average.

The Harmonic mean is mainly useful in averages involving time, rate & price.

Deep Learning and AI using Python

Note – If you want to learn the calculation of Geometric Mean, you can check our post on CALCULATING GEOMETRIC MEAN USING R AND PYTHON.

Dexlab Analytics is a peerless institute for Python Certification Training in Delhi. Therefore, for tailor-made courses in Python, Deep Learning, Machine Learning, Neural Networks, reach us ASAP!

You can even follow us on Social Media. We are available both in Facebook and Instagram.


Interested in a career in Data Analyst?

To learn more about Data Analyst with Advanced excel course – Enrol Now.
To learn more about Data Analyst with R Course – Enrol Now.
To learn more about Big Data Course – Enrol Now.

To learn more about Machine Learning Using Python and Spark – Enrol Now.
To learn more about Data Analyst with SAS Course – Enrol Now.
To learn more about Data Analyst with Apache Spark Course – Enrol Now.
To learn more about Data Analyst with Market Risk Analytics and Modelling Course – Enrol Now.

Python is the Leader in Data Science: Know Why

Python is the Leader in Data Science: Know Why

From being simple and effective to being updated and thereby, solving almost everything that the booming industry of Data Science of today can look up to, Python boasts of it all.

It’s not a shock that Python is finding its uses in an array of industries. It is, in fact, the language that the Data Scientists rely on. Thus, our tailored courses of Python Certification Training in Delhi would be helpful for all in this digital age.

Let’s see some more of the advantages for which Python stands distinguished among the other programming languages:

Handling Data without a Hassle

The field of Data Science is entrusted with the handling of incredibly large amounts of data which is found to be intricate to compute. However, with Python, it is now simpler than ever. Any of the other high-level programming languages would make it rather difficult and messy compared to the peerless Python, if we talk about analytical and quantitative computing.

Open Source Programming Language

Python is an open-source programming language. Wonder why this programming language is the most preferred still?

It truly opens a whole lot of opportunities that the language can build upon, being open-source in nature. Furthermore, there is not a single restriction regarding Python. Thus, you can be as creative as you wish on this programming language.

It is Powerful and Easy to Use

Python is an easy language right from the start for which it has become so popular. Any of the beginners with just the rudimentary knowledge can start fine with Python. Besides, once you are on with this programming language, you can start progressing with it day by day at your own pace.

The implementation of the code has a slower approach in the languages: Java, C and C#, but if you try Python, you would discover that it is fast to debug and effective to perform. The prompt results in coding would aid with an added boost in your work.

In the Library of Python

Python is an all-absorbing language that even supports the cutting edge technologies of Machine Learning and Artificial Intelligence. And on top of it, Python also offers its users a colossal database of libraries. Therefore, you can simply check in the libraries, import them and then implement all of them in your day to day coding.

It is Highly Scalable

In the parameter of scalability, Python superbly stands out. The programming languages: R and Java certainly falls short in this factor. Thus, with the ease of scalability and quicker turnaround times, data scientists and nearly all of the organisations exploring Data Science, are choosing Python over any other existing languages.

Data Science Machine Learning Certification

It is Peerless in Visualisation and Graphics

As the smooth rendering of quality graphics and visualisation is the demand of the age, Python fits in quite comfortably here. With an exhaustive range of options for visualisation, which are simple and efficient, the world of Data Science is rooting for Python.

With all the benefits that you can reap, Python for data analysis is a must, if you want to be absorbed in the industry of Data Science.


.

Calculating Geometric Mean Using R and Python

Calculating Geometric Mean Using R and Python

In this blog, we are going to discuss the Geometric Mean and its application using Python and R.

Geometric Mean of group of ‘n’ observations is the nth root of their product. It is defined only when all observations have the same sign and none of them is zero.

Application:

Calculate the Geometric Mean of the salary increment of 12 employees. From the following table, calculate the average salary increment of the year (2019-2020):-


Name

Salary Increment in

Percentage (%)

Ritesh

10.09%

Heena

15.45%

Kritika

9%

Anuradha

13.06%

Gaurav

20%

Prakash

14%

Aarti

16%

Meena

6.25%

Utkarsh

12.85%

Chirag

10%

Neha

18%

Smrita

21.36%


Calculate the Geometric Mean in R:

So, from the data of the employee’s in R we calculate the G.M. and get that the average salary increment in the year (2019-2020) = 13.17618 or 13.18% (approx).

Calculate the Geometric Mean in Python:

First, make a data frame in Python from the following table.

Now, calculate the Geometric Mean from the data-frame.

So, from the data of the employee’s in Python we calculate the G.M. and get that the average salary increment in the year (2019-2020) = 13.176183416401196 or 13.18% (approx).

We use Geometric Mean for calculating ratios, rates and percentages. And it is not affected by the extreme value or outlier. In this particular problem, we use Geometric Mean because an average of the salary increment of the employee’s not affected by the extreme highest or extreme lowest value, that’s why the salary increment rates of Meena and Smrita do not have any effect on the total average rate.

Geometric Mean gives small value than Arithmetic Mean.

2

Note: This is a continuation of the blog: Statistical Application in R & Python: Chapter 1 – Measure of Central Tendency. It would be better to go through the first installment and then read this one. More blogs are to be followed, so stay tuned.

DexLab Analytics is a premier Python training institute in Delhi. Our industry-relevant courses are carefully crafted by experts. Follow us on Facebook and Instagram.


Interested in a career in Data Analyst?

To learn more about Data Analyst with Advanced excel course – Enrol Now.
To learn more about Data Analyst with R Course – Enrol Now.
To learn more about Big Data Course – Enrol Now.

To learn more about Machine Learning Using Python and Spark – Enrol Now.
To learn more about Data Analyst with SAS Course – Enrol Now.
To learn more about Data Analyst with Apache Spark Course – Enrol Now.
To learn more about Data Analyst with Market Risk Analytics and Modelling Course – Enrol Now.

Call us to know more