neural network machine learning python Archives - Page 3 of 3 - DexLab Analytics | Big Data Hadoop SAS R Analytics Predictive Modeling & Excel VBA

Application of Mode using R and Python

Application of Mode using R and Python

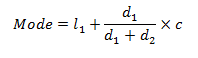
Mode, for a given set of observations, is that value of the variable, where the variable occurs with the maximum or the highest frequency.

This blog is in continuation with STATISTICAL APPLICATION IN R & PYTHON: CHAPTER 1 – MEASURE OF CENTRAL TENDENCY. However, here we will elucidate the Mode and its application using Python and R.

Mode is the most typical or prevalent value, and at times, represents the true characteristics of the distribution as a measure of central tendency.

Application:

The numbers of the telephone calls received in 245 successive one minute intervals at an exchange are shown in the following frequency distribution table:


No of Calls
Frequency
0
14
1
21
2
25
3
43
4
51
5
40
6
51
7
51
8
39
9
12
Total
245


 [Note: Here we assume total=245 when we calculate Mean from the same data]

Evaluate the Mode from the data.

Evaluate the Mode from the data

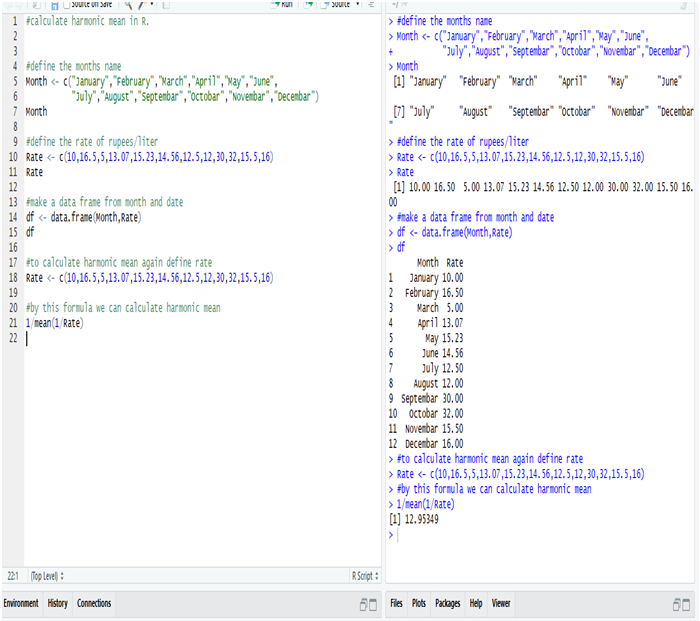
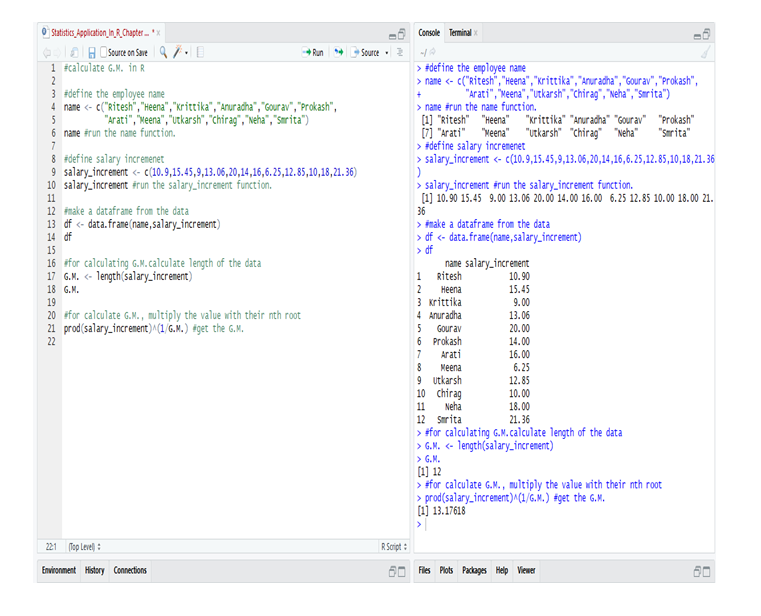
Calculate Mode in R:

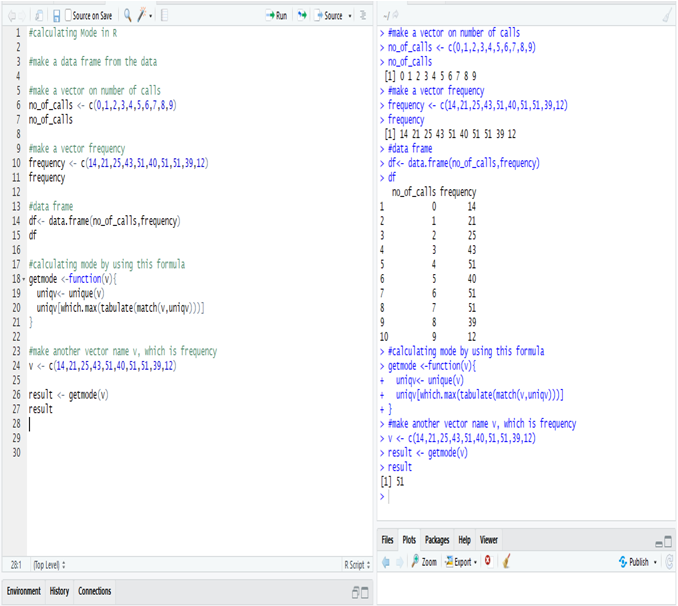
Calculate mode in R from the data, i.e. the most frequent number in the data is 51.

The number 51 repeats itself in 5, 7 and 8 phone calls respectively.

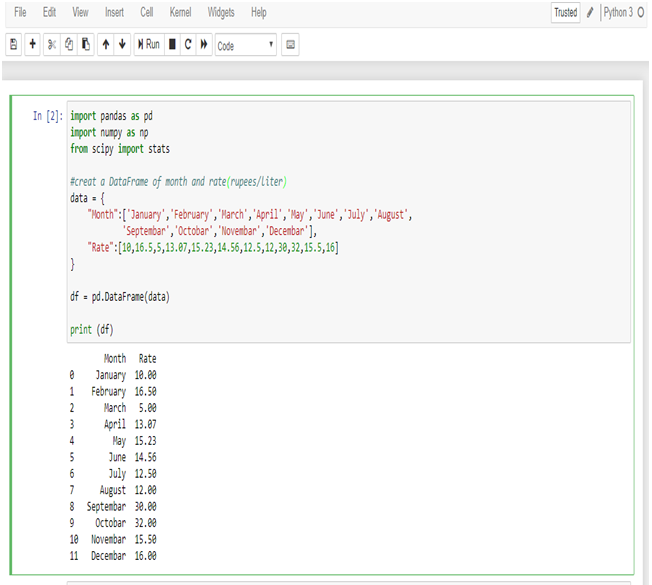
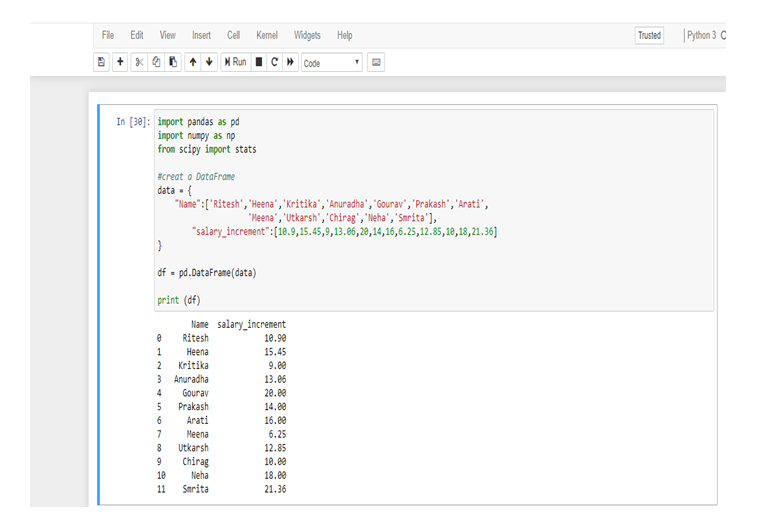
Calculate Median in Python:

First, make a data frame for the data.

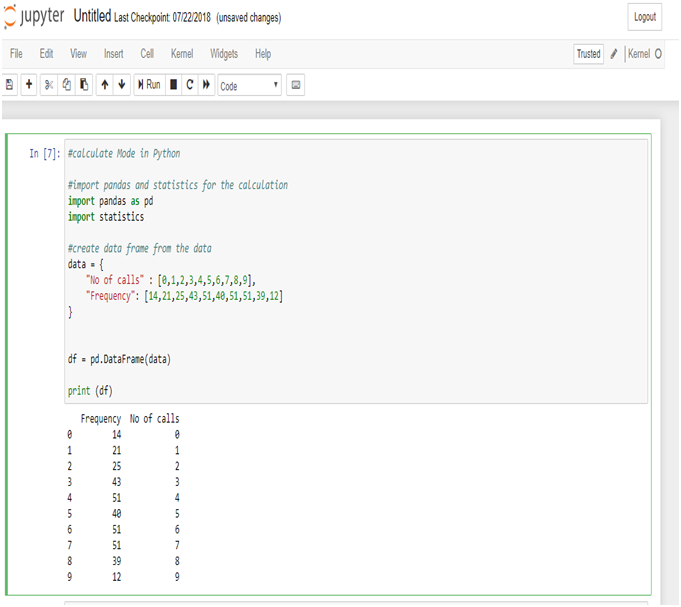
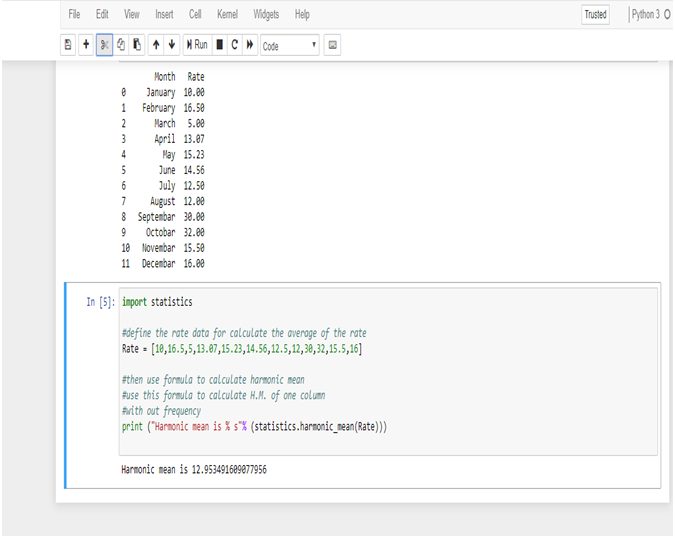
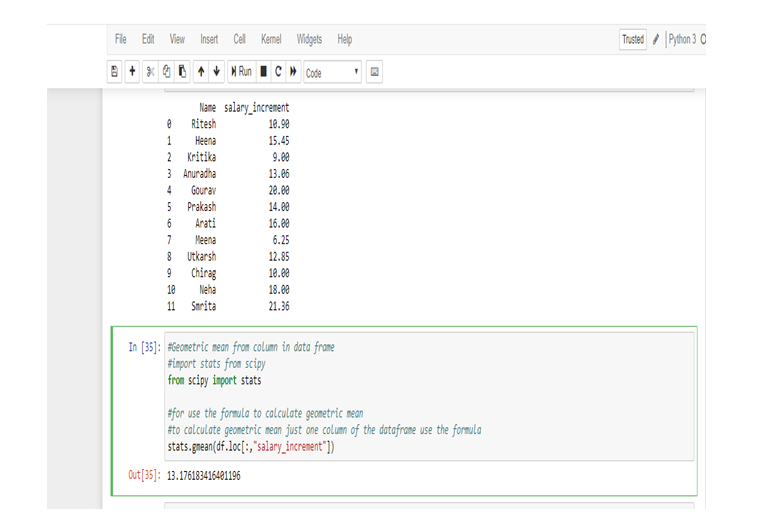
Now, calculate the mode from the data frame.

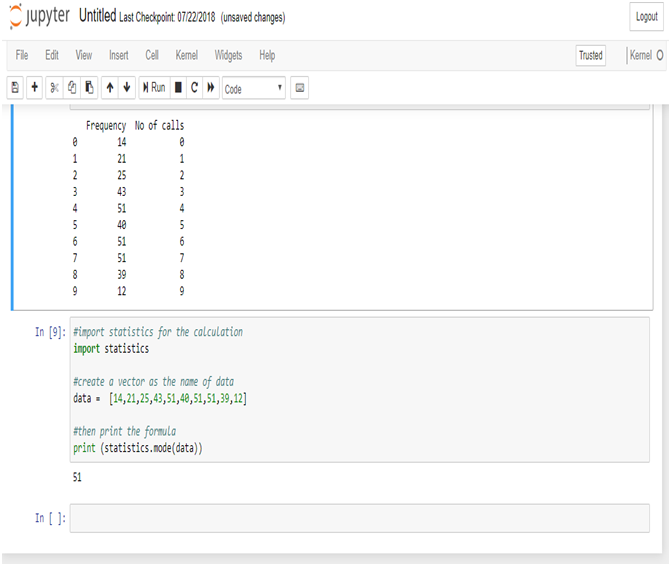
Calculate mode in Python from the data, i.e. the most frequent number in the data is 51.

The number 51 repeats itself in 5, 7 and 8 phone calls respectively.

Mode is used in business, because it is most likely to occur. Meteorological forecasts are, in fact, based on mode calculations.

The modal wage of a group of the workers is the wages which the largest numbers of workers receive, and as such, this wage may be considered as the representative wage of the group.

In this particular data set we use the mode function to know the occurrence of the highest number of phone calls.

It will thus, help the Telephone Exchange to analyze their data flawlessly.

2

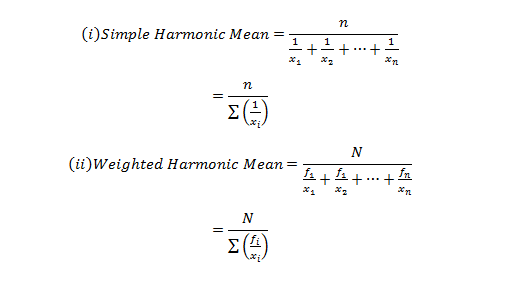
Note – As you have already gone through this post, now, if you are interested to know about the Harmonic Mean, you can check our post on the APPLICATION OF HARMONIC MEAN USING R AND PYTHON.

Dexlab Analytics is a formidable institute for Deep learning for computer vision with PythonHere, you would also find more information about courses in Python, Deep LearningMachine Learning, and Neural Networks which will come with proper certification at the end.

We are there in the Social Media where you can follow us both in Facebook and Instagram.


Interested in a career in Data Analyst?

To learn more about Data Analyst with Advanced excel course – Enrol Now.
To learn more about Data Analyst with R Course – Enrol Now.
To learn more about Big Data Course – Enrol Now.

To learn more about Machine Learning Using Python and Spark – Enrol Now.
To learn more about Data Analyst with SAS Course – Enrol Now.
To learn more about Data Analyst with Apache Spark Course – Enrol Now.
To learn more about Data Analyst with Market Risk Analytics and Modelling Course – Enrol Now.

Application of Harmonic Mean using R and Python

Application of Harmonic Mean using R and Python

Harmonic mean, for a set of observations is the number of observations divided by the sum of the reciprocals of the values and it cannot be defined if some of the values are zero.

This blog is in continuation with STATISTICAL APPLICATION IN R & PYTHON: CHAPTER 1 – MEASURE OF CENTRAL TENDENCY. However, here we will discover Harmonic mean and its application using Python and R.

2

Application:

A milk company sold milk at the rates of 10,16.5,5,13.07,15.23,14.56,12.5,12,30,32, 15.5, 16 rupees per liter in twelve different months (January-December), If an equal amount of money is spent on milk by a family in the ten months. Calculate the average price in rupees per month.

Table for the problem:

Month

Rates (Rupees/Liter)

January

10

February

16.5

March

5

April

13.07

May

15.23

June

14.56

July

12.5

August

12

September

30

October

32

November

15.5

December

16

Calculate Harmonic Mean in R:-

So, the average rate of the milk in rupees/liter is 12.95349 = 13 Rs/liter (Approx)

We get this answer from the Harmonic Mean, calculated in R.

Calculate Harmonic Mean in Python:-

First, make a data frame of the available data in Python.

Now, calculate the Harmonic mean from the following data frame.

So, the average rate of the milk in rupees/liter is 12.953491609077956 = 13 Rs/Liter (Approx)

We get this answer from Harmonic mean, calculated in Python.

Summing it Up:

In this data, we have a few large values which are putting an effect on the average value, if we calculate the average in Arithmetic mean, but in Harmonic mean, we get a perfect average from the data, and also for calculating the average rate.

Use of Harmonic mean is very limited. Harmonic mean gives the largest value to the smallest item and smallest value to the largest item.

Where there are a few extremely large or small values, Harmonic mean is preferable to Arithmetic mean as an average.

The Harmonic mean is mainly useful in averages involving time, rate & price.

Deep Learning and AI using Python

Note – If you want to learn the calculation of Geometric Mean, you can check our post on CALCULATING GEOMETRIC MEAN USING R AND PYTHON.

Dexlab Analytics is a peerless institute for Python Certification Training in Delhi. Therefore, for tailor-made courses in Python, Deep Learning, Machine Learning, Neural Networks, reach us ASAP!

You can even follow us on Social Media. We are available both in Facebook and Instagram.


Interested in a career in Data Analyst?

To learn more about Data Analyst with Advanced excel course – Enrol Now.
To learn more about Data Analyst with R Course – Enrol Now.
To learn more about Big Data Course – Enrol Now.

To learn more about Machine Learning Using Python and Spark – Enrol Now.
To learn more about Data Analyst with SAS Course – Enrol Now.
To learn more about Data Analyst with Apache Spark Course – Enrol Now.
To learn more about Data Analyst with Market Risk Analytics and Modelling Course – Enrol Now.

Python is the Leader in Data Science: Know Why

Python is the Leader in Data Science: Know Why

From being simple and effective to being updated and thereby, solving almost everything that the booming industry of Data Science of today can look up to, Python boasts of it all.

It’s not a shock that Python is finding its uses in an array of industries. It is, in fact, the language that the Data Scientists rely on. Thus, our tailored courses of Python Certification Training in Delhi would be helpful for all in this digital age.

Let’s see some more of the advantages for which Python stands distinguished among the other programming languages:

Handling Data without a Hassle

The field of Data Science is entrusted with the handling of incredibly large amounts of data which is found to be intricate to compute. However, with Python, it is now simpler than ever. Any of the other high-level programming languages would make it rather difficult and messy compared to the peerless Python, if we talk about analytical and quantitative computing.

Open Source Programming Language

Python is an open-source programming language. Wonder why this programming language is the most preferred still?

It truly opens a whole lot of opportunities that the language can build upon, being open-source in nature. Furthermore, there is not a single restriction regarding Python. Thus, you can be as creative as you wish on this programming language.

It is Powerful and Easy to Use

Python is an easy language right from the start for which it has become so popular. Any of the beginners with just the rudimentary knowledge can start fine with Python. Besides, once you are on with this programming language, you can start progressing with it day by day at your own pace.

The implementation of the code has a slower approach in the languages: Java, C and C#, but if you try Python, you would discover that it is fast to debug and effective to perform. The prompt results in coding would aid with an added boost in your work.

In the Library of Python

Python is an all-absorbing language that even supports the cutting edge technologies of Machine Learning and Artificial Intelligence. And on top of it, Python also offers its users a colossal database of libraries. Therefore, you can simply check in the libraries, import them and then implement all of them in your day to day coding.

It is Highly Scalable

In the parameter of scalability, Python superbly stands out. The programming languages: R and Java certainly falls short in this factor. Thus, with the ease of scalability and quicker turnaround times, data scientists and nearly all of the organisations exploring Data Science, are choosing Python over any other existing languages.

Data Science Machine Learning Certification

It is Peerless in Visualisation and Graphics

As the smooth rendering of quality graphics and visualisation is the demand of the age, Python fits in quite comfortably here. With an exhaustive range of options for visualisation, which are simple and efficient, the world of Data Science is rooting for Python.

With all the benefits that you can reap, Python for data analysis is a must, if you want to be absorbed in the industry of Data Science.


.

Calculating Geometric Mean Using R and Python

Calculating Geometric Mean Using R and Python

In this blog, we are going to discuss the Geometric Mean and its application using Python and R.

Geometric Mean of group of ‘n’ observations is the nth root of their product. It is defined only when all observations have the same sign and none of them is zero.

Application:

Calculate the Geometric Mean of the salary increment of 12 employees. From the following table, calculate the average salary increment of the year (2019-2020):-


Name

Salary Increment in

Percentage (%)

Ritesh

10.09%

Heena

15.45%

Kritika

9%

Anuradha

13.06%

Gaurav

20%

Prakash

14%

Aarti

16%

Meena

6.25%

Utkarsh

12.85%

Chirag

10%

Neha

18%

Smrita

21.36%


Calculate the Geometric Mean in R:

So, from the data of the employee’s in R we calculate the G.M. and get that the average salary increment in the year (2019-2020) = 13.17618 or 13.18% (approx).

Calculate the Geometric Mean in Python:

First, make a data frame in Python from the following table.

Now, calculate the Geometric Mean from the data-frame.

So, from the data of the employee’s in Python we calculate the G.M. and get that the average salary increment in the year (2019-2020) = 13.176183416401196 or 13.18% (approx).

We use Geometric Mean for calculating ratios, rates and percentages. And it is not affected by the extreme value or outlier. In this particular problem, we use Geometric Mean because an average of the salary increment of the employee’s not affected by the extreme highest or extreme lowest value, that’s why the salary increment rates of Meena and Smrita do not have any effect on the total average rate.

Geometric Mean gives small value than Arithmetic Mean.

2

Note: This is a continuation of the blog: Statistical Application in R & Python: Chapter 1 – Measure of Central Tendency. It would be better to go through the first installment and then read this one. More blogs are to be followed, so stay tuned.

DexLab Analytics is a premier Python training institute in Delhi. Our industry-relevant courses are carefully crafted by experts. Follow us on Facebook and Instagram.


Interested in a career in Data Analyst?

To learn more about Data Analyst with Advanced excel course – Enrol Now.
To learn more about Data Analyst with R Course – Enrol Now.
To learn more about Big Data Course – Enrol Now.

To learn more about Machine Learning Using Python and Spark – Enrol Now.
To learn more about Data Analyst with SAS Course – Enrol Now.
To learn more about Data Analyst with Apache Spark Course – Enrol Now.
To learn more about Data Analyst with Market Risk Analytics and Modelling Course – Enrol Now.

Call us to know more