MS Excel online training Archives - DexLab Analytics | Big Data Hadoop SAS R Analytics Predictive Modeling & Excel VBA

Microsoft Excel is Revamping Itself and We Can’t be Happier

Good News: Your favorite Microsoft Excel is about to get a lot smarter, and tech-savvy.

 
Microsoft Excel is Revamping Itself and We Can’t be Happier
 

How? Thanks to machine learning and improved connection with the outside world.


Recently, Microsoft’s general manager for Office, Jared Spataro and company’s director of Office 365 ecosystem marketing, Rob Howard talked about how Excel is soon going to understand more about the inputs given and drag out additional information from the internet, as and when deemed necessary.

Continue reading “Microsoft Excel is Revamping Itself and We Can’t be Happier”

How Much Excel Excels in Deriving Rich ‘Insights’ from Your Data

For millions, Excel is the ultimate tool to understand data and frame insights. It makes analysis easy as pie and intuitive for all. Those who are well acquainted with Excel might know about Insights – it is the newest artificial intelligence-backed capability that rolled out in preview to Office Insiders last month.

How Much Excel Excels in Deriving Rich ‘Insights’ from Your Data

A quick note on Insights

Insights is a brand new service used to highlight patterns it identifies from your data, aiding you discover and inspect new insights, like outliers, trends and several other relevant visualizations and analyses. It will take special care to find out intriguing trends in your data and offer concise summaries with charts and PivotTables. As it’s powered by machine learning, the capability to churn out advanced analysis tends to increase as usage grows.

Continue reading “How Much Excel Excels in Deriving Rich ‘Insights’ from Your Data”

10 Amazing Excel Templates to Help Maintain an Organized Budget

10 Amazing Excel Templates to Help Maintain an Organized Budget

Managing a proper budget is an essential task. Professionals working in enterprises are somehow involved in performing this task to some degree. Fortunately, a handful number of budgeting Excel templates is available online – check out some of our favorites:

Back to the basics, budget is something more than an educative, future projection of what should happen to a company’s financial position over a specific course of time, based on the latest trends, current data and previous history. The accuracy of the entire forecast depends on the quality of financial data accumulated during the budget period – it is here that a robust set of data collection tools saves the day.

Here’s a roundup of some of the most useful and easy-to-use budget-related MS Excel templates – most of them are available and are for free. Let’s check them out:

Microsoft Office Templates

When it comes to software, Microsoft remains unbeatable. It offers few applaud-worthy customizable office templates that help you become more productive in implementing programs, perform tasks and track financial budgets. Some of them are below:

Business Expense Report

Business travel expense report is one of the most popular budget reporting activities. For reimbursement of travel expenses, the employee needs to present detailed accounts of expenditures. The Excel template in here is easy to fill up, less time-consuming and removes the frustration caused due to tracking expenses in a business trip.

Project Budget

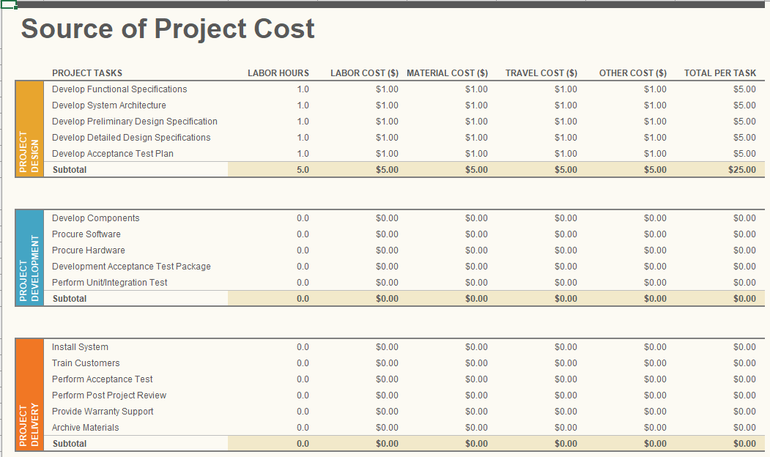
Project Budget template helps you evaluate your project’s design, development and delivery costs so as to monitor actual expenses that occur thereafter.
 

bfreeexcelbudget

Profit and Loss Statement

An all-inclusive profit and loss statement is fundamental for any enterprise. Whether it’s on a departmental level or encompassing an entire organization, determining profit and loss in the financial statement is important to put into focus the problematic areas of your business. The Excel template helps in calculating both the actual and budget revenues and expenses over a pre-determined period of time.

Balance Sheet

Balance Sheet is an effective financial budgetary document that enlists all the assets and liabilities, while evaluating their budgetary values, depreciation rates and amortization records, and the job gets easier when it’s done on an Excel template.

Activity-based Cost Tracker

The activity-based cost tracker template provides you a visual representation of standard, administrative, direct and indirect costs in relation to production. It also helps in monitoring the cost of each unit, while helping you manipulate your budget plan, if other factors, including costs fluctuate.

Small Business Cash Flow Projection

Managing cash flow is more significant than determining profit and loss and balance sheet and by properly using the Excel template small businesses will do well for themselves anytime.

Simple Invoice

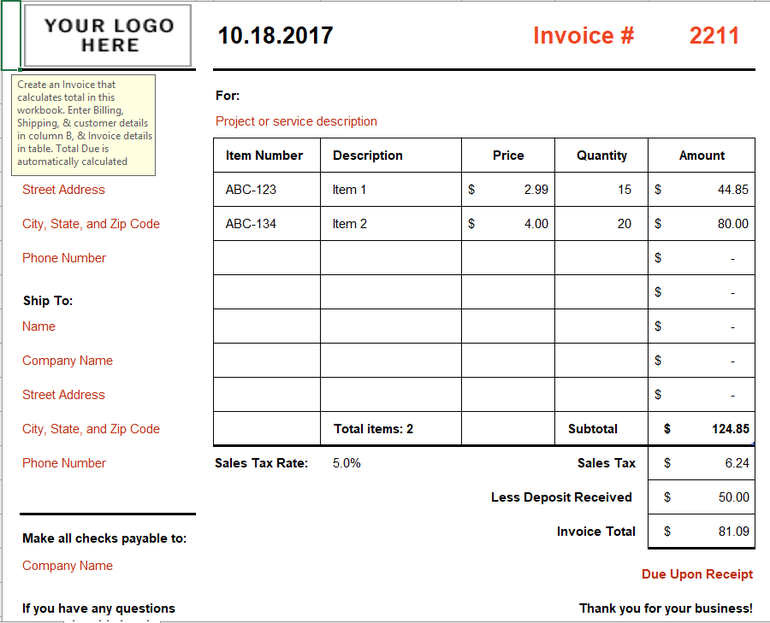
In the business circle, an Excel template on invoice gains a lot of accolades. This kind of Excel template automatically calculates the totals and subtotals so that the businesses don’t have to lose any of its valuable time.
cfreeexcelbudget

Beyond the jurisdiction of Microsoft, here are few other budget-related Excel templates:

Year-round IT Budget Template

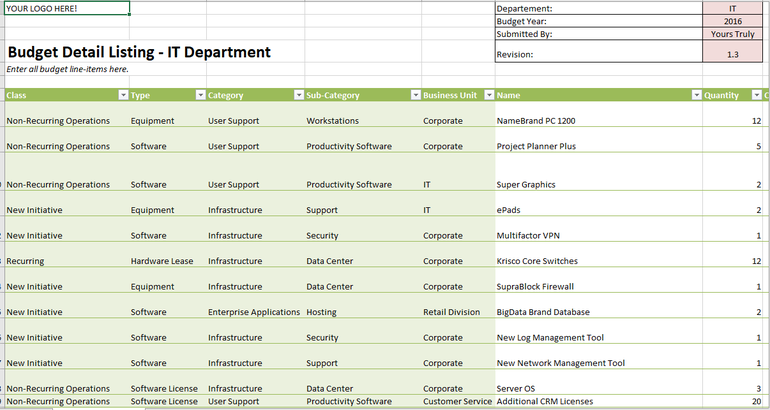
From the curators of Tech Pro Research team, this cutting edge Excel template helps you track all your spending, administer unplanned expenditure, classify expenses, and highlight key data, like cost of hiring new recruits, contract end dates and recurring payments.
 

afreeexcelbudget

Systems Downtime Expense Calculator

Taking care of an enterprise network is the most demanding job role for any IT administrator. Nothing in this wide world will be more traumatic than network downtime. Hence, this Excel template assist you place a dollar amount on your network downtime.

Computer Hardware Depreciation Calculator

This Excel worksheet helps you determine depreciation for your equipment – finding the rate of depreciation is not a piece of cake – there are many methods of deprecation to take into account.

Do you want to know more about how to use MS Excel for better budgeting for your business? Advanced Excel course by DexLab Analytics would be perfect for you. Excel certification in Delhi helps you grow in your career, so enroll today!


Interested in a career in Data Analyst?

To learn more about Data Analyst with Advanced excel course – Enrol Now.
To learn more about Data Analyst with R Course – Enrol Now.
To learn more about Big Data Course – Enrol Now.

To learn more about Machine Learning Using Python and Spark – Enrol Now.
To learn more about Data Analyst with SAS Course – Enrol Now.
To learn more about Data Analyst with Apache Spark Course – Enrol Now.
To learn more about Data Analyst with Market Risk Analytics and Modelling Course – Enrol Now.
Microsoft Excel or Google Sheets: Which is better for Business?

Getting all work done from inside a browser through an internet-enable computer is no mean feat. Just after Google cracked the idea, Microsoft and Apple soon followed the bandwagon and developed online office suites of their own.


Microsoft Excel or Google Sheets: Which is better for Business?


So, do you think Google deserves the tag of top dog or should you give accolades to Microsoft for developing a feature-rich office suite?

Continue reading “Microsoft Excel or Google Sheets: Which is better for Business?”

We Have an Announcement: Uncover Your Dormant Excellence With Excel!

Join our free demo session on Advanced MS Excel:

Join our free demo session on Advanced MS Excel:


Team DexLab Analytics remains dedicated at offering data knowledge to keen learners. It is with great pleasure that we announce yet another free demo session to be held this Sunday, on the 27th of November, 2016. This time we will be discussing some concepts of Advanced MS Excel. It is a classroom demo session to be held at our Gurgaon branch.
Continue reading “We Have an Announcement: Uncover Your Dormant Excellence With Excel!”

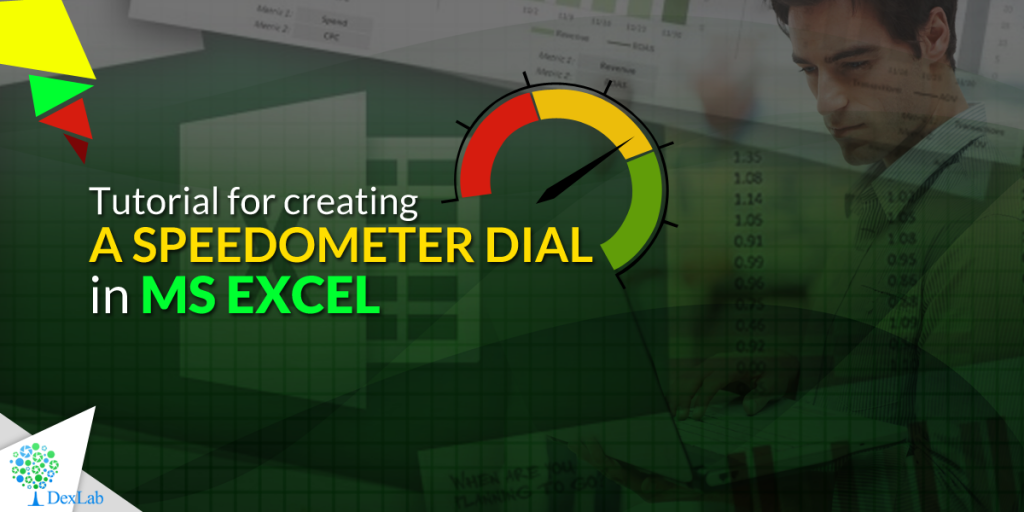
Tutorial for creating a Speedometer dial in MS Excel

 Tutorial for creating a Speedometer dial in MS Excel

Here in this video tutorial we have discussed in detailed steps, how to create a Speedometer chart in MS Excel. A Speedometer chart is often called as a gauge chart and combines two different type of charts, a pie chart and a doughnut chart.

The Speedometer dial is made with the help of using a Doughnut chart and needle is actually a combination of two types of charts, another doughnut chart and a pie chart.

A speedometer chart or a gauge chart can be created in other data visualization software as well, like for instance in Tableau and is usually easier to create due to availability of better controls and features.  It is due to the simplistic nature of these charts which is well adjusted to context of data and is a great use of space in a spreadsheet that charts like these are popular with non-data executives. Usually such non-data personnel do not want to dig deep into the contextual details like an analyst which is why these charts are great for using in a presentation where diverse departmental executives will be participating.

Gauge charts pack in a lot of horsepower and form a sort of ubiquitous symbol when it comes to understanding business metrics from an analytical point of view. So, learn to create these charts with our simple tutorial and for more such interesting lessons on data analysis software, join us every day as we share technical posts based on data on a regular basis.


Interested in a career in Data Analyst?

To learn more about Data Analyst with Advanced excel course – Enrol Now.
To learn more about Data Analyst with R Course – Enrol Now.
To learn more about Big Data Course – Enrol Now.

To learn more about Machine Learning Using Python and Spark – Enrol Now.
To learn more about Data Analyst with SAS Course – Enrol Now.
To learn more about Data Analyst with Apache Spark Course – Enrol Now.
To learn more about Data Analyst with Market Risk Analytics and Modelling Course – Enrol Now.

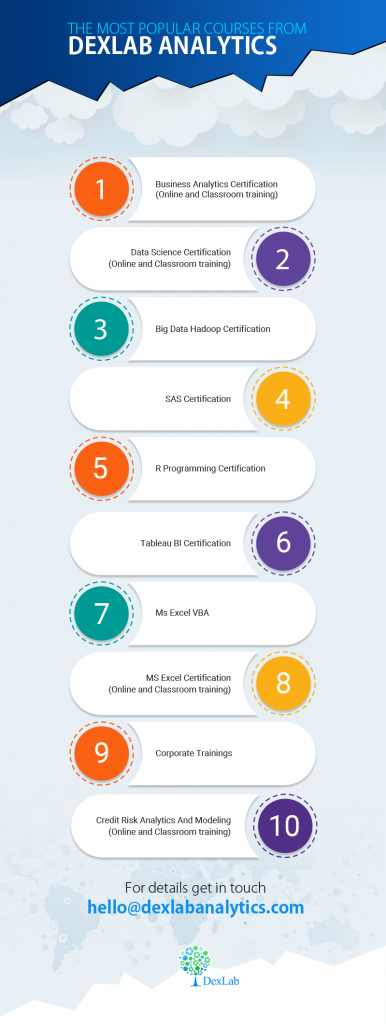
Infographic: List of Our Courses from Dexlab Analytics

infographic6


View our infographic on the list of most in-demand courses among data enthusiasts who want to advance their careers with the top trends in the job market. Come to DexLab Analytics and launch your career in light speed with the requisite skills to harness the power of data.


Our Courses: MS Excel, Data Science, Business Analytics

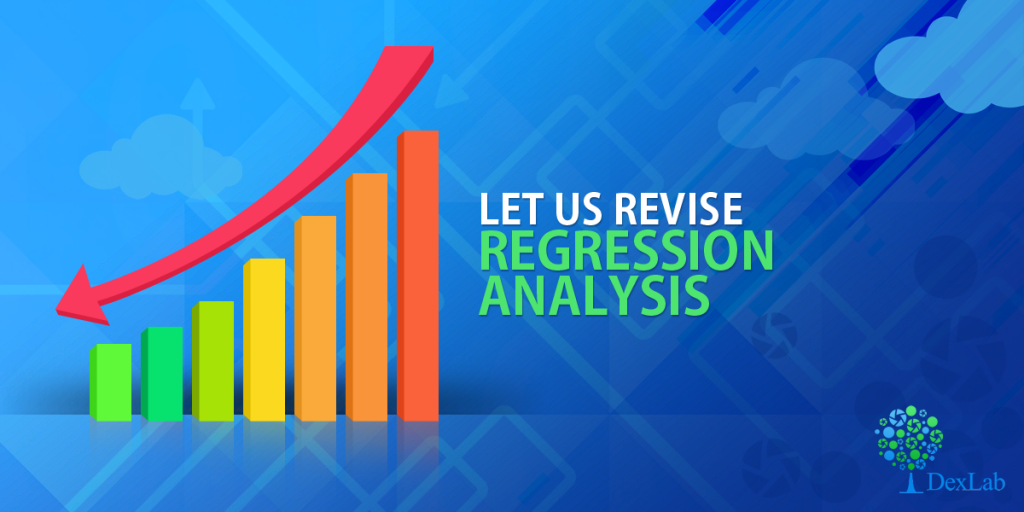
Let us Revise Regression Analysis

Let us revise regression analysis

By now every business owner and manager is aware of the latest megatrend related to data analysis and knows that they should make data-driven decisions only at work. Gut feeling and winging it are now practices outdates as they have proved time and again that they fail. But the problem still remains in the know-how of parsing through all the layers of data streaming into your systems. Do you have the requisite know how?

Luckily for you, you may not be the one to crunch all the numbers (phew!). You pay other robotic data analytics personnel to do that for you. But you must correctly understand the analysis report that is handed over to you for interpretation after your colleagues are done with all the heavy lifting. A common practice is the realm of data analysis is regression analysis. Continue reading “Let us Revise Regression Analysis”

Call us to know more