Machine Learning with Python Courses Archives - DexLab Analytics | Big Data Hadoop SAS R Analytics Predictive Modeling & Excel VBA

Time Series Analysis Part I


A time series is a sequence of numerical data in which each item is associated with a particular instant in time. Many sets of data appear as time series: a monthly sequence of the quantity of goods shipped from a factory, a weekly series of the number of road accidents, daily rainfall amounts, hourly observations made on the yield of a chemical process, and so on. Examples of time series abound in such fields as economics, business, engineering, the natural sciences (especially geophysics and meteorology), and the social sciences.

  • Univariate time series analysis- When we have a single sequence of data observed over time then it is called univariate time series analysis.
  • Multivariate time series analysis – When we have several sets of data for the same sequence of time periods to observe then it is called multivariate time series analysis.

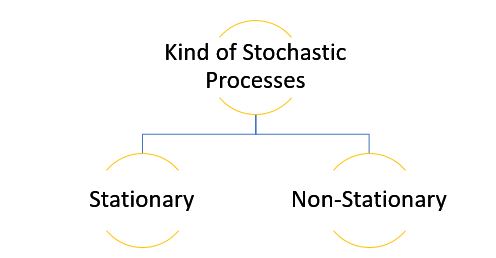
The data used in time series analysis is a random variable (Yt) where t is denoted as time and such a collection of random variables ordered in time is called random or stochastic process.

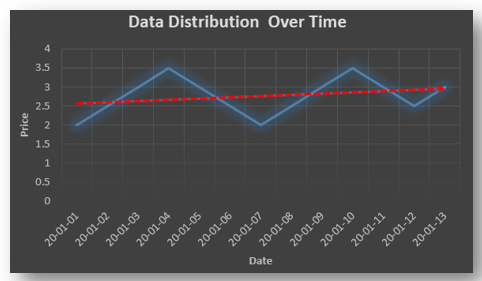
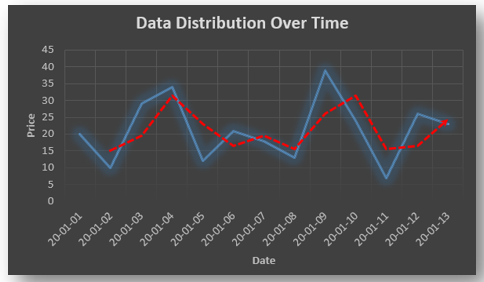
Stationary: A time series is said to be stationary when all the moments of its probability distribution i.e. mean, variance , covariance etc. are invariant over time. It becomes quite easy forecast data in this kind of situation as the hidden patterns are recognizable which make predictions easy.

Non-stationary: A non-stationary time series will have a time varying mean or time varying variance or both, which makes it impossible to generalize the time series over other time periods.

Non stationary processes can further be explained with the help of a term called Random walk models. This term or theory usually is used in stock market which assumes that stock prices are independent of each other over time. Now there are two types of random walks:
Random walk with drift : When the observation that is to be predicted at a time ‘t’ is equal to last period’s value plus a constant or a drift (α) and the residual term (ε). It can be written as
Yt= α + Yt-1 + εt
The equation shows that Yt drifts upwards or downwards depending upon α being positive or negative and the mean and the variance also increases over time.
Random walk without drift: The random walk without a drift model observes that the values to be predicted at time ‘t’ is equal to last past period’s value plus a random shock.
Yt= Yt-1 + εt
Consider that the effect in one unit shock then the process started at some time 0 with a value of Y0
When t=1
Y1= Y0 + ε1
When t=2
Y2= Y1+ ε2= Y0 + ε1+ ε2
In general,
Yt= Y0+∑ εt
In this case as t increases the variance increases indefinitely whereas the mean value of Y is equal to its initial or starting value. Therefore the random walk model without drift is a non-stationary process.

So, with that we come to the end of the discussion on the Time Series. Hopefully it helped you understand time Series, for more information you can also watch the video tutorial attached down this blog. DexLab Analytics offers machine learning courses in delhi. To keep on learning more, follow DexLab Analytics blog.


.

What Is The Role Of Big Data In The Pharmaceutical Industry?

What Is The Role Of Big Data In The Pharmaceutical Industry?

Big data is currently trending in almost all sectors as now the awareness of the hidden potential of data is on the rise. The pharmaceutical industry is a warehouse of valuable data that is constantly piling up for years and which if processed could unlock information that holds the key to the next level of innovation and help the industry save a significant amount of money in the process as well. Be it making the clinical trial process more efficient or, ensuring the safety of the patients, big data holds the clue to every issue bothering the industry. The industry has a big need for professionals who have Data science using Python training, because only they can handle the massive amount of data and channelize the information to steer the industry in the right direction.

We are here taking a look at different ways data is influencing the pharmaceutical industry.

Efficient clinical-trial procedure

Clinical trial holds so much importance as the effectiveness of a drug or, a procedure on a select group of patients is tested. The process involves many stages of testing and it could be time-consuming and not to mention the high level of risk factors involved in the process. The trials often go through delays that result in money loss and there is risk involved too as side effects of a specific drug or a component can be life-threatening. However, big data can help in so many ways here, to begin with, it could help filtering patients by analyzing several factors like genetics and select the ones who are eligible for the trials. Furthermore, the patients who are participating in clinical trials could also be monitored in real-time. Even the possible side effects could also be predicted and in turn, would save lives.

Successful sales and marketing efforts

The pharmaceutical industry can see a great difference in marketing efforts if only they use data-driven insight. Analyzing the data the companies could identify the locations and physicians ideal for the promotion of their new drug. They can also identify the needs of the patients and could target their sales representative teams towards that location. This would take the guesswork out of the process and increase the chance of getting a higher ROI. The data can also help them predict market trends as well as understand customer behavior. Another factor to consider here is monitoring the market response to a particular drug and also its performance, as this would help fine-tune marketing strategies.

Collaborative efforts

With the help of data, there could be better collaboration among the different segments that directly impact the industry. The companies could suggest different drugs that could be patient-specific and the physicians could use real-time patient data to decide whether the suggestions should be implemented in the treatment plan. There could be internal and external collaborations as well to improve the overall industry functioning. Be it reaching out to researchers or, CROs, establishing a strong link can help the industry move further.

Predictive analysis

A new drug might be effective in handling a particular health issue and could revolutionize the treatment procedure but, the presence of certain compounds might prove to be fatal for certain patients and drug toxicity if not detected at an early stage could endanger a particular patient. So, using predictive analysis a patient data could be analyzed to determine the genetic factors, disease history, as well as lifestyle. The smart algorithms thereby help identify the risk factors and makes it possible to take a personalized approach regarding medication that could prove to be more effective rather than some random medication.

Big data can increase the efficiency of the pharmaceutical industry in more ways than one, but compared to other industries somehow this industry still hasn’t been able to utilize the full potential of big data, due to factors like privacy and, monetary issues. The lack of trained professionals could also prove to be a big obstacle. Sending their select professionals for Data Science training, could prove to be a big boon for them in the future.


.

How to Parse Data with Python

How to Parse Data with Python

Before we begin with our Python tutorial on how to parse data with Python, we would like you to download this machine learning data file, and then get set to learn how to parse data.

The data set we have provided in the above link, mimics exactly the way the data was when we visited the web pages at that point of time, but the interesting thing about this is we need not visit the page even. We actually have the full HTML source code, so it is just like parsing the website without the annoying bandwidth use.

Now, the first thing to do when we start is to correspond the date to our data, and then we will pull the actual data.

Here is how we start:

import pandas as pd
import os
import time
from datetime import datetime

path = "X:/Backups/intraQuarter"

Looking for a Machine Learning course online? We have Big Data courses that will bring big dreams to reality.

As given above, we are importing the Pandas for the Pandas module, OS, that is so we can interact with the directories, date and time for managing the date and time information.

Furthermore, we will finally define the path, which is the path to the intraQuarter folder than one will need to unzip the original zip file, which you just downloaded from the website.

def Key_Stats(gather="Total Debt/Equity (mrq)"):
    statspath = path+'/_KeyStats'
    stock_list = [x[0] for x in os.walk(statspath)]
    #print(stock_list)

We began our functions, with the specification that we are going to try to collect all the Debt/equity values.

The path to the stats directory is Statspath.

To list all the contents in the directory, you can use stock_list which is a fast one-liner for the loop that uses os.walk.

Take up our Machine Learning training course with Python to know more about this in-demand skill!

Then the next step is to do this:

    for each_dir in stock_list[1:]:
        each_file = os.listdir(each_dir)
        if len(each_file) > 0:

Mentioned above is a cycling through of directory (which is every stock ticker). Then the next step is to list “each_file”, which is each file within that very stock’s directory. If in case the length of each_file which is in fact is a list of all of the files in the stock’s directory, is greater than 0 only then will we want to proceed. However, there are some stocks with no files or data:

            for file in each_file:

                date_stamp = datetime.strptime(file, '%Y%m%d%H%M%S.html')
                unix_time = time.mktime(date_stamp.timetuple())
                print(date_stamp, unix_time)
                #time.sleep(15)

Key_Stats()

Finally, at the end, we must run a loop that pulls the date_stamp, from each file. All our files are actually stored under their ticket, with a file name for the exact date and time from which the information is being taken out.

It is from there that we will explain to date-time what the format for our date stamp is, and then we will convert it to a Unix time stamp.

To know more about data parsing or anything else in python, learn Machine Learning Using Python with the experts at DexLab Analytics.


This post originally appeared onpythonprogramming.net/parsing-data-website-machine-learning


.

Call us to know more