Machine Learning Using Python Archives - Page 9 of 15 - DexLab Analytics | Big Data Hadoop SAS R Analytics Predictive Modeling & Excel VBA

Summer Internship/Training 101

Summer Internship/Training 101

Hard Fact: Nowadays, all major organizations seek candidates who are technically sound, knowledgeable and creative. They don’t prefer spending time and money on employee training.  Thus, fresh college graduates face a tricky situation.

Summer internship is a quick solution for them. Besides guaranteeing a valuable experience to the fresh graduates, internship helps them secure a quick job. However, the question is what exactly is a summer internship program and how does it help bag the best job in town?

What Is a Summer Internship?

Summer internships are mostly industrial-level training programs for students who are interested in core technical industry domain. Such internships offer students hands-on learning experience while letting them gain glimpses of the real world – following a practical approach. Put simply, summer trainings enhance skills, sharpen theoretical knowledge and are a great way to pursue a flourishing career. In most cases, the candidates are hired by the companies in which they are interning.

The duration of such internships is mostly between eight to twelve weeks following the college semesters. Mostly, they start from May or June and proceeds through August. So, technically, this is the time for summer internships and at DexLab Analytics, we offer industry-relevant certification courses that break open a gamut of job opportunities. Also, such accredited certifications add value to your CV. They help build powerful CVs.

If you are a college student and from Delhi, NCR, drop by DexLab Analytics! Browse through our business analytics, risk analytics, machine learning and data science course sections. Summer internships are your key to success. Hurry now!

Deep Learning and AI using Python

Why Is It Important?

Summers are crucial. If you are college-goer, you will understand that summertime is the most opportune time to explore diverse career interests without being bogged down by homework or classroom assignments.

Day by day, summer internships are becoming popular. Not only do they expose aspiring candidates to the nuances of the big bad world but also hone their communication skills, create great resumes and make them super confident. Building confidence is extremely important. If you want to survive in this competitive industry, you have to present a confident version of you. Summer training programs are great in this respect. Plus, they add value to your resume. A good internship will help you get noticed by the prospective employers. Always, try to add references; however, ask permission from your supervisors before including their names as references in your resume.

Moreover, summer training gives you the scope to experiment and explore options. Suppose, you are pursuing Marketing Major and bagged an internship in the same, but you are not happy with it. Maybe, marketing is not your thing. No worries! Complete your internship and move on.  

On the other hand, let’s say you are very happy with your selected internship and want to do something in the respective field! Finish the internship, wait for some time and then try for recruitment in the same company where you interned or explore possibilities in the same domain.

2

It’s no wonder that summer internships open a roadway of opportunities. The technical aptitude and in-demand skills learned during the training help you accomplish your desired goal in life.

For more advice or expert guide, follow DexLab Analytics.


Interested in a career in Data Analyst?

To learn more about Data Analyst with Advanced excel course – Enrol Now.
To learn more about Data Analyst with R Course – Enrol Now.
To learn more about Big Data Course – Enrol Now.

To learn more about Machine Learning Using Python and Spark – Enrol Now.
To learn more about Data Analyst with SAS Course – Enrol Now.
To learn more about Data Analyst with Apache Spark Course – Enrol Now.
To learn more about Data Analyst with Market Risk Analytics and Modelling Course – Enrol Now.

Demand for Data Analysts is Skyrocketing – Explained

Demand for Data Analysts is Skyrocketing - Explained

The salary of analytics professionals outnumbers that of software engineers by more than 26%. The wave of big data analytics is taking the world by storm. If you follow the latest studies, you will discover that there has been a prominent growth in median salary over several experience levels in the past three years (2016 to 2018). In 2019, the average analytics salary has been capped at 12.6 lakh per annum.

The key takeaway is that the salary structure of analytics professionals continues to beat other tech-related job roles. In fact, data analysts are found out-earning their Java correspondents by nearly 50% in India alone. A latest survey provides an encompassing view of base and compensation salaries in data science along with median salaries followed across diverse job categories, regions, education profiles, experience, tools and skills.

In this regard, a spokesperson of a prominent data analytics learning institute was found saying, “The demand for AI skills is expected to increase rapidly, which is also reflected by the fact that AI engineers command a higher salary than peers.” She further added, “Many of our clients have realized that investing in data-driven skills at the leadership level is a determining factor for the success of digital and AI initiatives in the organization. With the increasing adoption of digital technologies, we expect an enduring growth of Data Science and AI initiatives to offer exciting and lucrative career options to new age professionals,”

Over time, we are witnessing how markets are evolving while the demand for skilled data scientists is following an upward trend. It is not only the technology firms that are posting job offers, but the change is also evident across industries, like retail, medical, retail and CPG amongst others. These sectors are enhancing their analytical capabilities implying an automatic increase in the number of data-centric jobs and recruitment of data scientists.

Points to Consider:

  • In the beginning, nearly 76% of data analysts earn 6-lakh figure per annum.
  • The average analytics salary observed in 2018-19 is 12.6 lakh.
  • In terms of analytics career, Mumbai offers the highest compensation of 13.7 lakh yearly, followed by Bangalore at 13 lakh.
  • Mid-level professionals proficient in data analytics are more in demand.
  • Knowing Python is an added advantage; Python Programming training will help you earn more. Expect a package of 15.1 lakh.
  • Nevertheless, we often see a pay disparity for female data scientists against their male counterparts. While women’s take-home salary is 9.2 lakh, male from the same designation and profession earns 13.7 lakh per annum.

2

As endnotes, the demand for data science skills is skyrocketing. If you want to enter into this flourishing job market, this is the best time! Enroll in a good data analyst course in Delhi and mould your career in the shape of success! DexLab Analytics is a top-notch data analyst training institute that offers a plethora of in-demand skill training courses. Reach us for more.


This article has been sourced fromwww.tribuneindia.com/news/jobs-careers/data-analytics-professionals-ride-the-big-data-wave/759602.html


Interested in a career in Data Analyst?

To learn more about Data Analyst with Advanced excel course – Enrol Now.
To learn more about Data Analyst with R Course – Enrol Now.
To learn more about Big Data Course – Enrol Now.

To learn more about Machine Learning Using Python and Spark – Enrol Now.
To learn more about Data Analyst with SAS Course – Enrol Now.
To learn more about Data Analyst with Apache Spark Course – Enrol Now.
To learn more about Data Analyst with Market Risk Analytics and Modelling Course – Enrol Now.

Top 4 Python Industrial Use-Cases: Explained

Top 4 Python Industrial Use-Cases: Explained

Dexlab ____ YOutube subscriber

Python is one of the fastest-growing and most popular coding languages in the world; a large number of developers use it on daily basis and why not, it works brilliantly for a plethora of developer job roles and data science positions – starting from scripting solution for sysadmins to supporting machine learning algorithms to fueling web development, Python can work wonders across myriad platforms!

Below, we’ve rounded up 4 amazing Python industrial use-cases; scroll ahead:

Insurance

Widely used in generating business insights; courtesy machine learning.

Case Study:

Smaller firms driven by machine learning gave stiff competition to a US multinational finance and insurance corporation. In return, the insurer formed teams and devised a new set of services and applications based on ML algorithms to enjoy a competitive edge. However, the challenge was that with so many data science tools, numerous versions of Python came into the picture and gave rise to compatibility issues. As a result, the company finalized only one version of Python, which was then used in line with machine learning algorithms and tools to derive specific results.

Data Science Machine Learning Certification

Finance

Data mining helps determine cross-sell opportunities.

Case Study:

Another US MNC dealing in financial services showed interest in mining complex customer behavioral data. Using Python, the company launched a series of ML and data science initiatives to dig into its structured data that it has been gathering for years and correlated it with an army of unstructured data, gathered from social media and web to enhance cross-selling and retrieve resources.

Aerospace

Python helps in meeting system deadlines and ensured utmost confidentiality.

Case Study:

Recently, the International Space Station struck a deal with an American MNC dealing in military, defense and aerospace technology; the latter has been asked to provide a series of systems to the ISS. The critical safety systems were mostly written in languages, like Ada; they didn’t fare well in terms of scripting tasks, data science analysis or GUI creation. That’s why Python was chosen; it offered bigger contract value and minimum exposure.

Retail Banking

Enjoy flexible data manipulation and transformation – all with Python!

Case Study:

A top-notch US department store chain equipped with an in-store banking division gathered data and stored it in a warehouse. The main aim of the company was to share the information with multiple platforms to fulfill its supply chain, analytics, retail banking and reporting needs. Though the company chose Python for on-point data manipulation, each division came up with their own versions of Python, resulting in a new array of issues. In the end, the company decided to keep a standard Python; this initiative not only resulted in amplifying engineering speed but also reduced support costs.

As end notes, Python is the next go-to language and is growing each day. If you have dreams of becoming an aspiring programmer, you need to book the best Python Certification Training in Delhi. DexLab Analytics is a premier Python training institute in Delhi; besides Python, it offers in-demand skill development courses for interested candidates.


The blog has been sourced from www.techrepublic.com/article/python-5-use-cases-for-programmers


Interested in a career in Data Analyst?

To learn more about Data Analyst with Advanced excel course – Enrol Now.
To learn more about Data Analyst with R Course – Enrol Now.
To learn more about Big Data Course – Enrol Now.

To learn more about Machine Learning Using Python and Spark – Enrol Now.
To learn more about Data Analyst with SAS Course – Enrol Now.
To learn more about Data Analyst with Apache Spark Course – Enrol Now.
To learn more about Data Analyst with Market Risk Analytics and Modelling Course – Enrol Now.
Now Machine Learning Can Predict Premature Death, Says Research

Now Machine Learning Can Predict Premature Death, Says Research

Machine Learning yet again added another feather in its cap; a team of researchers tried and tested a suave machine learning system that can now predict early death. Yes, premature death can now be estimated, courtesy a robust technology and an outstanding panel of researchers from the University of Nottingham! At first, it may sound weird and something straight out of a science fiction novel, but fret not – machine learning has proved itself in improving the status of preventive healthcare and now it’s ready to venture into new unexplored medical territories.

Prediction at Its Best

Published in PLOS ONE in one of their special editions of Machine Learning in Health and Biomedicine, the study delves into how myriad AI and ML tools can be leveraged across diverse healthcare fields. The technology of ML is already reaping benefits in cancer detection, thanks to its sophisticated quantitative power. These new age algorithms are well-equipped to predict death risks of chronic diseases way ahead of time from a widely distributed middle-aged population.

To draw clear conclusions, the team collected data of more than half a million people falling within the age group of 40 and 69 from the UK Biobank. The data collection is from the period 2006-2010, followed up till 2016. With this data in tow, the experts analyze biometric, demographic, lifestyle and clinical factors in each individual subject. Robust machine learning models are used in the process.

Adding in, the team observed dietary consumption of vegetables, fruits and meat per day of each subject. Later, the team from Nottingham University proceeded to predict the mortality of these individuals.

“We mapped the resulting predictions to mortality data from the cohort, using Office of National Statistics death records, the UK cancer registry and ‘hospital episodes’ statistics,” says Dr. Stephen Weng, assistant professor of Epidemiology and Data Science.  “We found machine-learned algorithms were significantly more accurate in predicting death than the standard prediction models developed by a human expert.”

Accuracy and Outcome

The researchers involved in this ambitious project are excited to the bones. They are eager about the outcomes. They are in fact looking forward to a time where medical professionals would be able to distinguish potential health hazards in patients with on-point accuracy and evaluate the following steps that would lead the way towards prevention. “We believe that by clearly reporting these methods in a transparent way, this could help with scientific verification and future development of this exciting field for health care”, shares Dr. Stephen Weng.

As closing thoughts, the research is expected to build the foundation of enhanced medicine capabilities and deliver customized healthcare facilities tailoring risk management for each individual patient. The Nottingham research draws inspiration from a similar study where machine learning techniques were used to predict cardiovascular diseases.

Data Science Machine Learning Certification

In case, you are interested in Machine Learning Using Python training course, DexLab Analytics is the place to be. With a volley of in-demand skill training courses, including Python certification training and AI training, we are one of the best in town. For details, check out our official website RN.

 
The blog has been sourced from
interestingengineering.com/machine-learning-algorithms-are-now-able-to-predict-premature-death


.

Know All about Usage-Driven Grouping of Programming Languages Used in Data Science

Know All about Usage-Driven Grouping of Programming Languages Used in Data Science

Programming skills are indispensable for data science professionals. The main job of machine learning engineers and data scientists is drawing insights from data, and their expertise in programming languages enable them to do this crucial task properly. Research has shown that professionals of the data science field typically work with three languages simultaneously. So, which ones are the most popular? Are some languages more likely to be used together?

Recent studies explain that certain programming languages are used jointly besides other programming languages that are used independently. With the survey data collected from Kaggle’s 2018 Machine Learning and Data Science study, usage patterns of over 18,000 data science experts working with 16 programming languages were analyzed. The research revealed that these languages can actually be categorized into smaller sets, resulting in 5 main groupings. The nature of the groupings is indicative of specific roles or applications that individual groups support, like analytics, front-end work and general-purpose tasks.

2

Principal Component Analysis for Dimension Reduction

In this article, we will explain how Bob E. Hayes, PhD holder, scientist, blogger and data science writer has used principal component analysis, a type of data reduction method, to categorize 16 different programming languages. Herein, the relationship among various languages is inspected before putting them in particular groups. Basically, principal component analysis looks into statistical associations like covariance within a large collection of variables, and then justifies these correlations with the help of a few variables, called components.

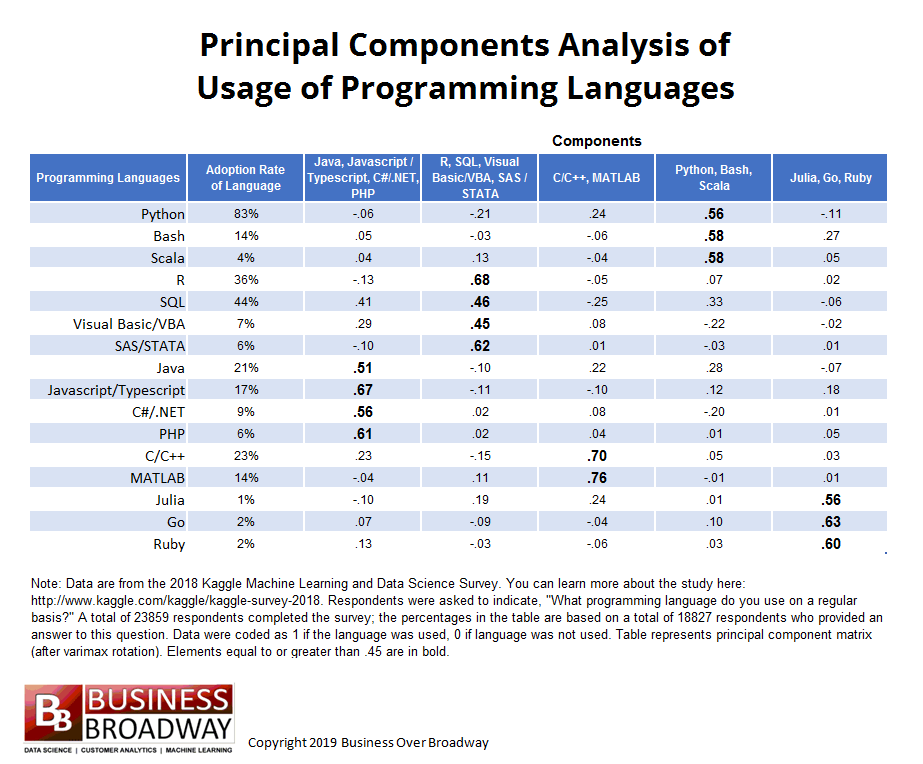
Principal component matrix presents the results of this analysis. The matrix is an nXm table, where:

n= total no. of original variables, which in this case are the number of programming languages

m= number of main components

The strength of relationship between each language and underlying components is represented by the elements of the matrix. Overall, the principal component analysis of programming language usage gives us two important insights:

  • How many underlying components (groupings of programming languages) describe the preliminary set of languages
  • The languages that go best with each programming language grouping

Result of Principal Component Analysis:

The nature of this analysis is exploratory, meaning no pre-defined structure was imposed on the data. The result was primarily driven by the type of relationship shared by the 16 languages. The aim was to explain the relationships with as less components as possible. In addition, few rules of thumb were used to establish the number of components. One was to find the number of eigen values with value greater than 1 – that number determines the number of components. Another method is to identify the breaking point in the scree plot, which is a plot of the 16 eigen values.

businessoverbroadway.com


5-factor solution was chosen to describe the relationships. This is owing to two reasons – firstly, 5 eigen values were greater than one and secondly, the scree plot showed a breaking point around 6th eigen value.

Following are two key interpretations from the principal component matrix:

  • Values greater than equal to .45 have been made bold
  • The headings of different components are named on the basis of tools that loaded highly on that component. For example, component 4 has been labeled as Python, Bash, Scala because these languages loaded highest on this component, implying respondents are likely to use Bash and Scala if they work with Python. Other 4 components were labeled in a similar manner.

Groupings of Programming Languages

The given data set is appropriately described by 5 tool grouping. Below are given 5 groupings, including the particular languages that fall within the group, meaning they are likely to be used together.

  1. Java, Javascript/Typescript, C#/.NET, PHP
  2. R, SQL, Visual Basic/VBA, SAS/STATA
  3. C/C++, MATLAB
  4. Python, Bash, Scala
  5. Julia, Go, Ruby

One programming language didn’t properly load into any of the components: SQL. However, SQL is used moderately with three programming languages, namely Java (component 1), R (component 2) and Python (component 4).

It is further understood that the groupings are determined by the functionality of different languages in the group. General-purpose programming languages, Python, Scala and Bash, got grouped under a single component, whereas languages used for analytical studies, like R and the other languages under comp. 2, got grouped together. Web applications and front-end work are supported by Java and other tools under component 1.

Conclusion:

Data science enthusiasts can succeed better in their projects and boost their chances of landing specific jobs by choosing correct languages that are suited for the job role they want. Being skilled in a single programming language doesn’t cut it in today’s competitive industry. Seasoned data professionals use a set of languages for their projects. Hence, the result of the principal component analysis implies that it’s wise for data pros to skill up in a few related programming languages rather than a single language, and focus on a specific part of data science.

For more help with your data science learning, get in touch with DexLab Analytics, a leading data analyst training institute in Delhi. Also check our Machine learning courses in Delhi to be trained in the essential and latest skills in the field.

 
Reference: http://customerthink.com/usage-driven-groupings-of-data-science-and-machine-learning-programming-languages
 

Interested in a career in Data Analyst?

To learn more about Data Analyst with Advanced excel course – Enrol Now.
To learn more about Data Analyst with R Course – Enrol Now.
To learn more about Big Data Course – Enrol Now.

To learn more about Machine Learning Using Python and Spark – Enrol Now.
To learn more about Data Analyst with SAS Course – Enrol Now.
To learn more about Data Analyst with Apache Spark Course – Enrol Now.
To learn more about Data Analyst with Market Risk Analytics and Modelling Course – Enrol Now.

General Python Guide 2019: Learning Data Analytics with Python

General Python Guide 2019: Learning Data Analytics with Python

Python and data analytics are possibly three of the most commonly heard words these days. In today’s burgeoning tech scene, being skillful in these two subjects can prove very profitable. Over the years, we have seen the importance of Python education in the field of data science skyrocketing.

So here we present a general guide to help start off your Python learning:

Reasons to Choose Python:

  • Popularity

With over 40% data scientists preferring Python, it is clearly one of the most widely used tools in data analysis. It has risen in popularity above SAS and SQL, only lagging behind R.

  • General Purpose Language

There might be many other great tools in the market for analyzing data, like SAS and R, but Python is the only trustworthy general-purpose language valid across a number of application domains.

2

Step 1: Setup Python Environment

Setting up Python environment is uncomplicated, but a primary step. Downloading the free Anaconda Python package is recommended. Besides core Python language, it includes all the essential libraries, such as Pandas, SciPy, NumPy and IPython, and graphical installer also. Post installation, a package containing several programs is launched, most important one being iPython also known as Jupyter notebook. After launching the notebook, the terminal opens and a notebook is started in the browser. This browser works as the coding platform and there’s no need for internet connection even.

Step 2: Knowing Python Fundamentals

Getting familiar with the basics of Python can happen online. Active participation in free online courses, where video tutorials, practice exercises are plentiful, can help you grasp the fundamentals quickly. However, if you are seeking expert guidance, you must explore our Python data science courses.

Step 3: Know Key Python Packages used for Data Analysis

Since it is a general purpose language, Python’s utility stretches beyond data science. But there are plentiful Python libraries useful in data functionalities.

Numpy – essential for scientific computing

Matplotib – handy for visualization and plotting

Pandas – used in data operations

Skikit-learn – library meant to help with data mining and machine learning activities

StatsModels – applied for statistical analysis and modeling

Scipy-SciPy – the Numpy extension of Python; it is a set of math functions and algorithms

Theano – package defining multi-dimensional arrays.

Step 4: Load Sample Data for Practice

Working with sample datasets is a great way of getting familiar with a programming language. Through this kind of practice, candidates can try out different methods, apply novel techniques and also pinpoint areas of strength and in need of improvement.

Python library StatModels contains preloaded datasets for practice. Users can also download dataset from CSV files or other sources on web.

Step 5: Data Operations

Data administration is a key skill that helps extract information from raw data. Majority of times, we get access to crude data that cannot be analyzed straightaway; it needs to be manipulated before analyzing. Python has several tools for formatting, manipulating and cleaning data before it is examined.

Step 6: Efficient Data Visualization

Visuals are very valuable for investigative data analysis and also explaining results lucidly. The common Python library used for visualization is Matplotlib.

Step 7: Data Analytics

Formatting data and designing graphs and plots are important in data analysis. But the foundation of analytics is in statistical modeling, data mining and machine learning algorithms. Having libraries like StatsModels and Scikit-learn, Python provides all necessary tools essential for performing core analyzing functions.

Concluding

As mentioned before, the key to learning data analytics with Python is practicing with imported data sets. So without delay, start experimenting with old operations and new techniques on data sets.

For more useful blogs on data science, follow DexLab Analytics – we help you stay updated with all the latest happenings in the data world! Also, check our excellent Python courses in Delhi NCR.


Interested in a career in Data Analyst?

To learn more about Data Analyst with Advanced excel course – Enrol Now.
To learn more about Data Analyst with R Course – Enrol Now.
To learn more about Big Data Course – Enrol Now.

To learn more about Machine Learning Using Python and Spark – Enrol Now.
To learn more about Data Analyst with SAS Course – Enrol Now.
To learn more about Data Analyst with Apache Spark Course – Enrol Now.
To learn more about Data Analyst with Market Risk Analytics and Modelling Course – Enrol Now.
5 Great Takeaways from Machine Learning Conference 2019

5 Great Takeaways from Machine Learning Conference 2019

Machine Learning Developer Summit, one of the leading Machine Learning conferences of India, happening on the 30th and 31st of January 2019 in Bangalore, aims to assemble machine leaning and data science experts and enthusiasts from all over India. Organized by Analytics India Magazine, this high-level meeting will be the hotspot for conversing about the latest developments in machine learning. Attendees can gather immense knowledge from ML experts and innovators from top tech enterprises, and network with individuals belonging to data sciences. Actually, there are tons of rewards for those attending MLDS 2019. Below are some of the best takeaways:

  1. Creation of Useful Data Lake on AWS

In a talk by reputable Raghuraman Balachandran, Solutions Architect for Amazon Web Services, participants will learn how to design clean, dependable data lakes on AWS cloud. He shall also share his experienced outlook on tackling some common challenges of designing an effective data lake. Mr Balachandran will explain the process to store raw data – unstructured, semi-structured or completely structured – and processed data for different analytical uses.

Data lakes are the most used architectures in data-based companies. This talk will allow attendees to develop a thorough understanding of the concept, which is sure to boost their skill set for getting hired.

2

  1. Improve Inference Phase for Deep Learning Models

Deep learning models require considerable system resources, including high-end CPUs and GPUs for best possible training. Even after exclusive access to such resources, there may be several challenges in the target deployment phase that were absent in the training environment.

Sunil Kumar Vuppala, Principal Scientist at Philips Research, will discuss methods to boost the performance of DL models during their inference phase. Further, he shall talk about using Intel’s inference engine to improve quality of DL models run in Tensorflow/Caffe/Keras via CPUs.

  1. Being more employable amid the explosive growth in AI and its demand

The demand for AI skills will skyrocket in future – so is the prediction of many analysts considering the extremely disruptive nature of AI. However, growth in AI skills isn’t occurring at the expected rate. Amitabh Mishra, who is the CTO at Emcure Pharmaceuticals, addresses the gap in demand and development of AI skills, and shall share his expert thoughts on the topic. Furthermore, he will expand on the requirements in AI field and provide preparation tips for AI professionals.

  1. Walmart AI mission and how to implement AI in low-infrastructure situations

In the talk by Senior Director of Walmart Lab, Prakhar Mehrotra, audiences get a view of Walmart’s progress in India. Walmart Lab is a subsidiary of the global chain Walmart, which focuses on improving customer experience and designing tech that can be used with Merchants to enhance the company’s range. Mr Mehrotra will give details about Wallmart’s AI journey, focusing on the advancements made so far.

  1. ML’s important role in data cleansing

A good ML model comes from a clean data lake. Generally, a significant amount of time and resources invested in building a robust ML model goes on data cleansing activities. Somu Vadali, Chief of Future Group’s CnD Labs Data and Products section, will talk about how ML can be used to clean data more efficiently. He will speak at length about well-structured processes that allow organizations to shift from raw data to features in a speedy and reliable manner. Businesses may find his talk helpful to reduce their time-to-market for new models and increase efficiency of model development.

Machine learning is the biggest trend of IT and data science industry. In fact, day by day it is gaining more prominence in the tech industry, and is likely to become a necessary skill to get bigger in all fields of employment. So, maneuver your career towards excellence by enrolling for machine learning courses in India. Machine learning course in Gurgaon by DexLab Analytics is tailor-made for your specific needs. Both beginners and professionals find these courses apt for their growth.


Interested in a career in Data Analyst?

To learn more about Data Analyst with Advanced excel course – Enrol Now.
To learn more about Data Analyst with R Course – Enrol Now.
To learn more about Big Data Course – Enrol Now.

To learn more about Machine Learning Using Python and Spark – Enrol Now.
To learn more about Data Analyst with SAS Course – Enrol Now.
To learn more about Data Analyst with Apache Spark Course – Enrol Now.
To learn more about Data Analyst with Market Risk Analytics and Modelling Course – Enrol Now.
Being a Statistician Matters More, Here’s Why

Being a Statistician Matters More, Here’s Why

Right data for the right analytics is the crux of the matter. Every data analyst looks for the right data set to bring value to his analytics journey. The best way to understand which data to pick is fact-finding and that is possible through data visualization, basic statistics and other techniques related to statistics and machine learning – and this is exactly where the role of statisticians comes into play. The skill and expertise of statisticians are of higher importance.

2

Below, we have mentioned the 3R’s that boosts the performance of statisticians:

Recognize – Data classification is performed using inferential statistics, descriptive and diverse other sampling techniques.

Ratify – It’s very important to approve your thought process and steer clear from acting on assumptions. To be a fine statistician, you should always indulge in consultations with business stakeholders and draw insights from them. Incorrect data decisions take its toll.

Reinforce – Remember, whenever you assess your data, there will be plenty of things to learn; at each level, you might discover a new approach to an existing problem. The key is to reinforce: consider learning something new and reinforcing it back to the data processing lifecycle sometime later. This kind of approach ensures transparency, fluency and builds a sustainable end-result.

Now, we will talk about the best statistical techniques that need to be applied for better data acknowledgment. This is to say the key to becoming a data analyst is through excelling the nuances of statistics and that is only possible when you possess the skills and expertise – and for that, we are here with some quick measures:

Distribution provides a quick classification view of values within a respective data set and helps us determine an outlier.

Central tendency is used to identify the correlation of each observation against a proposed central value. Mean, Median and Mode are top 3 means of finding that central value.

Dispersion is mostly measured through standard deviation because it offers the best scaled-down view of all the deviations, thus highly recommended.

Understanding and evaluating the data spread is the only way to determine the correlation and draw a conclusion out of the data. You would find different aspects to it when distributed into three equal sections, namely Quartile 1, Quartile 2 and Quartile 3, respectively. The difference between Q1 and Q3 is termed as the interquartile range.

While drawing a conclusion, we would like to say the nature of data holds crucial significance. It decides the course of your outcome. That’s why we suggest you gather and play with your data as long as you like for its going to influence the entire process of decision-making.

On that note, we hope the article has helped you understand the thumb-rule of becoming a good statistician and how you can improve your way of data selection. After all, data selection is the first stepping stone behind designing all machine learning models and solutions.

Saying that, if you are interested in learning machine learning course in Gurgaon, please check out DexLab Analytics. It is a premier data analyst training institute in the heart of Delhi offering state-of-the-art courses.


The blog has been sourced from www.analyticsindiamag.com/are-you-a-better-statistician-than-a-data-analyst


Interested in a career in Data Analyst?

To learn more about Data Analyst with Advanced excel course – Enrol Now.
To learn more about Data Analyst with R Course – Enrol Now.
To learn more about Big Data Course – Enrol Now.

To learn more about Machine Learning Using Python and Spark – Enrol Now.
To learn more about Data Analyst with SAS Course – Enrol Now.
To learn more about Data Analyst with Apache Spark Course – Enrol Now.
To learn more about Data Analyst with Market Risk Analytics and Modelling Course – Enrol Now.
The Soaring Importance of Apache Spark in Machine Learning: Explained Here

The Soaring Importance of Apache Spark in Machine Learning: Explained Here

Apache Spark has become an essential part of operations of big technology firms, like Yahoo, Facebook, Amazon and eBay. This is mainly owing to the lightning speed offered by Apache Spark – it is the speediest engine for big data activities. The reason behind this speed: Rather than a disk, it operates on memory (RAM). Hence, data processing in Spark is even faster than in Hadoop.

The main purpose of Apache Spark is offering an integrated platform for big data processes. It also offers robust APIs in Python, Java, R and Scala. Additionally, integration with Hadoop ecosystem is very convenient.

2

Why Apache Spark for ML applications?

Many machine learning processes involve heavy computation. Distributing such processes through Apache Spark is the fastest, simplest and most efficient approach. For the needs of industrial applications, a powerful engine capable of processing data in real time, performing in batch mode and in-memory processing is vital. With Apache Spark, real-time streaming, graph processing, interactive processing and batch processing are possible through a speedy and simple interface. This is why Spark is so popular in ML applications.

Apache Spark Use Cases:

Below are some noteworthy applications of Apache Spark engine across different fields:

Entertainment: In the gaming industry, Apache Spark is used to discover patterns from the firehose of real-time gaming information and come up with swift responses in no time. Jobs like targeted advertising, player retention and auto-adjustment of complexity levels can be deployed to Spark engine.

E-commerce: In the ecommerce sector, providing recommendations in tandem with fresh trends and demands is crucial. This can be achieved because real-time data is relayed to streaming clustering algorithms such as k-means, the results from which are further merged with various unstructured data sources, like customer feedback. ML algorithms with the aid of Apache Spark process the immeasurable chunk of interactions happening between users and an e-com platform, which are expressed via complex graphs.

Finance: In finance, Apache Spark is very helpful in detecting fraud or intrusion and for authentication. When used with ML, it can study business expenses of individuals and frame suggestions the bank must give to expose customers to new products and avenues. Moreover, financial problems are indentified fast and accurately.  PayPal incorporates ML techniques like neural networks to spot unethical or fraud transactions.

Healthcare: Apache Spark is used to analyze medical history of patients and determine who is prone to which ailment in future. Moreover, to bring down processing time, Spark is applied in genomic data sequencing too.

Media: Several websites use Apache Spark together with MongoDB for better video recommendations to users, which is generated from their historical data.

ML and Apache Spark:

Many enterprises have been working with Apache Spark and ML algorithms for improved results. Yahoo, for example, uses Apache Spark along with ML algorithms to collect innovative topics than can enhance user interest. If only ML is used for this purpose, over 20, 000 lines of code in C or C++ will be needed, but with Apache Spark, the programming code is snipped at 150 lines! Another example is Netflix where Apache Spark is used for real-time streaming, providing better video recommendations to users. Streaming technology is dependent on event data, and Apache Spark ML facilities greatly improve the efficiency of video recommendations.

Spark has a separate library labelled MLib for machine learning, which includes algorithms for classification, collaborative filtering, clustering, dimensionality reduction, etc. Classification is basically sorting things into relevant categories. For example in mails, classification is done on the basis of inbox, draft, sent and so on. Many websites suggest products to users depending on their past purchases – this is collaborative filtering. Other applications offered by Apache Spark Mlib are sentiment analysis and customer segmentation.

Conclusion:

Apache Spark is a highly powerful API for machine learning applications. Its aim is wide-scale popularity of big data processing and making machine learning practical and approachable. Challenging tasks like processing massive volumes of data, both real-time and archived, are simplified through Apache Spark. Any kind of streaming and predictive analytics solution benefits hugely from its use.

If this article has piqued your interest in Apache Spark, take the next step right away and join Apache Spark training in Delhi. DexLab Analytics offers one the best Apache Spark certification in Gurgaon – experienced industry professionals train you dedicatedly, so you master this leading technology and make remarkable progress in your line of work.


Interested in a career in Data Analyst?

To learn more about Data Analyst with Advanced excel course – Enrol Now.
To learn more about Data Analyst with R Course – Enrol Now.
To learn more about Big Data Course – Enrol Now.

To learn more about Machine Learning Using Python and Spark – Enrol Now.
To learn more about Data Analyst with SAS Course – Enrol Now.
To learn more about Data Analyst with Apache Spark Course – Enrol Now.
To learn more about Data Analyst with Market Risk Analytics and Modelling Course – Enrol Now.
Call us to know more