Machine Learning Using Python Archives - Page 7 of 15 - DexLab Analytics | Big Data Hadoop SAS R Analytics Predictive Modeling & Excel VBA

Deep Learning and its Progress as Discussed at Intel’s AI Summit

Deep Learning and its Progress as Discussed at Intel’s AI Summit

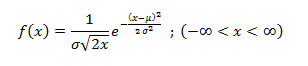
At the latest AI summit organized by Intel, Mr. Naveen Rao, Vice President and General Manager of Intel’s AI Products Group, focused on the most vibrant age of computing that is the present age we are living. According to Rao, the widespread and sudden growth of neural networks is putting the capability of the hardware into a real test. Therefore, we now have to reflect deeply on “how processing, network, and memory work together” to figure a pragmatic solution, he said.

The storage of data has seen countless improvements in the last 20 years. We can now boast of our prowess of handling considerably large sets of data, with greater computing capability in a single place. This led to the expansion of the neural network models with an eye on the overall progress in neural Network Machine Learning Python and computing in general.

2

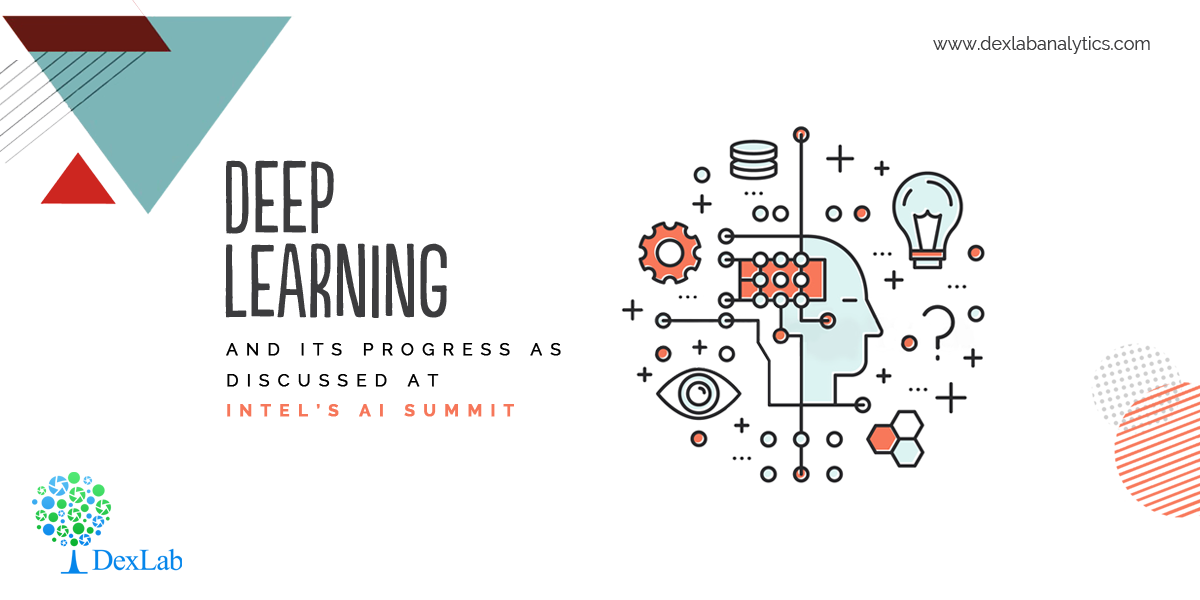
With the onset of exceedingly large data sets to work with, Deep learning for Computer Vision Course and the other models of Deep Learning to recognize speech, images, and text are extensively feeding on them. The technological giants were undoubtedly the early birds to grab the technical: the hardware and the software configuration to have an edge on the others.  

Surely, Deep Learning is on its peak now, where computers can identify the images with incredible vividness. On the other hand, chatbots can carry on with almost natural conversations with us. It is no wonder that the Deep learning Training Institutes all over the world are jumping in the race to bring all of these new technologies efficiently to the general mass.

The Big Problem

We are living in the dynamic age of AI and Machine Learning, with the biggies like Google, Facebook, and its peers, having the technical skills and configuration to take up the challenges. However, the neural networks have fattened up so much lately that it has already started to give the hardware a tough time, getting the better of them all the time.

Deep Learning and AI using Python

The number of parameters of the Neural network models is increasing as never before. They are “actually increasing on the order of 10x year on year”, as per Rao. Thus, it is a wall looming in AI. Though Intel is trying its best to tackle this obvious wall, which might otherwise give the industry a severe setback, with extensive research to bring new chip architectures and memory technologies into play, it cannot solve the AI processing problem single-handedly. Rao concluded on a note of requesting the partners in the present competitive scenario.


Sourced from: www.datanami.com/2019/11/13/deep-learning-has-hit-a-wall-intels-rao-says


Interested in a career in Data Analyst?

To learn more about Data Analyst with Advanced excel course – Enrol Now.
To learn more about Data Analyst with R Course – Enrol Now.
To learn more about Big Data Course – Enrol Now.

To learn more about Machine Learning Using Python and Spark – Enrol Now.
To learn more about Data Analyst with SAS Course – Enrol Now.
To learn more about Data Analyst with Apache Spark Course – Enrol Now.
To learn more about Data Analyst with Market Risk Analytics and Modelling Course – Enrol Now.

8 Amazing Things That Artificial Intelligence Can Do

8 Amazing Things That Artificial Intelligence Can Do

AI plays a crucial role in our everyday lives. By now, we are aware of AI’s glaring significance in our very existence. Nevertheless, you would be surprised to know that AI has already imbibed some of the skills that we, humans, possess. Ahead, we’ve 8 incredible skills that AI has learnt over the years:

Read

Wondering how to summarize all those kilobytes of information? AI-powered SummarizeBot is the answer. Whether its books, news articles, weblinks, audio/image files or legal documents, ATS (automatic text summarization) reads everything and records the important information. Natural Language Processing (NLP), artificial intelligence, machine learning and blockchain technologies are in play here.  

2

Write

Did you know that myriad news enterprises and seasoned journalists rely on AI to write? The New York Times, Reuters, Washington Post and more have turned to artificial intelligence to craft interesting reading pieces. Also, AI is expected to enhance the process of creative writing as well.  Even, it has generated a novel that was shortlisted for a prestigious award.

See

Machine vision is in the hype. It is implemented in different ways in today’s world, such as facilitating self-driven cars, facial recognition for payment portals, police work and more. The main concept of machine vision is to let the computers ‘visualize’ the world, analyze key data and make decisions thereafter.

Speak

We are fortunate enough to have Google Maps and Alexa to give us directions and respond to our queries but Google Duplex takes it to a whole new level, courtesy AI. With the help of this robust technology, Duplex can schedule appointments and finish tasks on phone in a very interactive language. It can also respond perfectly to human behaviors.

Hear and Understand

Detecting gunshots and alerting to-the-purpose agencies is one of the greatest things achieved by AI. It means AI can hear and understand sound. It is very well evident in how digital voice assistants respond to your queries regarding weather or a day’s agenda. Working professionals simply love the efficiency, accuracy and convenience of automated meeting minutes provided by AI.

Touch

With the help of cameras and sensors, a robot can identify and handpick ‘supermarket ripe’ blueberries and put them in your basket. The creator of the robot even asserts that it is designed to pick one blueberry every 10 seconds for 24 hours a day!

Deep Learning and AI using Python

Smell

A team of AI researchers are at present developing robust AI models that can detect illnesses – simply by smelling. The model is designed in such a way so that it can notice chemicals, known as aldehydes that cause human stress and diseases, including diabetes, cancer and brain injuries. AI bots can even identify other caustic chemicals or gas leaks. Of late, IBM is using AI to formulate new perfumes.

Perceive Emotions

Today, AI tools can observe human emotions and track them down as one watches videos. Artificial emotional intelligence can collect meaningful data from a person’s facial expressions or body language, analyze it to determine what emotion he/she is likely to express and then ascertain an action base on that detail.

For more such interesting updates, follow DexLab Analytics. Our Machine Learning Using Python course is a bestseller. To know more, click here <www.dexlabanalytics.com>


This post originally appeared onwww.forbes.com/sites/bernardmarr/2019/11/11/13-mind-blowing-things-artificial-intelligence-can-already-do-today/#2777e5ec6502


Interested in a career in Data Analyst?

To learn more about Data Analyst with Advanced excel course – Enrol Now.
To learn more about Data Analyst with R Course – Enrol Now.
To learn more about Big Data Course – Enrol Now.

To learn more about Machine Learning Using Python and Spark – Enrol Now.
To learn more about Data Analyst with SAS Course – Enrol Now.
To learn more about Data Analyst with Apache Spark Course – Enrol Now.
To learn more about Data Analyst with Market Risk Analytics and Modelling Course – Enrol Now.

Machine Learning Jobs in 2019: Freezing your own Job

Machine Learning Jobs in 2019: Freezing your own Job

Machine Learning surely needs no introduction. Joining forces with Data Science and Big Data, Machine Learning is one of the principal technologies, which is carving the future for us. From self-propelled cars to voice assistants, to surgical robots, Artificial Intelligence is already amongst us.

Besides, with this cutting-edge technology, marketing is also witnessing a fresh bloom, irrespective of the field you are working on. Thus, it is obvious that the career opportunities have quickly and radically shifted in the way of the candidates who are well-versed with Machine Learning platforms and languages. If you are also looking forward to shooting your career up, the premium Machine Learning course in India is the place you should reach now!

2

Learning Machine Learning is No More a Pain Now!

Whether you are a professional or a fresher planning your way to be successful as a Machine Learning professional, you must ensure that you are updated. Besides, you should also be careful that you have certain skills in your grip that you can work on!

However, if you are not aware of them still, here are the skills that you need to focus on to rest assured:

Programming Languages

As you speak English and/or your regional languages accepted to your society in order to communicate comprehensibly, you also need to be well-versed with the languages specific to Machine Learning.

In a nutshell, R programming certification and Machine Learning Using Python are undoubtedly the most significant ones when it comes to Machine Learning.

Data Modeling

If you believe that you can already boast of considerable knowledge of R & Python, then you shall extend your knowledge a bit more towards the advanced methods of analysis. Brief know how of the coding structures, Data Modeling and Data Visualization will help you steer your career forwards.

Deep Learning and AI using Python

Statistics and Probability

If you are seeking to make a career out of Machine Learning, it is important to note that you should have a good grip of statistics and probability. Now, with the thorough courses of Python for Data Analysis along with extensive knowledge of statistics and probability from Dexlab Analytics, it will be easier than ever.

Besides all these, you also need to grasp significant insights into the improved algorithms and clustering methods. 


Interested in a career in Data Analyst?

To learn more about Data Analyst with Advanced excel course – Enrol Now.
To learn more about Data Analyst with R Course – Enrol Now.
To learn more about Big Data Course – Enrol Now.

To learn more about Machine Learning Using Python and Spark – Enrol Now.
To learn more about Data Analyst with SAS Course – Enrol Now.
To learn more about Data Analyst with Apache Spark Course – Enrol Now.
To learn more about Data Analyst with Market Risk Analytics and Modelling Course – Enrol Now.

The Future of AI and Machine Learning: What the Experts Say?

The Future of AI and Machine Learning: What the Experts Say?

It’s hard to ignore the growing prowess of AI and machine learning.

Previously, Gartner predicted that AI will become one of the key priorities for more than 30% C-Suite professionals by 2020. Indeed, it’s true; software vendors across the globe are following this new gold rush. For them, data is like new oil. In this blog, we explore the future of this budding technology and gain some new insights and ideas. Let’s see what the heavyweights from the digital industry have to say:

Hyper-targeting and Personalization

Ben Wald, Co-Founder & VP of Solutions Implementation at Very

Though machine learning is a subset of data analysis, it’s rapidly influencing the IoT industry and its respective devices. In the last couple of years, nearly 90% of data was generated through an array of smartphones, watches and cars. These mountains of data help in forming better customer relationships.

How? Using Machine Learning Using Python of course! With this power tool, the corporate houses are trying to understand their target audience and extract crucial information regarding how well they receive their products and related after-sales services. Fine-tuning personalization on a wider scale is the key. Hopefully, soon, we will be able to achieve this goal. We are still in the nascent stage.

Improved Search Engine Experiences

Dorit Zilbershot, Chief Product Officer at Attivio

Did you know that AI algorithms have a massive impact on search engine results?

In the next few years, search engines are expected to enhance user and admin experience: courtesy breakthroughs in neural networks and deep learning technologies. These revolutionary technologies, especially deep learning for computer vision with Python will make sure users enjoy a fabulous searching experience and will deliver highly relevant answers. Currently, we are working on delivering results that are based on user’s query and profile. The process requires a lot of manual configurations and a fundamental understanding of how search engines work. Later, the results will be customized based on individuals’ past preferences, interactions and words used. It will be fun to see how machine learning algorithms transform the dynamo of content publishing and search engines.

Quantum Computing

Matt Reaney, Founder & CEO of Big Cloud

Real and revolutionary, the concept of quantum computing is wreaking havoc in the domain of science and technology. It is the future of machine learning triggering an array of innovations. Integrating quantum computing with machine learning is expected to transform the field triggering accelerated learning, quicker processing and better capabilities. This means the intricate challenges that we can’t solve now could be done in a fraction of time then.

The potential of quantum computing is huge in the future and is likely affect millions of lives, notably in medicine and healthcare industry.

Currently, there are no commercially-built quantum algorithms or hardware available in the market. However, several research facilities and government agencies have been investing in this new field of science of late.

Data Science Machine Learning Certification

End Notes

At DexLab Analytics, we love to craft and curate insights from industry pundits, especially when it comes to something as significant as technological innovations that transform lives altogether. Follow us and stay updated!


.

Statistical Application in R & Python: Poisson Distribution

Statistical Application in R & Python: Poisson Distribution

Continuing with the series of blogs, the first of which was Statistical Application In R & Python: Normal Probability Distribution, here we bring you a post on how you can calculate Poisson distribution effortless using R & Python. So, stay tuned!

Poisson distribution is a counting process which is a discrete probabilistic model. It has only one parameter, (lambda or “m”) which is essentially the average rate of change. Poisson distribution is used to model “number of anything”. The probability distribution function of a Poisson distribution is given by the below expression.

If m is the mean occurrence per interval, then the probability of having x occurrence with in a given interval is:

Application:

A business firm receives on an average 6.5 telephone calls per day during the time period 11:00 – 11:15 A.M., Find the probability that on a certain day, the firm receives exactly9 calls during the same period.

The random variable x is the ‘number of telephone calls received during the period 11:00 – 11:15 A.M, since x is assumed to Poisson distribution. The parameter m is equal to the mean of the distribution; i.e.  m = 6.5 and x = 9, then the equation is:

Calculate Poisson Distribution in R:

So, while calculating Poisson distribution in R, we notice that the probability of occurring exactly 9 calls instead of average 6.5 calls in a given particular time (11:00 A.M – 11:15 A.M ) = 85.81%

Calculate Poisson Distribution in Python:

So, while we calculate Poisson distribution in Python, we notice that the probability of occurring exactly 9 calls instead of average 6.5 calls in a given particular time (11:00 A.M – 11:15 A.M) = 85.81%

Conclusion:

Companies can use the Poisson distribution to contrive effective steps to improve their operational efficiency. For instance, an analysis done with the Poisson distribution might reveal how a company can arrange staffing in order to be able to handle the peak periods efficiently, when the customer service calls keep on pouring.

In this problem we see that the business firm receives on an average 6.5 telephone calls per day during the time period 11:00A.M – 11:15A.M, then the probability of the firm receives exactly 9 calls in a same is 85.81%.

Dexlab Analytics is the best Python training institute in Delhi, bringing you the all-inclusive courses of Python for Data Analysis and R Predictive Modelling Certification, among others to start your career in Data Science and Analytics.


Interested in a career in Data Analyst?

To learn more about Data Analyst with Advanced excel course – Enrol Now.
To learn more about Data Analyst with R Course – Enrol Now.
To learn more about Big Data Course – Enrol Now.

To learn more about Machine Learning Using Python and Spark – Enrol Now.
To learn more about Data Analyst with SAS Course – Enrol Now.
To learn more about Data Analyst with Apache Spark Course – Enrol Now.
To learn more about Data Analyst with Market Risk Analytics and Modelling Course – Enrol Now.

A Nifty Guide to Initiate AIOps in 2019

A Nifty Guide to Initiate AIOps in 2019

AIOps (artificial intelligence for IT operations) is the buzz word of the 21st century.

In this digitally-charged world, AIOps platforms are the key. They fuse ML and big data functionalities to boost and partly replace primary IT operations’ programs, including event correlation and analysis, performance monitoring and IT service automation and management.

In simple terms, AIOps is the combined application of data science and machine learning to help mitigate IT operations-related challenges and find faster insights. It fixes high-severity outages in a jiffy. 

The main objective of revolutionary AIOps platforms is to ingest and analyze the aggravating volume, variety and velocity of data and deliver it in a useful manner.

Deep Learning and AI using Python

IT bigwigs are excited about the prospects of applying AI and ML to IT operations.

Gartner expects that big enterprises’ usage of AIOps and other monitoring tools and applications will rise from 5% in 2018 to 30% in 2023. The long-term impact of AIOps on IT operations is predicted to be transformative.

Fortunately, AI capabilities are making headway, and more real-time solutions are being formulated and made available each day.

Read on to know how to get started with AIOPs:

Be prepared

First and foremost, you have to familiarize yourself with all the ML and AI capabilities and vocabulary. It doesn’t matter if you are gearing up for an AIOps project or not. Capabilities and priorities change; so be ready to implement the platform anytime soon.

Select the first few test cases carefully

Small and steady wins the race. The same phrase applies to transformation initiatives. They start small, seize knowledge and iterate from there. Imbibe the same approach for AIOps success.

Enhance your proficiency

Decode the intricacies of AIOps amongst your colleagues by displaying simple techniques. Ascertain your skills and identify the loopholes, then devise a relevant plan to fill up those gaps in-between.

Feel free to experiment

Although a majority of AIOps platforms are complex and costly, there is a substantial number of open-source and relatively low-cost ML software available in the market that lets you evaluate the efficacy of AIOps and ML applications and their uses.

Look beyond IT

Don’t forget to leverage all kinds of data analytics resources available in your organization. Data management is the cornerstone of AIOps. Most of the teams are already skilled in it. Statistical analytics and business analysis are key components of contemporary business frameworks, and many techniques traverse public domains. 

2

Standardize and modernize, as and when required

Prepare your work infrastructure to implement a robust AIOps adoption by embracing secure automation architecture, immutable infrastructure patterns and infrastructure as code (IaC).

Interested in learning more about Machine Learning Using Python? Feel free to reach us at DexLab Analytics. We’re a premier learning platform specialized in offering in-demand skill training courses to the interested candidates.


The blog has been sourced from ― www.gartner.com/smarterwithgartner/how-to-get-started-with-aiops


Interested in a career in Data Analyst?

To learn more about Data Analyst with Advanced excel course – Enrol Now.
To learn more about Data Analyst with R Course – Enrol Now.
To learn more about Big Data Course – Enrol Now.

To learn more about Machine Learning Using Python and Spark – Enrol Now.
To learn more about Data Analyst with SAS Course – Enrol Now.
To learn more about Data Analyst with Apache Spark Course – Enrol Now.
To learn more about Data Analyst with Market Risk Analytics and Modelling Course – Enrol Now.

Statistical Application in R & Python: Normal Probability Distribution

Statistical Application in R & Python: Normal Probability Distribution

Gauss, the famous French Mathematician is responsible for developing one of the most significant distributions in all of statistics, i.e. – The Normal Distribution. Please refer to the blog on Central Limit Theorem: www.dexlabanalytics.com/blog/the-almighty-central-limit-theorem. It will help you fully grasp the significance of the Normal Distribution. However, if you want to revisit our series of blogs by following it from the start, you can reach STATISTICAL APPLICATION IN R & PYTHON: CHAPTER 1 – MEASURE OF CENTRAL TENDENCY right now!

Essentially, the Normal Distribution provides “approximations” to most other distributions such as the Binomial, Poisson, Gamma, Exponential, etc. This is to say as sample sizes get statistically large enough, most distributions approximate into a normal shaped curve.

Every distribution has important features known as its “parameters”. Normal distribution has two parameters. These are Mean ( ) and Variance (σ²). The normal distribution has a bell-shaped curve, where the probability of likelihood peaks at its mean in the middle.

The Normal Distribution has vast practical applications in the field of Business, Finance, Medicine, and Physics and so on. Things like weights, heights, IQ scores follow the Normal Distribution.

Normal Distribution, Gaussian distribution, is a continuous probability distribution and is defined by the Probability Density Function (PDF).

Where,

Application:

Assume that the credit score fits a Normal Distribution.

Suppose Mr. Arjun’s last 10 month’s credit score are:

789, 635, 739, 687, 724, 810, 817, 735, 819, 820

What is the probability that the percentage of credit score will 825 or more in the 11th month?

Months

Credit Score

January

789

February

635

March

739

April

687

May

724

June

810

July

817

August

735

September

819

October

820


Calculating Normal Distribution in R:

If we go to calculate Normal Probability Distribution in R, we can predict that the probability of the 11th month credit score will be 825 or greater than that is 14.60%, whereas in another case, the probability of the 11th month credit score will be 825 or less than that is 85.40%.

Calculate Normal Distribution in Python:

Make a data frame of the data and calculate Mean and Standard Deviation for calculate Normal Distribution.

Now, we can easily calculate Normal Distribution in Python

So, in calculating the Normal Probability Distribution in Python, we can predict that the probability of the 11th month credit score will be 825 or greater than that is 14.60%, whereas in another case, the probability of the 11th month credit score will be 825 or less than that is 85.40%.

Conclusion:

Normal Distribution is used for calculating parameters. It is represented by the bell curve, where the total area of the curve is 1. Normal Distribution has its use in Finance, Business, Salaries, Blood Pressures, Measurement etc and many other fields.

Here, we have used Normal Distribution to predict Mr. Arjun’s 11th month credit score, and set the target (825). By Normal Distribution we can predict the percentage of possibility to achieve the target.

Calculating Binomial Distribution might be tricky for many but with Dexlab Analytics it won’t be hassle anymore. So, get hold of our STATISTICAL APPLICATION IN R AND PYTHON: CALCULATING BINOMIAL DISTRIBUTION blog, to get around all your problems.


Interested in a career in Data Analyst?

To learn more about Data Analyst with Advanced excel course – Enrol Now.
To learn more about Data Analyst with R Course – Enrol Now.
To learn more about Big Data Course – Enrol Now.

To learn more about Machine Learning Using Python and Spark – Enrol Now.
To learn more about Data Analyst with SAS Course – Enrol Now.
To learn more about Data Analyst with Apache Spark Course – Enrol Now.
To learn more about Data Analyst with Market Risk Analytics and Modelling Course – Enrol Now.

Python vs. Scala: Which is Better for Data Analytics?

Python vs. Scala: Which is Better for Data Analytics?

Data Science and Analytics seem to be synonymous to progress as far as the field of computer science is concerned. Now, with the rise of these technologies, everything goes down to the programming languages, which single-handedly help in the growth of them. 

This gave rise to Python, now known as the most significant language in the world of technology. Scala is another versatile language which is not unknown to the researchers and tech geeks. These two languages are the most talked about in the industry today. Nevertheless, both of them are extensively used in data analytics and data science. However, the debate regarding which one to opt for among the two has always been constant. But worry no longer because here we will discuss both of them, in brief, to help you with your choice!

Deep Learning and AI using Python

Python

Python is really one of the most popular languages in the industry. The open-source nature of the language makes it a popular choice for scripting and automation works. 

Besides, Python is powerful, effective, and easy to learn. Moreover, Neural Network Machine learning Python boasts of its efficient high-level data structures and for object-oriented programming.

Advantages

  • Easy to learn and effective too.
  • Exhaustive support from active communities.
  • Python enjoys built-in support for the datatypes.

Disadvantages

  • Your computer might slow down a little when you are running Python. This is in contrast to when you are running other languages like C or Java.

Scala

If you want an object-oriented, functional programming language, then Scala would certainly be your first choice. It was basically built for the Java Virtual Machine (JVM) and remains the most compatible programming language with Java code till date.

Advantages

  • Scala can utilise the majority of the JVM libraries, thus helping them to be embedded in the enterprise code.
  • It shares an array of readable syntax features of the popular languages, like Ruby.
  • Scala brags about numerous incredible features like string comparison advancements, pattern matching and its likes.

2

Disadvantages

  • Scala has a limited number of users in the communities, which encourages lesser interactions and stunted growth.
  • At times the type-information in Scala is really complex to comprehend. This difficulty can be attributed to the functional and object-oriented nature of the language.

We hope that this article helps you to have a brief insight into two of the most demanding programming languages: Python and Scala.

Now, if you want to enrol yourself in Computer vision course Python, you can reach us right at Dexlab Analytics, the most reputable institute for Big Data Analytics. Also, if you are looking for all-inclusive Deep learning for computer vision Course, turn no further than our premium institute to shoot your career up!


Interested in a career in Data Analyst?

To learn more about Data Analyst with Advanced excel course – Enrol Now.
To learn more about Data Analyst with R Course – Enrol Now.
To learn more about Big Data Course – Enrol Now.

To learn more about Machine Learning Using Python and Spark – Enrol Now.
To learn more about Data Analyst with SAS Course – Enrol Now.
To learn more about Data Analyst with Apache Spark Course – Enrol Now.
To learn more about Data Analyst with Market Risk Analytics and Modelling Course – Enrol Now.

Statistical Application of R & Python: Know Skewness & Kurtosis and Calculate it Effortlessly

Statistical Application of R & Python: Know Skewness & Kurtosis and Calculate it Effortlessly

This is a blog which shall widen your approach on the Statistical Application using R & Python. You perhaps already have been calculating Geometric Mean using R & Python and are already aware of the Application of Harmonic Mean using R & Python. However, if you are eager to further your knowledge about Skewness & Kurtosis and interested to know of their application using R and Python, then this is the right place.

Skewness:

Skewness is a metric which tells us about the location of my dataset. That is, if you want to know where most of the values are concentrated on an ascending scale.

Skewness is of two kinds: Positive skew and Negative skew. A positively skewed dataset will have most of the values concentrated at the beginning of the scale. Eg: If a woman is asked to rate 100 tinder profiles based on the looks on a scale of 1 – 10, 1 being the ugliest and 10 being the most handsome. Then the resulting ratings will be positively skewed. This is to say that women are harsh critiques of looks.

Now, consider another example: Say if the wealth of the 1% richest people were to be plotted on a scale of say $0 – $200 billion. Then, most of the values will be concentrated at the end of the scale. This will be an example of a negatively skewed dataset.

In essence, skewness is the third central moment about mean and gives us a feel for the location of the data set values. It is recommended to go through STATISTICAL APPLICATION IN R & PYTHON: CHAPTER 1 – MEASURE OF CENTRAL TENDENCY to have an understanding of the Central Tendency and its measures. Having no skewness will mean the data set is fairly symmetrical and has a bell shaped curve.

Where n is the sample size, Xi is the ith X value, X is the average and S is the sample standard deviation.  Note the exponent in the summation.  It is “3”.

Kurtosis:

Kurtosis is a statistical measure that’s used to describe, or Skewness, of observed data around the mean, sometimes referred to as the volatility to volatility. Kurtosis is used generally in the statistical field to describe trends in charts. Kurtosis can be present in a chart with fat tails and a low, even distribution, as well as be present in a chart with skinny tails and a distribution concentrated toward the mean.

Kurtosis for a normal distribution is 3.  Most software packages use the formula:


The types of kurtosis are:-


Application:

A person tries to analyze last 12months interest rate of the investment firm to understand the risk factor for the future investment.

The interest rates are:

12.05%, 13%, 11%, 18%, 10%, 11.5%, 15.08%, 21%, 6%, 8%, 13.2%, 7.5%.

Here is the table:

Months

(One Year)

Interest

Rate (%)

April12.05
May13
June11
July18
August10
September11.5
October15.08
November21
December6
January8
February13.2
March7.5


Calculate skewness & Kurtosis in R:

Calculate skewness & Kurtosis in R:
Calculating the Skewness & Kurtosis of interest rate in R, we get the positive skewed value, which is near to 0. The skewness of the interest rate is 0.5585253.

The kurtosis of the interest rate is 2.690519

Kurtosis is less than 3, so this is Platykurtic distribution.

Calculate Skewness & Kurtosis in Python:

Calculate Skewness & Kurtosis in Python:
Calculating the Skewness & Kurtosis of interest rate in Python, we get the positive skewed value and near from 0. The skewness of the interest rate is 0.641697.

The kurtosis of the interest rate is 0.241602.

Kurtosis is less than 3, so this is Platykurtic distribution.

Conclusion:

Firstly, according to the output of the data the value is positively skewed(R & Python), positive skewness indicates a distribution with an asymmetric tail extending toward more positive values.

And the kurtosis is less than 3 (R & Python), it is a platykurtic distribution. Positive kurtosis indicates a relatively peaked distribution. And the distribution is light tails.

Secondly, the value of the skewness and kurtosis are different in R and Python, but the actual effects are more or less the same. The results are different because skewness and kurtosis are calculated with different formulae or method for the measurement like Bowley’s measure, Pearson’s(First, Second) measures, Fisher’s measure & Moment’s measure. And different software (ex. R, Python, SAS, Excel etc) using different processes to calculate skewness & kurtosis brings the same ultimate result. The numerical values change only when the numbers are also changed. So, we sometimes get different results.

2

There are numerous other blogs that you can follow with Dexlab Analytics. Also, if you want to explore computer vision course Python, neural network machine learning Python and more extensive courses on R & Python, then you can also join us and boost both your passion and career.


Interested in a career in Data Analyst?

To learn more about Data Analyst with Advanced excel course – Enrol Now.
To learn more about Data Analyst with R Course – Enrol Now.
To learn more about Big Data Course – Enrol Now.

To learn more about Machine Learning Using Python and Spark – Enrol Now.
To learn more about Data Analyst with SAS Course – Enrol Now.
To learn more about Data Analyst with Apache Spark Course – Enrol Now.
To learn more about Data Analyst with Market Risk Analytics and Modelling Course – Enrol Now.

Call us to know more