Machine Learning Using Python Archives - Page 13 of 15 - DexLab Analytics | Big Data Hadoop SAS R Analytics Predictive Modeling & Excel VBA

How to Leverage AI Strategy in Business?

How to Leverage AI Strategy in Business?

Everyday some company or the other are deploying AI into their systems – whether its Spotify’s machine learning program or Bank of America’s chatbot Erica – it seems AI has broken the shackles and left the machine room to enter the mainstream business.

Today’s AI algorithms are framed on remarkably factual machine sight, speech and hearing, and they have easy access to global cache of information. Thanks to Deep Learning, meteoric growth in data and other cutting edge AI techniques, AI performance is staggeringly improving. With these developments, it may seem possible for CIOs, enterprise architects, application managers who are still in nascent stage in gaining expertise in AI to feel like they are lagging behind somewhere. Contrarily, they are doing well for themselves.

2

How?

No second thoughts, a majority of data architects are still learning AI technology so as to develop their adoption strategy. AI is an ever-evolving technology – constant new developments and breakthroughs are emerging out every day, hence crafting a particular strategy might be difficult at times. Luckily, tech oracles like Whit Andrews, VP distinguished analyst, Gartner, are able to pin down distinct trends that determines the direction of AI in the business, while leveraging its capabilities to the fullest.

Browse through our intensive Data Science with Python Courses – they are a real treat to satiate the analytics hunger!

Check out these three trends that Andrews focuses on to develop formidable AI strategy for your business setup:

Data Science and Machine Learning: In What State They Are To Be Found? – @Dexlabanalytics.

AI will mushroom normal, contextual user-machine interfaces

Google Home and Amazon Echo have penetrated the homes of thousands, taking the consumer space by a storm. Human-computer interaction is now shifting its base from tactile touchscreens and keyboards to voice – the voice recognition is not only limited to distinct commands but deciphers normal human speech.

Natural language processing (NLP) is the reason behind such intrinsic advancements – and we can’t thank more! NLP and natural language generation have improved operations. The workers employed in parts of Eastern Europe can now talk to their system in their own language and grasp the things that need to be done to complete their designated work, making the whole system work seamlessly.

Incredible Tech Transformation: How Machine Learning is changing the Scope of Business – @Dexlabanalytics.

IoT is the future of AI and Fluid Application Integration

IoT devices gather data from the real world, exchange the data, and perform tasks sent through the internet. In general, they are simple in make but when combined with AI, they can rock the world. How would it be if you find an AI-powered IoT that receive orders, grab products and pack them in containers to be shipped across! Impressive, right?

Besides, AI works upon boosting existing organization applications. AI is like a magical stone that improves customer engagement and support, and Bank of America’s chatbot Erica is a perfect example of that.

The Math Behind Machine Learning: How it Works – @Dexlabanalytics.

A complex computing ecosystem will surface out with AI at the center

While companies diversify their systems, computing ecosystem strives to be the beacon of hope – it includes an intricate mix of customers, staffs, IoT devices, applications and data, coupled with AI in the nucleus. This will ensure:

  • Better interaction between people and devices
  • Proper communication between applications
  • And everything in between

No wonder, such ecosystems presents organizations more integrated automation, deeper insight, and better customer experience. Moreover, Gartner has predicted that more virtual agents will get involved in a majority of business interactions between organizations and individuals by 2020 – so the rise of machines is here, and we are extremely excited about it!

Help develop a well-devised AI strategy – with DexLab Analytics. Our consultants will feed you meaningful information on everything related to AI and machine learning. Our machine learning training course is impressive, and if you want to excel in machine learning training, drop by DexLab Analytics. We have a lot of things in store for you!


Interested in a career in Data Analyst?

To learn more about Data Analyst with Advanced excel course – Enrol Now.
To learn more about Data Analyst with R Course – Enrol Now.
To learn more about Big Data Course – Enrol Now.

To learn more about Machine Learning Using Python and Spark – Enrol Now.
To learn more about Data Analyst with SAS Course – Enrol Now.
To learn more about Data Analyst with Apache Spark Course – Enrol Now.
To learn more about Data Analyst with Market Risk Analytics and Modelling Course – Enrol Now.

R is Gaining Huge Prominence in Data Analytics: Explained Why

Why should you learn R?

Just because it is largely popular..

Is this reason enough for you?

Budding data analytics professionals look forward to learn R because they think by grasping R skills, they would be able to nab the core principles of data science: data visualization, machine learning and data manipulation.

Be careful, while selecting a language to learn. The language should be capacious enough to trigger all the above-mentioned areas and more. Being a data scientist, you would need tools to carry out all these tasks, along with having the resources to learn them in the desired language.

In short, fix your attention on process and technique and just not on the syntax – after all, you need to find out ways to discover insight in data, and for that you need to excel over these 3 core skills in data science and FYI – in R, it is easier to master these skills as compared to any other language.

Data Manipulation

As rightly put, more than 80% of work in data science is related to data manipulation. Data wrangling is very common; a regular data scientist spends a significant portion of his time working on data – he arranges data and puts them into a proper shape to boost future operational activities. 

In R, you will find some of the best data management tools – dplyr package in R makes data manipulation easier. Just ‘chain’ the standard dplyr together and see how drastically data manipulation turns out to be simple.

For R programming certification in Delhi, drop by DexLab Analytics.

2

Data Visualization

One of the best data visualization tools, ggplot2 helps you get a better grip on syntax, while easing out the way you think about data visualization. Statistical visualizations are rooted in deep structure – they consist of a highly structured framework on which several data visualizations are created. Ggplot2 is also based on this system – learn ggplot2 and discover data visualization in a new way.

However, the moment you combine dplyr and ggplot2 together, through the chaining technology, deciphering new insights about your data becomes a piece of cake.

Machine Learning

For many, machine learning is the most important skill to develop but if you ask me, it takes time to ace it. Professionals, who are in this line of work takes years to fully understand the real workings of machine learning and implement it in the best way possible.

Stronger tools are needed time and often, especially when normal data exploration stops producing good results. R boasts of some of the most innovative tools and resources.

R is gaining popularity. It is becoming the lingua franca for data science, though there are several other high-end language programs, R is the one that is used most widely and extremely reliable. A large number of companies are putting their best bets on R – Digital natives like Google and Facebook both houses a large number of data scientists proficient in R. Revolution Analytics once stated, “R is also the tool of choice for data scientists at Microsoft, who apply machine learning to data from Bing, Azure, Office, and the Sales, Marketing and Finance departments.” Besides the tech giants, a wide array of medium-scale companies like Uber, Ford, HSBC and Trulia have also started recognizing the growing importance of R.

Now, if you want to learn more programming languages, you are good to go. To be clear, there is no single programming language that would solve all your data related problems, hence it’s better to set your hands in other languages to solve respective problems.

Consider Machine Learning Using Python; next to R, Python is the encompassing multi-purpose programming language all the data scientists should learn. Loaded with incredible visualization tools, machine learning techniques, Python is the second most useful language to learn. Grab a Python certification Gurgaon today from DexLab Analytics. It will surely help your career move!


Interested in a career in Data Analyst?

To learn more about Data Analyst with Advanced excel course – Enrol Now.
To learn more about Data Analyst with R Course – Enrol Now.
To learn more about Big Data Course – Enrol Now.

To learn more about Machine Learning Using Python and Spark – Enrol Now.
To learn more about Data Analyst with SAS Course – Enrol Now.
To learn more about Data Analyst with Apache Spark Course – Enrol Now.
To learn more about Data Analyst with Market Risk Analytics and Modelling Course – Enrol Now.

5 Hottest Online Applications Inspired by Artificial Intelligence

5 Hottest Online Applications Inspired by Artificial Intelligence

Artificial Intelligence projects, applications and platforms are being churned out from every corner of the world. A majority of them now possess the ability to break loose lab life and hit mainstream trends, making an appearance in myriad online tools, open source APIs and mass gadgets.

Though the machines are yet to take over our lives, they are filtrating their way into our lives, influencing day-to-day activities, be it work or entertainment. From personal assistants like Alexa and Siri, to self-driving vehicles powered by predictive modeling and more intense and fundamental machine learning technologies, a wide set of applications of AI are in use of late.

Feed yourself with Machine Learning Using Python technology, only from DexLab Analytics.

We perused through a handful number of AI apps so that we can enlist the ones that are more practical and thus really deserving! Let’s leverage piles of data with these effective applications:

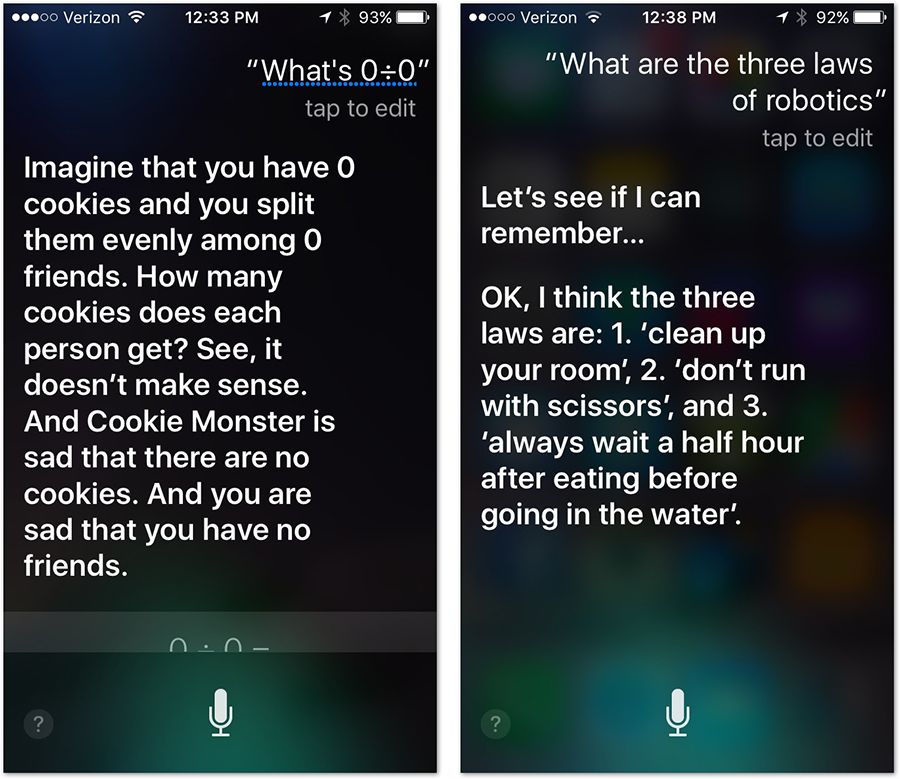
Siri

As per Creative Strategies report, 70% of iPhone users have used Siri at least for once or sometimes, but everyone has tried it at least. We are here to tell you don’t hire a personal assistant, instead implement Siri.

siri

This voice-powered virtual assistant makes business operations smoother and hassle-free, while making your workday more productive. The software is activated by voice, and it is at present available in 20 languages.

Alexa

Developed and powered by Amazon for Amazon Echo intelligent speaker, Alexa, a robust voice service was launched in 2014. It can help you in ordering supplies, translating and controlling office’s vacuum.

amazon-echo

However, connecting your Echo to IFTTT may allow you to coordinate with services that aren’t supported originally by the Echo, while allowing you to integrate multiple actions into a single command to the Echo.

Google Now

This is one of the most popular artificial intelligence applications. Google Now functions by keeping a tab on your calendar, mail, web searches and lot more, along with sending relevant alerts and news on your device as and when detected. It can also carry out tasks, and answer queries, based on voice commands.

google-now

The best part of this application is that you don’t have to log in to use it. Just set up alerts that will be sent to the device, and that’s all. At present, it is available in English and is considered a tailing rival of Siri.

Cortana

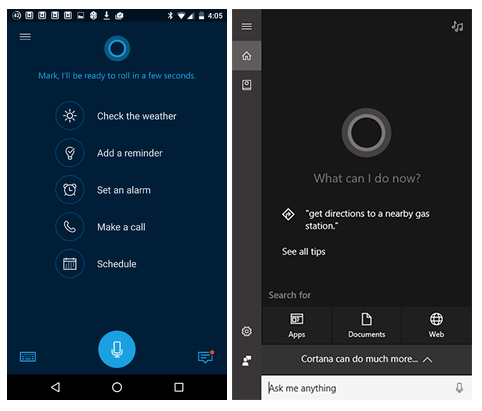
If you know the exact way to maneuver it, Cortana would be the most effective AI personal assistant. It can perform all sorts of things, right from dictating and sending emails, tracking flights to searching something on the internet or checking weather forecasts. The more time you spent on it, its functionality gets better and better.

cortana

Even, the company is so impressed by its services that it has integrated the service into Power BI, its most intuitive BI tool.

Braina

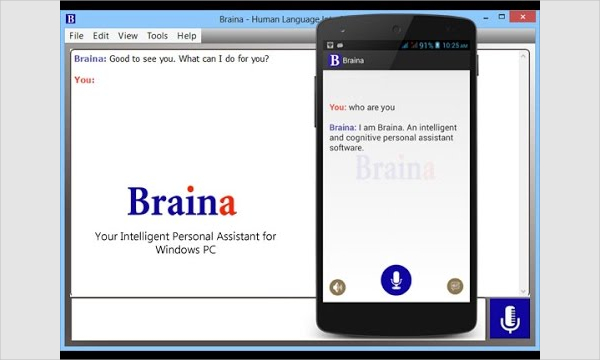
Brain Artificial, aka Braina is self-regulating software, which enables easy hands-free operation in your computer to perform basic tasks by listening to voice based commands in English language.

braina-1

Braina enjoys a certain edger over its run of the mill competitors as it can precisely work with a variety of accents, which is not so common. The pro version is equipped with a bonus of deep learning – it is programmable as well as observes user behavior over time.

Hope, AI applications serves the humanity well!

Check out some more interesting stuff on Machine Learning at DexLab Analytics. We offer world-class machine learning courses in Delhi for all your data aspirations. Come, explore!


Interested in a career in Data Analyst?

To learn more about Data Analyst with Advanced excel course – Enrol Now.
To learn more about Data Analyst with R Course – Enrol Now.
To learn more about Big Data Course – Enrol Now.

To learn more about Machine Learning Using Python and Spark – Enrol Now.
To learn more about Data Analyst with SAS Course – Enrol Now.
To learn more about Data Analyst with Apache Spark Course – Enrol Now.
To learn more about Data Analyst with Market Risk Analytics and Modelling Course – Enrol Now.

5 New-Age IT Skill Sets to Fetch Bigger Paychecks in 2017

Technology is the king. It is slowly intensifying its presence over workplaces, and is one of the chief reasons why companies are laying off employees. Adoption of cutting-edge technologies is believed to be the main reason of job cuts and by now if professional techies are not properly equipped with newer technologies under their sleeves, the future of human workforce seems bleaker.

 
5 New-Age IT Skill Sets to Fetch Bigger Paychecks in 2017
 

DexLab Analytics offers the best R language certification in Delhi.


A recent report says – India would lose about 69,000 jobs until 2021 due to the adoption of IoT, so do you really think human intelligence is losing its intellect? Will AI finally surpass brain power?

Continue reading “5 New-Age IT Skill Sets to Fetch Bigger Paychecks in 2017”

The Timeline of Artificial Intelligence and Robotics

The Timeline of Artificial Intelligence and Robotics

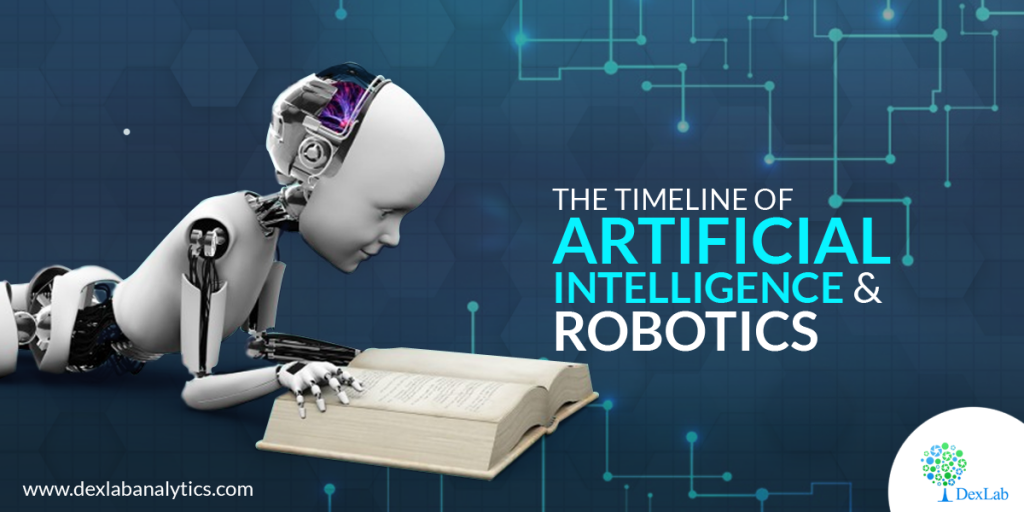
Cities have been constructed sprawling over the miles, heaven-piercing skyscrapers have been built, mountains have been cut across to make way for tunnels, and rivers have been redirected to erect massive dams – in less than 250 years, we propelled from primitive horse-drawn carts to autonomous cars run on highly integrated GPS systems, all because of state-of-the-art technological innovation. The internet has transformed all our lives, forever. Be it artificial intelligence or Internet of Things, they have shaped our society and amplified the pace of high-tech breakthroughs.

One of the most significant and influential developments in the field of technology is the notion of artificial intelligence. Dating back to the 5th century BC, when Greek myths of Hephaestus incorporate the idea of robots, though it couldn’t be executed till the Second World War II, artificial intelligence has indeed come a long way.


Come and take a look at this infographic blog to view the timeline of Artificial Intelligence:


Evolution of Artificial Intelligence Over the Ages from Infographics


In the near future, AI will become a massive sector brimming with promising financial opportunities and unabashed technological superiority. To find out more about AI and how it is going to impact our lives, read our blogs published at DexLab Analytics. We offer excellent Machine Learning training in Gurgaon for aspiring candidates, who want to know more about Machine Learning using Python.


Interested in a career in Data Analyst?

To learn more about Data Analyst with Advanced excel course – Enrol Now.
To learn more about Data Analyst with R Course – Enrol Now.
To learn more about Big Data Course – Enrol Now.

To learn more about Machine Learning Using Python and Spark – Enrol Now.
To learn more about Data Analyst with SAS Course – Enrol Now.
To learn more about Data Analyst with Apache Spark Course – Enrol Now.
To learn more about Data Analyst with Market Risk Analytics and Modelling Course – Enrol Now.

Indian Startups Relying on Artificial Intelligence to Know Their Customer’s Better

Indian-Startups-Relying-on-Artificial-Intelligence-to-Know-Their-Customers-Better

Artificial Intelligence was there decades ago, but everyone is talking about AI and Big Data in India’s startup ecosystem of late.

Budding startups are looking for new talent with AI expertise to inspect and evaluate consumer data and provide customized services to the users. At the same time, tech honchos such as Apple have discovered the huge potentials hidden within Indian companies that help their clients with data processing, image and voice recognition, and no wonders, investors are too hopeful for Indian AI startups.

Discover an intensive and student-friendly Machine Learning course in Delhi. Visit us at DexLab Analytics.


Here are a slew of Indian unicorns – companies valued at $1 billion or more that are putting in use the exploding technology of AI in the best way possible:

2

Paytm

An eye-piercing transformation from being an e-wallet to selling flight or movie tickets, Paytm is now implementing machine learning to bring order into chaos. The company’s chief technology offer, Charumitra Pujari, said, “You could Google and try to look for something. But a better world would be when Google could on its own figure out Charu is looking for ‘x’ at this time. That’s exactly what we’re doing at Paytm,” he further added, “If you’ve come to buy a flight ticket, because I understand your purchase cycle, I show that instead of a movie ticket or transactions.”

In order to identify and prevent fraudulent activities, machines are constantly assessing illicit accounts that purposefully sign up to derive advantage of promo codes, or for money laundering intention. The fraud-detection engine is extremely efficient, leaving no room for human error, Pujari stated.

The team at Paytm is versatile – machine learning engineers, software engineers, and data scientists are in action in Toronto, Canada, as well as in Paytm’s headquarters in Noida, India. Currently, they have 60 people working for them in each location – “We know the future is AI and we will need a lot more people,” said Pujari.

Ola cabs

One of the most successful ride-hailing apps in India, Ola uses machine learning tech to track traffic, crack through driver habits, improve customer experience and enhance the life of each vehicle they acquired. AI plays a consequential role in interpreting day-in-day-out variations in demand and to decipher how much supply is required to cater to its increased demand, how variable are traffic predictions and how rainfall affects the productiveness of vehicles.

olacabs-picture

“AI is understanding what is the behavioral profile of a driver partner and, hence, in which way can we train him to be a better driver partner on (the) platform,” co-founder and chief technology officer Ankit Bhati said, the algorithms put into the car-pooling service works great in pulling down travel times by coordinating with various pick-up points and destinations, while sharing one single vehicle, he further added.

Power yourself with unabashed Machine Learning training.

Flipkart

According to a report in Forbes, Flipkart – India’s largest domestic e-commerce player has already re-designed its app’s home screen to give a more personalized version of services to its mushrooming 120 million patrons. Machine learning models crack each customer’s gender, brand preference, store affinity, price range, volume of purchases and more. In fact, in future, the company is going forward to figure out the reasons about when and why the returns are made, and as a result will try to reduce their happenings. 

Flipkart

A squad of 25 data scientists at Flipkart have started using AI to observe the past buyer behavior to predict their future purchases. “If a customer keys in a query for running shoes, we show only the category landing pages of the particular brand the customer wants to see, in the price point and styles that (are) preferred, as gauged by previous buying behaviour, therefore ensuring a faster, smoother checkout process,” Ram Papatla, the vice president of product management at Flipkart, said recently at an interview with a leading daily.

ShopClues, InMobi, SigTuple and EdGE Network are myriad other Indian startup players who are making it really big by utilizing the powerful tentacles of AI and machine learning.

For more such interesting feeds on artificial intelligence and machine learning, follow us at DexLab Analytics. We offer India’s best Machine Learning Using Python courses.  


Interested in a career in Data Analyst?

To learn more about Data Analyst with Advanced excel course – Enrol Now.
To learn more about Data Analyst with R Course – Enrol Now.
To learn more about Big Data Course – Enrol Now.

To learn more about Machine Learning Using Python and Spark – Enrol Now.
To learn more about Data Analyst with SAS Course – Enrol Now.
To learn more about Data Analyst with Apache Spark Course – Enrol Now.
To learn more about Data Analyst with Market Risk Analytics and Modelling Course – Enrol Now.

Let’s Make Visualizations Better In Python with Matplotlib

Let’s Make Visualizations Better In Python with Matplotlib

Learn the basics of effective graphic designing and create pretty-looking plots, using matplotlib. In fact, not only matplotlib, I will try to give meaningful insights about R/ggplot2, Matlab, Excel, and any other graphing tool you use, that will help you grasp the concepts of graphic designing better.

Simplicity is the ultimate sophistication

To begin with, make sure you remember– less is more, when it is about plotting. Neophyte graphic designers sometimes think that by adding a visually appealing semi-related picture on the background of data visualization, they will make the presentation look better but eventually they are wrong. If not this, then they may also fall prey to less-influential graphic designing flaws, like using a little more of chartjunk.


Data always look better naked. Try to strip it down, instead of adorning it.

Have a look at the following GIF:

“Perfection is achieved not when there is nothing more to add, but when there is nothing left to take away.” – Antoine de Saint-Exupery explained it the best.

Color rules the world

The default color configuration of Matlab is quite awful. Matlab/matplotlib stalwarts may find the colors not that ugly, but it’s undeniable that Tableau’s default color configuration is way better than Matplotlib’s.

Get Tableau certification Pune today! DexLab Analytics offers Tableau BI training courses to the aspiring candidates.

Make use of established default color schemes from leading software that is famous for offering gorgeous plots. Tableau is here with its incredible set of color schemes, right from grayscale and colored to colorblind friendly.

A plenty of graphic designers forget paying heed to the issue of color blindness, which encompasses over 5% of the graphic viewers. For example, if a person suffers from red-green color blindness, it will be completely indecipherable for him to understand the difference between the two categories depicted by red and green plots. So, how will he work then?


For them, it is better to rely upon colorblind friendly color configurations, like Tableau’s “Color Blind 10”.


To run the codes, you need to install the following Python libraries:


  1. Matplotlib
  2. Pandas


Now that we are done with the fundamentals, let’s get started with the coding.
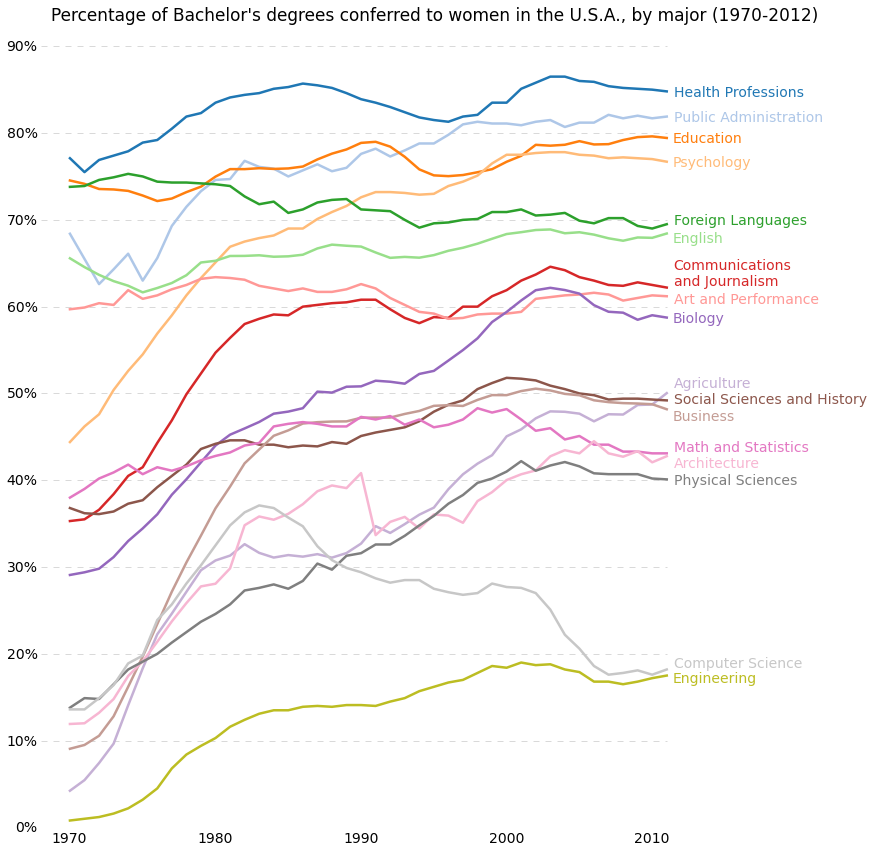
 

percent-bachelors-degrees-women-usa


import matplotlib.pyplot as plt
import pandas as pd

# Read the data into a pandas DataFrame.  
gender_degree_data = pd.read_csv("http://www.randalolson.com/wp-content/uploads/percent-bachelors-degrees-women-usa.csv")  

# These are the "Tableau 20" colors as RGB.  
tableau20 = [(31, 119, 180), (174, 199, 232), (255, 127, 14), (255, 187, 120),  
             (44, 160, 44), (152, 223, 138), (214, 39, 40), (255, 152, 150),  
             (148, 103, 189), (197, 176, 213), (140, 86, 75), (196, 156, 148),  
             (227, 119, 194), (247, 182, 210), (127, 127, 127), (199, 199, 199),  
             (188, 189, 34), (219, 219, 141), (23, 190, 207), (158, 218, 229)]  

# Scale the RGB values to the [0, 1] range, which is the format matplotlib accepts.  
for i in range(len(tableau20)):  
    r, g, b = tableau20[i]  
    tableau20[i] = (r / 255., g / 255., b / 255.)  

# You typically want your plot to be ~1.33x wider than tall. This plot is a rare  
# exception because of the number of lines being plotted on it.  
# Common sizes: (10, 7.5) and (12, 9)  
plt.figure(figsize=(12, 14))  

# Remove the plot frame lines. They are unnecessary chartjunk.  
ax = plt.subplot(111)  
ax.spines["top"].set_visible(False)  
ax.spines["bottom"].set_visible(False)  
ax.spines["right"].set_visible(False)  
ax.spines["left"].set_visible(False)  

# Ensure that the axis ticks only show up on the bottom and left of the plot.  
# Ticks on the right and top of the plot are generally unnecessary chartjunk.  
ax.get_xaxis().tick_bottom()  
ax.get_yaxis().tick_left()  

# Limit the range of the plot to only where the data is.  
# Avoid unnecessary whitespace.  
plt.ylim(0, 90)  
plt.xlim(1968, 2014)  

# Make sure your axis ticks are large enough to be easily read.  
# You don't want your viewers squinting to read your plot.  
plt.yticks(range(0, 91, 10), [str(x) + "%" for x in range(0, 91, 10)], fontsize=14)  
plt.xticks(fontsize=14)  

# Provide tick lines across the plot to help your viewers trace along  
# the axis ticks. Make sure that the lines are light and small so they  
# don't obscure the primary data lines.  
for y in range(10, 91, 10):  
    plt.plot(range(1968, 2012), [y] * len(range(1968, 2012)), "--", lw=0.5, color="black", alpha=0.3)  

# Remove the tick marks; they are unnecessary with the tick lines we just plotted.  
plt.tick_params(axis="both", which="both", bottom="off", top="off",  
                labelbottom="on", left="off", right="off", labelleft="on")  

# Now that the plot is prepared, it's time to actually plot the data!  
# Note that I plotted the majors in order of the highest % in the final year.  
majors = ['Health Professions', 'Public Administration', 'Education', 'Psychology',  
          'Foreign Languages', 'English', 'Communications\nand Journalism',  
          'Art and Performance', 'Biology', 'Agriculture',  
          'Social Sciences and History', 'Business', 'Math and Statistics',  
          'Architecture', 'Physical Sciences', 'Computer Science',  
          'Engineering']  

for rank, column in enumerate(majors):  
    # Plot each line separately with its own color, using the Tableau 20  
    # color set in order.  
    plt.plot(gender_degree_data.Year.values,  
            gender_degree_data[column.replace("\n", " ")].values,  
            lw=2.5, color=tableau20[rank])  

    # Add a text label to the right end of every line. Most of the code below  
    # is adding specific offsets y position because some labels overlapped.  
    y_pos = gender_degree_data[column.replace("\n", " ")].values[-1] - 0.5  
    if column == "Foreign Languages":  
        y_pos += 0.5  
    elif column == "English":  
        y_pos -= 0.5  
    elif column == "Communications\nand Journalism":  
        y_pos += 0.75  
    elif column == "Art and Performance":  
        y_pos -= 0.25  
    elif column == "Agriculture":  
        y_pos += 1.25  
    elif column == "Social Sciences and History":  
        y_pos += 0.25  
    elif column == "Business":  
        y_pos -= 0.75  
    elif column == "Math and Statistics":  
        y_pos += 0.75  
    elif column == "Architecture":  
        y_pos -= 0.75  
    elif column == "Computer Science":  
        y_pos += 0.75  
    elif column == "Engineering":  
        y_pos -= 0.25  

    # Again, make sure that all labels are large enough to be easily read  
    # by the viewer.  
    plt.text(2011.5, y_pos, column, fontsize=14, color=tableau20[rank])  

# matplotlib's title() call centers the title on the plot, but not the graph,  
# so I used the text() call to customize where the title goes.  

# Make the title big enough so it spans the entire plot, but don't make it  
# so big that it requires two lines to show.  

# Note that if the title is descriptive enough, it is unnecessary to include  
# axis labels; they are self-evident, in this plot's case.  
plt.text(1995, 93, "Percentage of Bachelor's degrees conferred to women in the U.S.A."  
       ", by major (1970-2012)", fontsize=17, ha="center")  

# Always include your data source(s) and copyright notice! And for your  
# data sources, tell your viewers exactly where the data came from,  
# preferably with a direct link to the data. Just telling your viewers  
# that you used data from the "U.S. Census Bureau" is completely useless:  
# the U.S. Census Bureau provides all kinds of data, so how are your  
# viewers supposed to know which data set you used?  
plt.text(1966, -8, "Data source: nces.ed.gov/programs/digest/2013menu_tables.asp"  
       "\nAuthor: Randy Olson (randalolson.com / @randal_olson)"  
       "\nNote: Some majors are missing because the historical data "  
       "is not available for them", fontsize=10)  

# Finally, save the figure as a PNG.  
# You can also save it as a PDF, JPEG, etc.  
# Just change the file extension in this call.  
# bbox_inches="tight" removes all the extra whitespace on the edges of your plot.  
plt.savefig("percent-bachelors-degrees-women-usa.png", bbox_inches="tight")
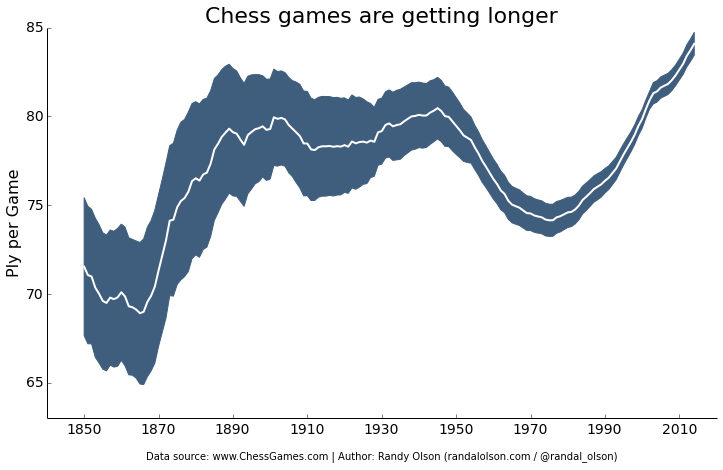
 

chess-number-ply-over-time
 

import pandas as pd
import matplotlib.pyplot as plt
from scipy.stats import sem

# This function takes an array of numbers and smoothes them out.
# Smoothing is useful for making plots a little easier to read.
def sliding_mean(data_array, window=5):
    data_array = array(data_array)
    new_list = []
    for i in range(len(data_array)):
        indices = range(max(i - window + 1, 0),
                        min(i + window + 1, len(data_array)))
        avg = 0
        for j in indices:
            avg += data_array[j]
        avg /= float(len(indices))
        new_list.append(avg)
        
    return array(new_list)

# Due to an agreement with the ChessGames.com admin, I cannot make the data
# for this plot publicly available. This function reads in and parses the
# chess data set into a tabulated pandas DataFrame.
chess_data = read_chess_data()

# These variables are where we put the years (x-axis), means (y-axis), and error bar values.
# We could just as easily replace the means with medians,
# and standard errors (SEMs) with standard deviations (STDs).
years = chess_data.groupby("Year").PlyCount.mean().keys()
mean_PlyCount = sliding_mean(chess_data.groupby("Year").PlyCount.mean().values,
                             window=10)
sem_PlyCount = sliding_mean(chess_data.groupby("Year").PlyCount.apply(sem).mul(1.96).values,
                            window=10)

# You typically want your plot to be ~1.33x wider than tall.
# Common sizes: (10, 7.5) and (12, 9)
plt.figure(figsize=(12, 9))

# Remove the plot frame lines. They are unnecessary chartjunk.
ax = plt.subplot(111)
ax.spines["top"].set_visible(False)
ax.spines["right"].set_visible(False)

# Ensure that the axis ticks only show up on the bottom and left of the plot.
# Ticks on the right and top of the plot are generally unnecessary chartjunk.
ax.get_xaxis().tick_bottom()
ax.get_yaxis().tick_left()

# Limit the range of the plot to only where the data is.
# Avoid unnecessary whitespace.
plt.ylim(63, 85)

# Make sure your axis ticks are large enough to be easily read.
# You don't want your viewers squinting to read your plot.
plt.xticks(range(1850, 2011, 20), fontsize=14)
plt.yticks(range(65, 86, 5), fontsize=14)

# Along the same vein, make sure your axis labels are large
# enough to be easily read as well. Make them slightly larger
# than your axis tick labels so they stand out.
plt.ylabel("Ply per Game", fontsize=16)

# Use matplotlib's fill_between() call to create error bars.
# Use the dark blue "#3F5D7D" as a nice fill color.
plt.fill_between(years, mean_PlyCount - sem_PlyCount,
                 mean_PlyCount + sem_PlyCount, color="#3F5D7D")

# Plot the means as a white line in between the error bars. 
# White stands out best against the dark blue.
plt.plot(years, mean_PlyCount, color="white", lw=2)

# Make the title big enough so it spans the entire plot, but don't make it
# so big that it requires two lines to show.
plt.title("Chess games are getting longer", fontsize=22)

# Always include your data source(s) and copyright notice! And for your
# data sources, tell your viewers exactly where the data came from,
# preferably with a direct link to the data. Just telling your viewers
# that you used data from the "U.S. Census Bureau" is completely useless:
# the U.S. Census Bureau provides all kinds of data, so how are your
# viewers supposed to know which data set you used?
plt.xlabel("\nData source: www.ChessGames.com | "
           "Author: Randy Olson (randalolson.com / @randal_olson)", fontsize=10)

# Finally, save the figure as a PNG.
# You can also save it as a PDF, JPEG, etc.
# Just change the file extension in this call.
# bbox_inches="tight" removes all the extra whitespace on the edges of your plot.
plt.savefig("chess-number-ply-over-time.png", bbox_inches="tight");

Histograms
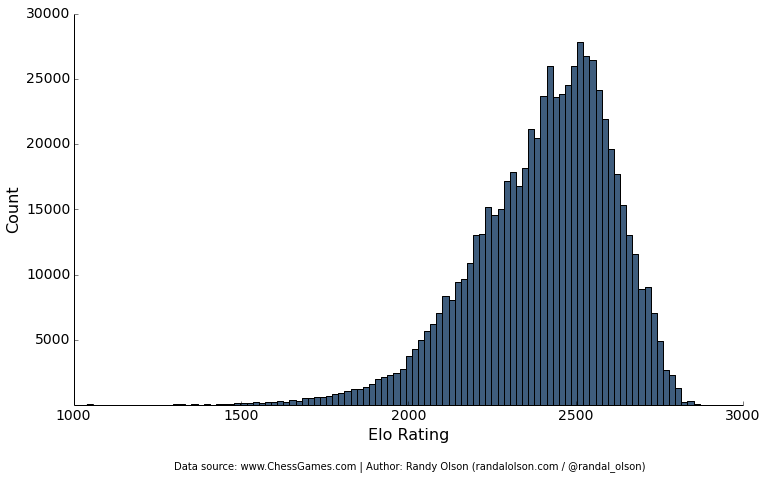
 
chess-elo-rating-distribution


import pandas as pd
import matplotlib.pyplot as plt

# Due to an agreement with the ChessGames.com admin, I cannot make the data
# for this plot publicly available. This function reads in and parses the
# chess data set into a tabulated pandas DataFrame.
chess_data = read_chess_data()

# You typically want your plot to be ~1.33x wider than tall.
# Common sizes: (10, 7.5) and (12, 9)
plt.figure(figsize=(12, 9))

# Remove the plot frame lines. They are unnecessary chartjunk.
ax = plt.subplot(111)
ax.spines["top"].set_visible(False)
ax.spines["right"].set_visible(False)

# Ensure that the axis ticks only show up on the bottom and left of the plot.
# Ticks on the right and top of the plot are generally unnecessary chartjunk.
ax.get_xaxis().tick_bottom()
ax.get_yaxis().tick_left()

# Make sure your axis ticks are large enough to be easily read.
# You don't want your viewers squinting to read your plot.
plt.xticks(fontsize=14)
plt.yticks(range(5000, 30001, 5000), fontsize=14)

# Along the same vein, make sure your axis labels are large
# enough to be easily read as well. Make them slightly larger
# than your axis tick labels so they stand out.
plt.xlabel("Elo Rating", fontsize=16)
plt.ylabel("Count", fontsize=16)

# Plot the histogram. Note that all I'm passing here is a list of numbers.
# matplotlib automatically counts and bins the frequencies for us.
# "#3F5D7D" is the nice dark blue color.
# Make sure the data is sorted into enough bins so you can see the distribution.
plt.hist(list(chess_data.WhiteElo.values) + list(chess_data.BlackElo.values),
         color="#3F5D7D", bins=100)

# Always include your data source(s) and copyright notice! And for your
# data sources, tell your viewers exactly where the data came from,
# preferably with a direct link to the data. Just telling your viewers
# that you used data from the "U.S. Census Bureau" is completely useless:
# the U.S. Census Bureau provides all kinds of data, so how are your
# viewers supposed to know which data set you used?
plt.text(1300, -5000, "Data source: www.ChessGames.com | "
         "Author: Randy Olson (randalolson.com / @randal_olson)", fontsize=10)

# Finally, save the figure as a PNG.
# You can also save it as a PDF, JPEG, etc.
# Just change the file extension in this call.
# bbox_inches="tight" removes all the extra whitespace on the edges of your plot.
plt.savefig("chess-elo-rating-distribution.png", bbox_inches="tight");

Here Goes the Bonus

It takes one more line of code to transform your matplotlib into a phenomenal interactive.


Learn more such tutorials only at DexLab Analytics. We make data visualizations easier by providing excellent Python courses in India. In just few months, you will cover advanced topics and more, which will help you make a career in data analytics.


Interested in a career in Data Analyst?

To learn more about Machine Learning Using Python and Spark – click here.
To learn more about Data Analyst with Advanced excel course – click here.
To learn more about Data Analyst with SAS Course – click here.
To learn more about Data Analyst with R Course – click here.
To learn more about Big Data Course – click here.
When Machines Do Everything – How to Survive?

In the coming years, jobs and businesses are going to be impacted; reason AI. Today’s generation is very much concerned about how the bots will consume everything; from jobs to skills, the smart machines will spare nothing! It is true that machines are going to replace man-powered jobs – by using robots, mundane jobs can be performed in a flick of an eye freeing people working in bigger organisations to innovate and succeed.


Machine Learning training course Pune

Continue reading “When Machines Do Everything – How to Survive?”

How Machine Learning Training Course and AI Made Lives Easier

How Machine Learning Training Course and AI Made Lives Easier

Technological superiority, the rise of the machines and an eventual apocalypse are often highlighted in sci-fi Hollywood movies. The unfavorable impacts of machine learning and excessive dependence on artificial intelligence have always been the hot topic for several Hollywood blockbusters, since years. And people who watch such movies develop a perception that more the technical advancement, higher is the chances that it will ignite a war against humans.

However, in reality, away from the world of Hollywood and motion pictures, Machine Learning and Artificial Intelligence is creating a sensation! If we look past the hype of Hollywood movies, we will understand that the Rise of Machines is certainly not the end of the world or the harbinger of apocalypse but a window of opportunity to achieve technical convenience.

How Things Got Simpler Using Machine Learning Training Course

Though individual are reaping benefits from AI, but it is the business world that is deriving most of its benefits. You will find AI everywhere- from gaming parlors to the humongous amount of data piled in workstation computers. Extensive research is being carried out in this field and scientists and tech gurus are spending huge amount of time in making this improved technology reach the masses. Also, Google and Facebook have placed their high hopes on AI and have also started implementing it in their products and services. Soon, we will see how easily Machine Learning and AI will stream from one product to another.

Data Science Machine Learning Certification

Who Are The Best Users of Machine Learning?

Machine learning cannot be implemented by every SaaS. Then who can be the active users of machine learning? As stated by a spokesperson of a reputable AI company, the implementation of Machine Learning is suitable for companies that have massive amounts of historical data stored. To train a puppy, you need a handful of treats, similarly to tackle an algorithm you need a vast amount of human corrected error-free data.

Secondly, to get the taste of success the companies, who are thinking of implementing AI, need a proper business case. You need a proper plan before you start operating. Always question yourself, whether your machine learning algorithm will be able to reduce your costs, while offering better value. If yes, then it is a green signal for you!

Take machine Learning course from experts who possess incredible math skills! The Machine Learning course in India is offered by DexLab Analytics. For more details, go through our Machine Learning Certification course brochure uploaded on the website. 


.

Call us to know more