Machine Learning institute in Gurgaon Archives - Page 8 of 9 - DexLab Analytics | Big Data Hadoop SAS R Analytics Predictive Modeling & Excel VBA

Summer Internship/Training 101

Summer Internship/Training 101

Hard Fact: Nowadays, all major organizations seek candidates who are technically sound, knowledgeable and creative. They don’t prefer spending time and money on employee training.  Thus, fresh college graduates face a tricky situation.

Summer internship is a quick solution for them. Besides guaranteeing a valuable experience to the fresh graduates, internship helps them secure a quick job. However, the question is what exactly is a summer internship program and how does it help bag the best job in town?

What Is a Summer Internship?

Summer internships are mostly industrial-level training programs for students who are interested in core technical industry domain. Such internships offer students hands-on learning experience while letting them gain glimpses of the real world – following a practical approach. Put simply, summer trainings enhance skills, sharpen theoretical knowledge and are a great way to pursue a flourishing career. In most cases, the candidates are hired by the companies in which they are interning.

The duration of such internships is mostly between eight to twelve weeks following the college semesters. Mostly, they start from May or June and proceeds through August. So, technically, this is the time for summer internships and at DexLab Analytics, we offer industry-relevant certification courses that break open a gamut of job opportunities. Also, such accredited certifications add value to your CV. They help build powerful CVs.

If you are a college student and from Delhi, NCR, drop by DexLab Analytics! Browse through our business analytics, risk analytics, machine learning and data science course sections. Summer internships are your key to success. Hurry now!

Deep Learning and AI using Python

Why Is It Important?

Summers are crucial. If you are college-goer, you will understand that summertime is the most opportune time to explore diverse career interests without being bogged down by homework or classroom assignments.

Day by day, summer internships are becoming popular. Not only do they expose aspiring candidates to the nuances of the big bad world but also hone their communication skills, create great resumes and make them super confident. Building confidence is extremely important. If you want to survive in this competitive industry, you have to present a confident version of you. Summer training programs are great in this respect. Plus, they add value to your resume. A good internship will help you get noticed by the prospective employers. Always, try to add references; however, ask permission from your supervisors before including their names as references in your resume.

Moreover, summer training gives you the scope to experiment and explore options. Suppose, you are pursuing Marketing Major and bagged an internship in the same, but you are not happy with it. Maybe, marketing is not your thing. No worries! Complete your internship and move on.  

On the other hand, let’s say you are very happy with your selected internship and want to do something in the respective field! Finish the internship, wait for some time and then try for recruitment in the same company where you interned or explore possibilities in the same domain.

2

It’s no wonder that summer internships open a roadway of opportunities. The technical aptitude and in-demand skills learned during the training help you accomplish your desired goal in life.

For more advice or expert guide, follow DexLab Analytics.


Interested in a career in Data Analyst?

To learn more about Data Analyst with Advanced excel course – Enrol Now.
To learn more about Data Analyst with R Course – Enrol Now.
To learn more about Big Data Course – Enrol Now.

To learn more about Machine Learning Using Python and Spark – Enrol Now.
To learn more about Data Analyst with SAS Course – Enrol Now.
To learn more about Data Analyst with Apache Spark Course – Enrol Now.
To learn more about Data Analyst with Market Risk Analytics and Modelling Course – Enrol Now.

AI-Related Tech Jargons You Need To Learn Right Now

AI-Related Tech Jargons You Need To Learn Right Now

As artificial intelligence gains momentum and becomes more intricate in nature, technological jargons may turn unfamiliar to you. Evolving technologies give birth to a smorgasbord of new terminologies. In this article, we have tried to compile a few of such important terms that are related to AI. Learn, assimilate and flaunt them in your next meeting.

Artificial Neuron Networks – Not just an algorithm, Artificial Neuron Networks is a framework containing different machine learning algorithms that work together and analyzes complex data inputs.

Backpropagation – It refers to a process in artificial neural networks used to discipline deep neural networks. It is widely used to calculate a gradient that is required in calculating weights found across the network.

2

Bayesian Programming – Revolving around the Bayes’ Theorem, Bayesian Programming declares the probability of something happening in the future based on past conditions relating to the event.

Analogical Reasoning – Generally, the term analogical indicates non-digital data but when in terms of AI, Analogical Reasoning is the method of drawing conclusions studying the past outcomes. It’s quite similar to stock markets.

Data Mining – It refers to the process of identifying patterns from fairly large data sets with the help statistics, machine learning and database systems in combination.

Decision Tree LearningUsing a decision tree, you can move seamlessly from observing an item to drawing conclusions about the item’s target value. The decision tree is represented as a predictive model, the observation as the branches and the conclusion as the leaves.  

Behavior Informatics (BI) – It is of extreme importance as it helps obtain behavior intelligence and insights.

Case-based Reasoning (CBR) – Generally speaking, it defines the process of solving newer challenges based on solutions that worked for similar past issues.

Feature Extraction – In machine learning, image processing and pattern recognition plays a dominant role. Feature Extraction begins from a preliminary set of measured data and ends up building derived values that intend to be non-redundant and informative – leading to improved subsequent learning and even better human interpretations.

Forward Chaining – Also known as forward reasoning, Forward Chaining is one of two main methods of reasoning while leveraging an inference engine. It is a widely popular implementation strategy best suited for business and production rule systems. Backward Chaining is the exact opposite of Forwarding Chaining.

Genetic Algorithm (GA) – Inspired by the method of natural selection, Genetic Algorithm (GA) is mainly used to devise advanced solutions to optimization and search challenges. It works by depending on bio-inspired operators like crossover, mutation and selection.

Pattern Recognition – Largely dependent on machine learning and artificial intelligence, Pattern Recognition also involves applications, such as Knowledge Discovery in Databases (KDD) and Data Mining.

Reinforcement Learning (RL) – Next to Supervised Learning and Unsupervised Learning, Reinforcement Learning is another machine learning paradigms. It’s reckoned as a subset of ML that deals with how software experts should take actions in circumstances so as to maximize notions of cumulative reward.

Looking for artificial intelligence certification in Delhi NCR? DexLab Analytics is a premier big data training institute that offers in-demand skill training courses to interested candidates. For more information, drop by our official website.

The article first appeared on— www.analyticsindiamag.com/25-ai-terminologies-jargons-you-must-assimilate-to-sound-like-a-pro


Interested in a career in Data Analyst?

To learn more about Data Analyst with Advanced excel course – Enrol Now.
To learn more about Data Analyst with R Course – Enrol Now.
To learn more about Big Data Course – Enrol Now.

To learn more about Machine Learning Using Python and Spark – Enrol Now.
To learn more about Data Analyst with SAS Course – Enrol Now.
To learn more about Data Analyst with Apache Spark Course – Enrol Now.
To learn more about Data Analyst with Market Risk Analytics and Modelling Course – Enrol Now.

A Beginner’s Guide to Learning Data Science Fundamentals

A Beginner’s Guide to Learning Data Science Fundamentals

I’m a data scientist by profession with an actuarial background.

I graduated with a degree in Criminology; it was during university that I fell in love with the power of statistics. A typical problem would involve estimating the likelihood of a house getting burgled on a street, if there has already been a burglary on that street. For the layman, this is part of predictive policing techniques used to tackle crime. More technically, “It involves a Non-Markovian counting process called the “Hawkes Process” which models for “self-exciting” events (like crimes, future stock price movements, or even popularity of political leaders, etc.)

Being able to predict the likelihood of future events (like crimes in this case) was the main thing which drew me to Statistics. On a philosophical level, it’s really a quest for “truth of things” unfettered by the inherent cognitive biases humans are born with (there are 25 I know of).

2

Arguably, Actuaries are the original Data Scientists, turning data in actionable insights since the 18th Century when Alexander Webster with Robert Wallace built a predictive model to calculate the average life expectancy of soldiers going to war using death records. And so, “Insurance” was born to provide cover to the widows and children of the deceased soldiers.

Of course, Alan Turing’s contribution cannot be ignored, which eventually afforded us with the computational power needed to carry out statistical testing on entire populations – thereby Machine Learning was born. To be fair, the history of Data Science is an entire blog of its own. More on that will come later.

The aim of this series of blogs is to initiate anyone daunted by the task of acquiring the very basics of Statistics and Mathematics used in Machine Learning. There are tonnes of online resources which will only list out the topics but will rarely explain why you need to learn them and to what extent. This series will attempt to address this problem adopting a “first principle” approach. Its best to refer back to this article a second time after gaining the very basics of each Topic discussed below:

We will be discussing:

  • Central Limit Theorem
  • Bayes Theorem
  • Probability Theory
  • Point Estimation – MLE’s
  • Confidence Intervals
  • P-values and Significance Test.

This list is by no means exhaustive of the statistical and mathematical concepts you will need in your career as a data scientist. Nevertheless, it provides a solid grounding going into more advanced topics.

Without further due, here goes:

Central Limit Theorem

Central Limit Theorem (CLT) is perhaps one of the most important results in all of Statistics. Essentially, it allows making large sample inference about the Population Mean (μ), as well as making large sample inference about population proportion (p).

So what does this really means?

Consider (X1, X2, X3……..Xn) samples, where n is a large number say, 100. Each sample will have its own respective sample Mean (x̅). This will give us “n” number of sample means. Central Limit Theorem now states:

                                                                                                &

Try to visualise the distribution “of the average of lots of averages”… Essentially, if we have a large number of averages that have been taken from a corresponding large number of samples; then Central Limit theorem allows us to find the distribution of those averages. The beauty of it is that we don’t have to know the parent distribution of the averages. They all tend to Normal… eventually!

Similarly if we were to add up independent and identically distributed (iid) samples, then their corresponding distribution will also tend to a Normal.

Very often in your work as a data scientist a lot of the unknown distributions will tend to Normal, now you can visualise how and more importantly why!

Stay tuned to DexLab Analytics for more articles discussing the topics listed above in depth. To deep dive into data science, I strongly recommend this Big Data Hadoop institute in Delhi NCR. DexLab offers big data courses developed by industry experts, helping you master in-demand skills and carve a successful career as a data scientist.

About the Author: Nish Lau Bakshi is a professional data scientist with an actuarial background and a passion to use the power of statistics to tackle various pressing, daily life problems.


Interested in a career in Data Analyst?

To learn more about Data Analyst with Advanced excel course – Enrol Now.
To learn more about Data Analyst with R Course – Enrol Now.
To learn more about Big Data Course – Enrol Now.

To learn more about Machine Learning Using Python and Spark – Enrol Now.
To learn more about Data Analyst with SAS Course – Enrol Now.
To learn more about Data Analyst with Apache Spark Course – Enrol Now.
To learn more about Data Analyst with Market Risk Analytics and Modelling Course – Enrol Now.
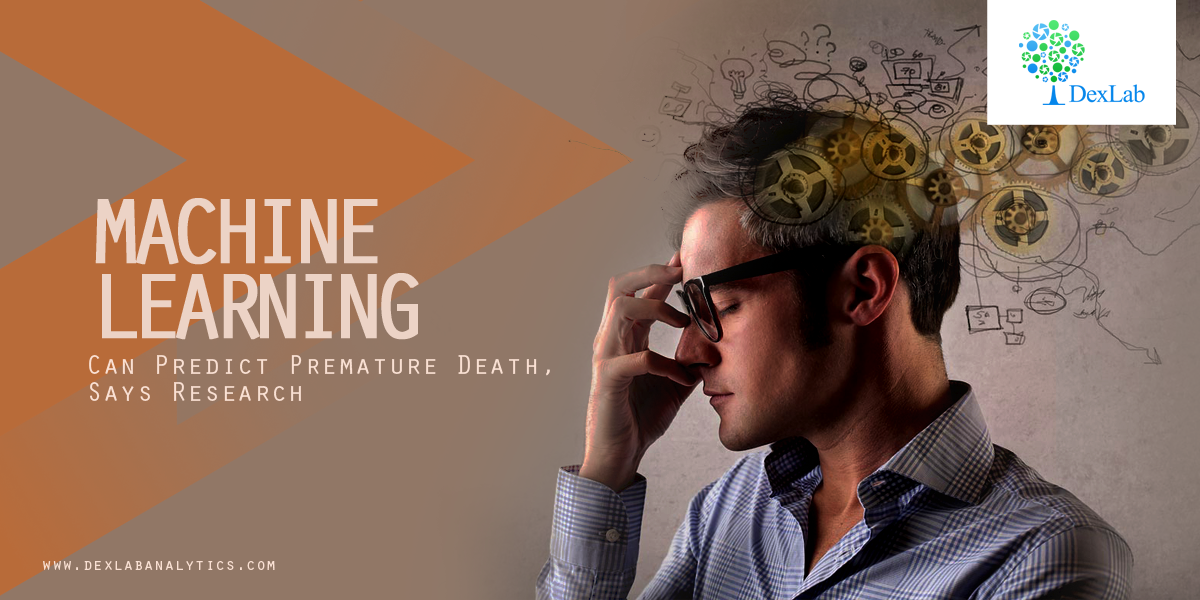
Now Machine Learning Can Predict Premature Death, Says Research

Now Machine Learning Can Predict Premature Death, Says Research

Machine Learning yet again added another feather in its cap; a team of researchers tried and tested a suave machine learning system that can now predict early death. Yes, premature death can now be estimated, courtesy a robust technology and an outstanding panel of researchers from the University of Nottingham! At first, it may sound weird and something straight out of a science fiction novel, but fret not – machine learning has proved itself in improving the status of preventive healthcare and now it’s ready to venture into new unexplored medical territories.

Prediction at Its Best

Published in PLOS ONE in one of their special editions of Machine Learning in Health and Biomedicine, the study delves into how myriad AI and ML tools can be leveraged across diverse healthcare fields. The technology of ML is already reaping benefits in cancer detection, thanks to its sophisticated quantitative power. These new age algorithms are well-equipped to predict death risks of chronic diseases way ahead of time from a widely distributed middle-aged population.

To draw clear conclusions, the team collected data of more than half a million people falling within the age group of 40 and 69 from the UK Biobank. The data collection is from the period 2006-2010, followed up till 2016. With this data in tow, the experts analyze biometric, demographic, lifestyle and clinical factors in each individual subject. Robust machine learning models are used in the process.

Adding in, the team observed dietary consumption of vegetables, fruits and meat per day of each subject. Later, the team from Nottingham University proceeded to predict the mortality of these individuals.

“We mapped the resulting predictions to mortality data from the cohort, using Office of National Statistics death records, the UK cancer registry and ‘hospital episodes’ statistics,” says Dr. Stephen Weng, assistant professor of Epidemiology and Data Science.  “We found machine-learned algorithms were significantly more accurate in predicting death than the standard prediction models developed by a human expert.”

Accuracy and Outcome

The researchers involved in this ambitious project are excited to the bones. They are eager about the outcomes. They are in fact looking forward to a time where medical professionals would be able to distinguish potential health hazards in patients with on-point accuracy and evaluate the following steps that would lead the way towards prevention. “We believe that by clearly reporting these methods in a transparent way, this could help with scientific verification and future development of this exciting field for health care”, shares Dr. Stephen Weng.

As closing thoughts, the research is expected to build the foundation of enhanced medicine capabilities and deliver customized healthcare facilities tailoring risk management for each individual patient. The Nottingham research draws inspiration from a similar study where machine learning techniques were used to predict cardiovascular diseases.

Data Science Machine Learning Certification

In case, you are interested in Machine Learning Using Python training course, DexLab Analytics is the place to be. With a volley of in-demand skill training courses, including Python certification training and AI training, we are one of the best in town. For details, check out our official website RN.

 
The blog has been sourced from
interestingengineering.com/machine-learning-algorithms-are-now-able-to-predict-premature-death


.

Big Data Analytics for Event Processing

Courtesy cloud and Internet of Things, big data is gaining prominence and recognition worldwide. Large chunks of data are being stored in robust platforms such as Hadoop. As a result, much-hyped data frameworks are clouted with ML-powered technologies to discover interesting patterns from the given datasets.

Defining Event Processing

In simple terms, event processing is a typical practice of tracking and analyzing a steady stream of data about events to derive relevant insights about the events taking place real time in the real world. However, the process is not as easy as it sounds; transforming the insights and patterns quickly into meaningful actions while hatching operational market data in real time is no mean feat. The whole process is known as ‘fast data approach’ and it works by embedding patterns, which are panned out from previous data analysis into the future transactions that take place real time.

2

Employing Analytics and ML Models

In some instances, it is crucial to analyze data that is still in motion. For that, the predictions must be proactive and must be determined in real-time. Random forests, logistic regression, k-means clustering and linear regression are some of the most common machine learning techniques used for prediction needs. Below, we’ve enlisted the analytical purposes for which the organizations are levering the power of predictive analytics:

Developing the Model – The companies ask the data scientists to construct a comprehensive predictive model and in the process can use different types of ML algorithms along with different approaches to fulfill the purpose.

Validating the Model – It is important to validate a model to check if it is working in the desired manner. At times, coordinating with new data inputs can give a tough time to the data scientists. After validation, the model has to further meet the improvement standards to deploy real-time event processing.

Top 4 Frameworks for ML in Event Processing

Apache Spark

Ideal for batch and streaming data, Apache Spark is an open-source parallel processing framework. It is simple, easy to use and is ideal for machine learning as it supports cluster-computing framework.

Hadoop

If you are looking for an open-source batch processing framework then Hadoop is the best you can get. It not only supports distributed processing of large scale data sets across different clusters of computers with a single programming model but also boasts of an incredibly versatile library.

Apache Storm

Apache Storm is a cutting edge open source, big data processing framework that supports real-time as well as distributed stream processing. It makes it fairly easy to steadily process unbounded streams of data working on real-time.

IBM Infosphere Streams

IBM Infosphere Streams is a highly-functional platform that facilitates the development and execution of applications that channels information in data streams. It also boosts the process of data analysis and improves the overall speed of business decision-making and insight drawing.

If you are interested in reading more such blogs, you must follow us at DexLab Analytics. We are the most reputed big data training center in Delhi NCR. In case, if you have any query regarding big data or Machine Learning using Python, feel free to reach us anytime.


Interested in a career in Data Analyst?

To learn more about Data Analyst with Advanced excel course – Enrol Now.
To learn more about Data Analyst with R Course – Enrol Now.
To learn more about Big Data Course – Enrol Now.

To learn more about Machine Learning Using Python and Spark – Enrol Now.
To learn more about Data Analyst with SAS Course – Enrol Now.
To learn more about Data Analyst with Apache Spark Course – Enrol Now.
To learn more about Data Analyst with Market Risk Analytics and Modelling Course – Enrol Now.

AI Jobs: What the Future Holds?

AI Jobs: What the Future Holds?

Technological revolutions have always been challenging, especially how they influence and impact working landscapes. They either bring on an unforeseen crisis or prove a boon; however, fortunately, the latter has always been the case, starting from the innovation of steam engines to Turing machine to computers and now machine learning and artificial intelligence.

The crux of the matter lies in persistence, perseverance and patience, needed to make these high-end technologies work in the desired way and transform the resources into meaningful insights tapping the unrealized opportunities. Talking of which, we are here to discuss the growth and expansion of AI-related job scopes in the workplace, which is expected to generate around 58 million new jobs in the next couple of years. Are you ready?

Data Analysts

Internet of Things, Machine Learning, Data Analytics and Image Analysis are the IT technologies of 2019. An exponential increase in the use of these technologies is to be expected. Humongous volumes of data are going to be leveraged in the next few years, but for that, superior handling and management skill is a pre-requisite. Only expert consultants adept at hoarding, interpreting and examining data in a meaningful manner can strategically fulfill business goals and enhance productivity.

Interested in Machine Learning course in India? Reach us at DexLab Analytics.

IT Trainers

With automation and machine learning becoming mainstream, there is going to be a significant rise in the number of IT Trainer jobs. Businesses have to appoint these professionals for the purpose of two-way training, including human intelligence as well as machines. On one side, they will have to train AI devices to grasp a better understanding of human minds, while, on the other hand, the objective will be training employees so as to utilize the power of AI effectively subject to their job responsibilities and subject profiles. Likewise, there is going to be a gleaming need for machine learning developers and AI researchers who are equipped to instill human-like intelligence and intuition into the machines – making them more efficient, more powerful.

Man-Machine Coordinators

Agreed or not, the interaction between automated bots and human brainpower will lead to immense chaos – if not managed properly. Organizations have great hope in this man-machine partnership, and to ensure they work in sync with each other, business will seek experts, who can devise incredible roadmaps to tap newbie opportunities. The objective of this job profile is to design and manage an interaction system through which machines and humans can mutually collaborate and communicate their abilities and intentions.

Data Science Machine Learning Certification

Security Analysts

Security is crucial. The moment the world switched from offline to online, a whole lot of new set of crimes and frauds came into notice. To protect and safeguard confidential information and high-profile business identities, companies are appointing skilled professionals who are well-trained in tracking, protecting and recovering AI systems and devices from malicious cyber intrusions and attacks. Thus, skill and expertise in information security, networking and guaranteeing privacy is well-appreciated.

No wonder, a good number of jobs are going to dissolve with AI, but also, an ocean of new job opportunities will flow in with time. You just have to hone your skills and for that, we have artificial intelligence certification in Delhi NCR. In situations like this, these kinds of in-demand skill-training courses are your best bet.


The blog has been sourced from  www.financialexpress.com/industry/technology/artificial-intelligence-are-you-ready-for-ocean-of-new-jobs-as-many-old-ones-will-vanish/1483437


.

Know All about Usage-Driven Grouping of Programming Languages Used in Data Science

Know All about Usage-Driven Grouping of Programming Languages Used in Data Science

Programming skills are indispensable for data science professionals. The main job of machine learning engineers and data scientists is drawing insights from data, and their expertise in programming languages enable them to do this crucial task properly. Research has shown that professionals of the data science field typically work with three languages simultaneously. So, which ones are the most popular? Are some languages more likely to be used together?

Recent studies explain that certain programming languages are used jointly besides other programming languages that are used independently. With the survey data collected from Kaggle’s 2018 Machine Learning and Data Science study, usage patterns of over 18,000 data science experts working with 16 programming languages were analyzed. The research revealed that these languages can actually be categorized into smaller sets, resulting in 5 main groupings. The nature of the groupings is indicative of specific roles or applications that individual groups support, like analytics, front-end work and general-purpose tasks.

2

Principal Component Analysis for Dimension Reduction

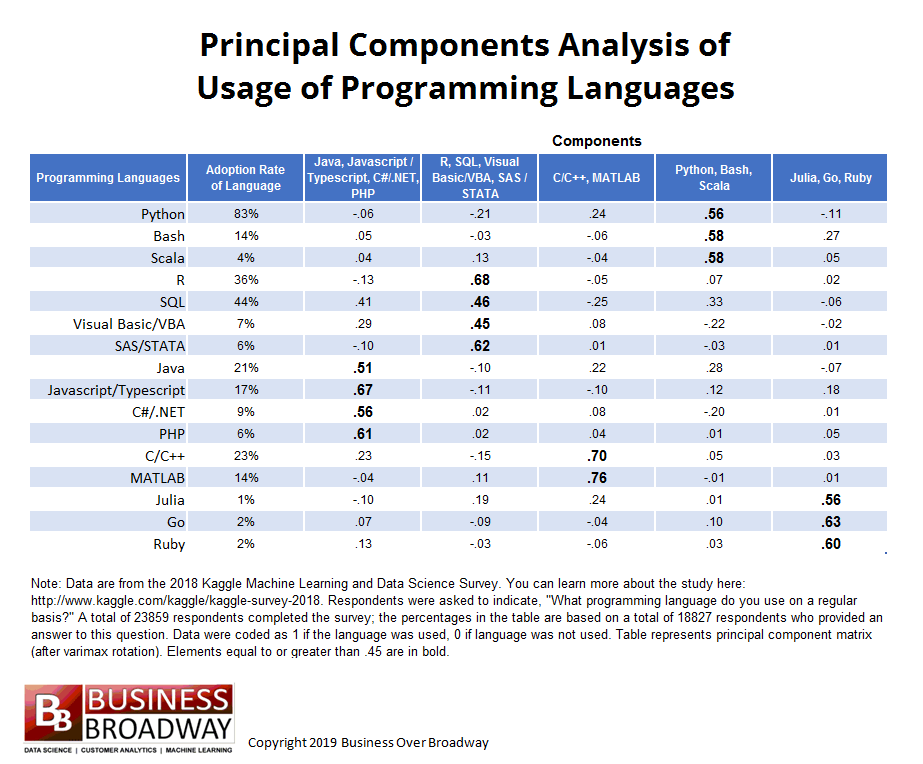
In this article, we will explain how Bob E. Hayes, PhD holder, scientist, blogger and data science writer has used principal component analysis, a type of data reduction method, to categorize 16 different programming languages. Herein, the relationship among various languages is inspected before putting them in particular groups. Basically, principal component analysis looks into statistical associations like covariance within a large collection of variables, and then justifies these correlations with the help of a few variables, called components.

Principal component matrix presents the results of this analysis. The matrix is an nXm table, where:

n= total no. of original variables, which in this case are the number of programming languages

m= number of main components

The strength of relationship between each language and underlying components is represented by the elements of the matrix. Overall, the principal component analysis of programming language usage gives us two important insights:

  • How many underlying components (groupings of programming languages) describe the preliminary set of languages
  • The languages that go best with each programming language grouping

Result of Principal Component Analysis:

The nature of this analysis is exploratory, meaning no pre-defined structure was imposed on the data. The result was primarily driven by the type of relationship shared by the 16 languages. The aim was to explain the relationships with as less components as possible. In addition, few rules of thumb were used to establish the number of components. One was to find the number of eigen values with value greater than 1 – that number determines the number of components. Another method is to identify the breaking point in the scree plot, which is a plot of the 16 eigen values.

businessoverbroadway.com


5-factor solution was chosen to describe the relationships. This is owing to two reasons – firstly, 5 eigen values were greater than one and secondly, the scree plot showed a breaking point around 6th eigen value.

Following are two key interpretations from the principal component matrix:

  • Values greater than equal to .45 have been made bold
  • The headings of different components are named on the basis of tools that loaded highly on that component. For example, component 4 has been labeled as Python, Bash, Scala because these languages loaded highest on this component, implying respondents are likely to use Bash and Scala if they work with Python. Other 4 components were labeled in a similar manner.

Groupings of Programming Languages

The given data set is appropriately described by 5 tool grouping. Below are given 5 groupings, including the particular languages that fall within the group, meaning they are likely to be used together.

  1. Java, Javascript/Typescript, C#/.NET, PHP
  2. R, SQL, Visual Basic/VBA, SAS/STATA
  3. C/C++, MATLAB
  4. Python, Bash, Scala
  5. Julia, Go, Ruby

One programming language didn’t properly load into any of the components: SQL. However, SQL is used moderately with three programming languages, namely Java (component 1), R (component 2) and Python (component 4).

It is further understood that the groupings are determined by the functionality of different languages in the group. General-purpose programming languages, Python, Scala and Bash, got grouped under a single component, whereas languages used for analytical studies, like R and the other languages under comp. 2, got grouped together. Web applications and front-end work are supported by Java and other tools under component 1.

Conclusion:

Data science enthusiasts can succeed better in their projects and boost their chances of landing specific jobs by choosing correct languages that are suited for the job role they want. Being skilled in a single programming language doesn’t cut it in today’s competitive industry. Seasoned data professionals use a set of languages for their projects. Hence, the result of the principal component analysis implies that it’s wise for data pros to skill up in a few related programming languages rather than a single language, and focus on a specific part of data science.

For more help with your data science learning, get in touch with DexLab Analytics, a leading data analyst training institute in Delhi. Also check our Machine learning courses in Delhi to be trained in the essential and latest skills in the field.

 
Reference: http://customerthink.com/usage-driven-groupings-of-data-science-and-machine-learning-programming-languages
 

Interested in a career in Data Analyst?

To learn more about Data Analyst with Advanced excel course – Enrol Now.
To learn more about Data Analyst with R Course – Enrol Now.
To learn more about Big Data Course – Enrol Now.

To learn more about Machine Learning Using Python and Spark – Enrol Now.
To learn more about Data Analyst with SAS Course – Enrol Now.
To learn more about Data Analyst with Apache Spark Course – Enrol Now.
To learn more about Data Analyst with Market Risk Analytics and Modelling Course – Enrol Now.
5 Great Takeaways from Machine Learning Conference 2019

5 Great Takeaways from Machine Learning Conference 2019

Machine Learning Developer Summit, one of the leading Machine Learning conferences of India, happening on the 30th and 31st of January 2019 in Bangalore, aims to assemble machine leaning and data science experts and enthusiasts from all over India. Organized by Analytics India Magazine, this high-level meeting will be the hotspot for conversing about the latest developments in machine learning. Attendees can gather immense knowledge from ML experts and innovators from top tech enterprises, and network with individuals belonging to data sciences. Actually, there are tons of rewards for those attending MLDS 2019. Below are some of the best takeaways:

  1. Creation of Useful Data Lake on AWS

In a talk by reputable Raghuraman Balachandran, Solutions Architect for Amazon Web Services, participants will learn how to design clean, dependable data lakes on AWS cloud. He shall also share his experienced outlook on tackling some common challenges of designing an effective data lake. Mr Balachandran will explain the process to store raw data – unstructured, semi-structured or completely structured – and processed data for different analytical uses.

Data lakes are the most used architectures in data-based companies. This talk will allow attendees to develop a thorough understanding of the concept, which is sure to boost their skill set for getting hired.

2

  1. Improve Inference Phase for Deep Learning Models

Deep learning models require considerable system resources, including high-end CPUs and GPUs for best possible training. Even after exclusive access to such resources, there may be several challenges in the target deployment phase that were absent in the training environment.

Sunil Kumar Vuppala, Principal Scientist at Philips Research, will discuss methods to boost the performance of DL models during their inference phase. Further, he shall talk about using Intel’s inference engine to improve quality of DL models run in Tensorflow/Caffe/Keras via CPUs.

  1. Being more employable amid the explosive growth in AI and its demand

The demand for AI skills will skyrocket in future – so is the prediction of many analysts considering the extremely disruptive nature of AI. However, growth in AI skills isn’t occurring at the expected rate. Amitabh Mishra, who is the CTO at Emcure Pharmaceuticals, addresses the gap in demand and development of AI skills, and shall share his expert thoughts on the topic. Furthermore, he will expand on the requirements in AI field and provide preparation tips for AI professionals.

  1. Walmart AI mission and how to implement AI in low-infrastructure situations

In the talk by Senior Director of Walmart Lab, Prakhar Mehrotra, audiences get a view of Walmart’s progress in India. Walmart Lab is a subsidiary of the global chain Walmart, which focuses on improving customer experience and designing tech that can be used with Merchants to enhance the company’s range. Mr Mehrotra will give details about Wallmart’s AI journey, focusing on the advancements made so far.

  1. ML’s important role in data cleansing

A good ML model comes from a clean data lake. Generally, a significant amount of time and resources invested in building a robust ML model goes on data cleansing activities. Somu Vadali, Chief of Future Group’s CnD Labs Data and Products section, will talk about how ML can be used to clean data more efficiently. He will speak at length about well-structured processes that allow organizations to shift from raw data to features in a speedy and reliable manner. Businesses may find his talk helpful to reduce their time-to-market for new models and increase efficiency of model development.

Machine learning is the biggest trend of IT and data science industry. In fact, day by day it is gaining more prominence in the tech industry, and is likely to become a necessary skill to get bigger in all fields of employment. So, maneuver your career towards excellence by enrolling for machine learning courses in India. Machine learning course in Gurgaon by DexLab Analytics is tailor-made for your specific needs. Both beginners and professionals find these courses apt for their growth.


Interested in a career in Data Analyst?

To learn more about Data Analyst with Advanced excel course – Enrol Now.
To learn more about Data Analyst with R Course – Enrol Now.
To learn more about Big Data Course – Enrol Now.

To learn more about Machine Learning Using Python and Spark – Enrol Now.
To learn more about Data Analyst with SAS Course – Enrol Now.
To learn more about Data Analyst with Apache Spark Course – Enrol Now.
To learn more about Data Analyst with Market Risk Analytics and Modelling Course – Enrol Now.

Being a Statistician Matters More, Here’s Why

Being a Statistician Matters More, Here’s Why

Right data for the right analytics is the crux of the matter. Every data analyst looks for the right data set to bring value to his analytics journey. The best way to understand which data to pick is fact-finding and that is possible through data visualization, basic statistics and other techniques related to statistics and machine learning – and this is exactly where the role of statisticians comes into play. The skill and expertise of statisticians are of higher importance.

2

Below, we have mentioned the 3R’s that boosts the performance of statisticians:

Recognize – Data classification is performed using inferential statistics, descriptive and diverse other sampling techniques.

Ratify – It’s very important to approve your thought process and steer clear from acting on assumptions. To be a fine statistician, you should always indulge in consultations with business stakeholders and draw insights from them. Incorrect data decisions take its toll.

Reinforce – Remember, whenever you assess your data, there will be plenty of things to learn; at each level, you might discover a new approach to an existing problem. The key is to reinforce: consider learning something new and reinforcing it back to the data processing lifecycle sometime later. This kind of approach ensures transparency, fluency and builds a sustainable end-result.

Now, we will talk about the best statistical techniques that need to be applied for better data acknowledgment. This is to say the key to becoming a data analyst is through excelling the nuances of statistics and that is only possible when you possess the skills and expertise – and for that, we are here with some quick measures:

Distribution provides a quick classification view of values within a respective data set and helps us determine an outlier.

Central tendency is used to identify the correlation of each observation against a proposed central value. Mean, Median and Mode are top 3 means of finding that central value.

Dispersion is mostly measured through standard deviation because it offers the best scaled-down view of all the deviations, thus highly recommended.

Understanding and evaluating the data spread is the only way to determine the correlation and draw a conclusion out of the data. You would find different aspects to it when distributed into three equal sections, namely Quartile 1, Quartile 2 and Quartile 3, respectively. The difference between Q1 and Q3 is termed as the interquartile range.

While drawing a conclusion, we would like to say the nature of data holds crucial significance. It decides the course of your outcome. That’s why we suggest you gather and play with your data as long as you like for its going to influence the entire process of decision-making.

On that note, we hope the article has helped you understand the thumb-rule of becoming a good statistician and how you can improve your way of data selection. After all, data selection is the first stepping stone behind designing all machine learning models and solutions.

Saying that, if you are interested in learning machine learning course in Gurgaon, please check out DexLab Analytics. It is a premier data analyst training institute in the heart of Delhi offering state-of-the-art courses.


The blog has been sourced from www.analyticsindiamag.com/are-you-a-better-statistician-than-a-data-analyst


Interested in a career in Data Analyst?

To learn more about Data Analyst with Advanced excel course – Enrol Now.
To learn more about Data Analyst with R Course – Enrol Now.
To learn more about Big Data Course – Enrol Now.

To learn more about Machine Learning Using Python and Spark – Enrol Now.
To learn more about Data Analyst with SAS Course – Enrol Now.
To learn more about Data Analyst with Apache Spark Course – Enrol Now.
To learn more about Data Analyst with Market Risk Analytics and Modelling Course – Enrol Now.
Call us to know more