Machine Learning Courses Archives - Page 7 of 9 - DexLab Analytics | Big Data Hadoop SAS R Analytics Predictive Modeling & Excel VBA

Get Introduced to Big Data Analytic Techniques and Fly High

Big data is the big word, NOW. Data sets are becoming more and more large and complex, making it extremely troublesome to coordinate activities using on-hand database management tools.
Get-Introduced-to-Big-Data-Analytic-Techniques-and-Fly-High
The flourishing growth in IT industry has triggered numerous complimentary conditions. One of the conditions is the emergence of Big Data. This two-word seven-letter catch phrase deals with a humongous amount of data, which is of prime importance in the eyes of the company in question. And the resultant effect leads to another branch of science, which is Data Analytics.

What is A/B Testing?

A/B Testing is a powerful assessment tool to determine which version of an app or a webpage helps an individual or his business meet future goals effectively and positively. The decision is not abrupt; it is taken after carefully comparing various versions to reveal out the best of the lot.

Also read: Big Data Analytics and its Impact on Manufacturing Sector

A/B Testing forms an integral part in web development and big data industry. It ensures that the alterations happening on a webpage or any page component are data-driven and not opinion-based.

What do you mean by Association Rule Learning

This comprises of a set of techniques to find out interesting relationships, i.e. ‘association rules’ amidst variables in massive databases. The methods include an assortment of algorithms to initiate and test possible rules.

Also read: What Sets Apart Data Science from Big Data and Data Analytics

The following flowchart, a market basket analysis is being focused. Here, a retailer ascertains which products are high in demand and eventually use this data for successful marketing.

How to understand Classification Tree Analysis?

Statistical Classification is implemented to:

  • Classify organisms into groups
  • Automatically allocate documents to categories
  • Create profiles of students who enrol for online courses
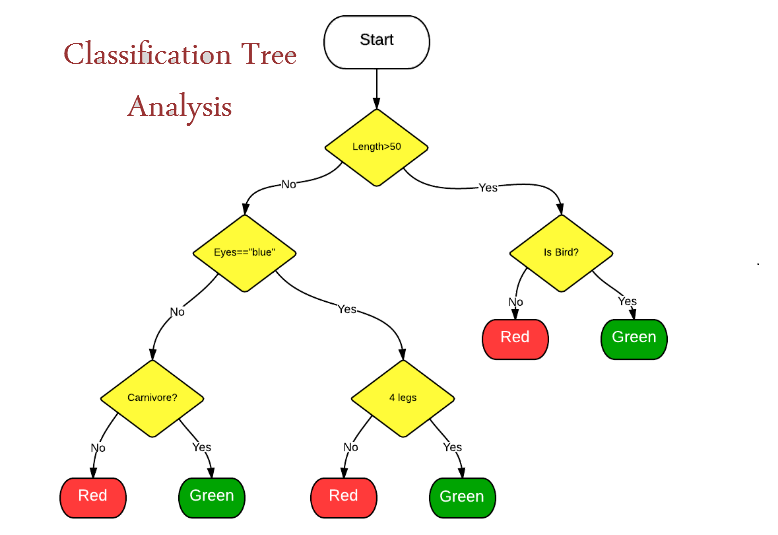
It is a method of recognizing categories, in which the new observation falls into. It needs a training set of appropriately identified observations, aka historical data.

Why should you take a sneak peek into the world of Data Fusion and Data Integration?

Well, this is a complex multi-level process involving correlation, association, combination of information and data from one and many sources, to attain a superior position, determine estimates and finish timely assessments of projects. By combining data from multiple sensors, data integration and fusion helps in improving overall accuracy and direct more specific inferences, which would have otherwise been impossible from a single sensor alone. 

Also read: How To Stop Big Data Projects From Failing?

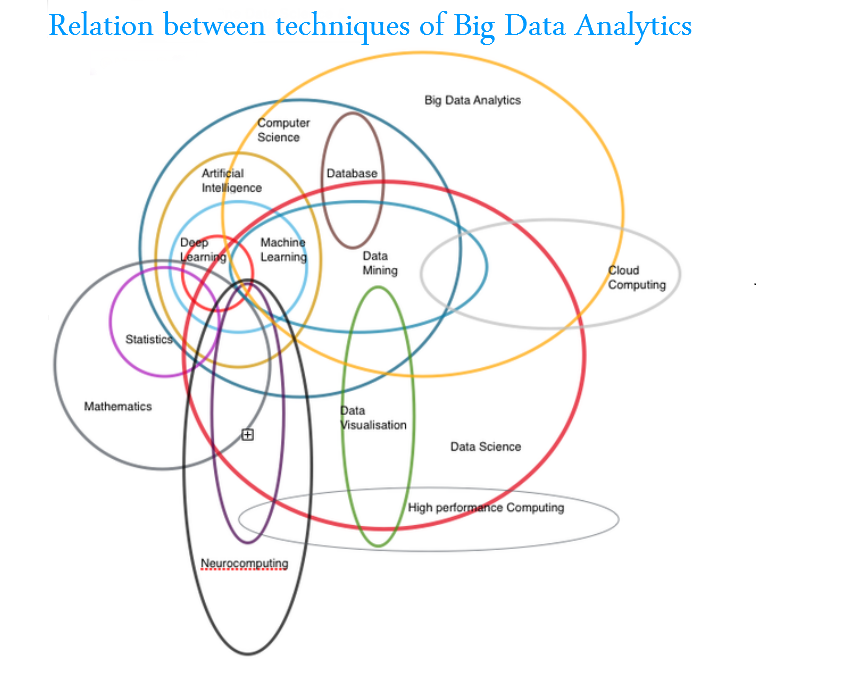
Let’s talk about Data Mining

Identify patterns and strike relationships, with Data Mining. It is nothing but the collective data extraction techniques to be performed on a large chunk of data. Some of the common data mining parameters are Association, Classification, Clustering, Sequence Analysis and Forecasting.

Generally, applications involve mining customer data to deduce segments and understand market basket analyses. It helps understanding the purchase behaviour of customers.
Neural Networks – Resembling biological neural networks

Non-linear predictive models are mostly used for pattern recognition and optimization. Some of the applications ask for supervised learning, whereas some invites unsupervised learning.

To know more about Big Data certification, why don’t you check our extensive Machine Learning Certification courses in Gurgaon! We, at DexLab Analytics have all sorts of courses suiting your professional work skill.


Interested in a career in Data Analyst?

To learn more about Machine Learning Using Python and Spark – click here.
To learn more about Data Analyst with Advanced excel course – click here.
To learn more about Data Analyst with SAS Course – click here.
To learn more about Data Analyst with R Course – click here.
To learn more about Big Data Course – click here.

Artificial Intelligence: What the Future Holds for India, Next to US

Is artificial intelligence outgrowing human intelligence? Is AI becoming smarter than we are?

Artificial Intelligence: What the Future Holds for India, Next to US

In the United States – the world’s unchallenged superpower, a new strange issue has popped up, which is being discussed on all the major interactive platforms, like books, talk-shows, YouTube, etc. but to no avail. The issue-in-question is addressed in the beginning of the blog.

Also read: Learn to Surf on the Three Waves of Artificial Intelligence

Will computer intelligence exceed human intelligence?

In India, this doesn’t seem to bother us much. For us, computers are electronic devices that we control, that we command. Our smartphones and tablets are treated as our servants and not our masters. But I wonder for how long will this persist? How long will we be able to refrain ourselves from being influenced by the West? Well, that’s another question to answer and let’s keep it for another day!

Also read: What Makes Artificial Intelligence So Incredibly Powerful?

In the US, some of the tech pundits are working tirelessly on the newer realms of AI each day and speculating what will happen when computer programmes finally overhauls human brain in thinking abilities. Intelligence is a set of information, and the potential to know how to use it.

Also read: How Machine Learning Training Course and AI Made Lives Easier

Since 1990, computer technology has evolved substantially and has become nifty in intelligence. Let’s take the example of self driving cars ploughing the American roads. A fully independent, self-driving car is no more a VFX-induced scene from a sci-fi fantasy movie; in two years or more, they will be found dominating the streets of the US and trust me they will be a reality! Sit in your car, read a book or sleep while your car reaches its destination on its own. This car will perform all those functions that you used to do, giving you a hiatus from driving!

Also read: DexLab Analytics’ Take on the scope of Artificial Intelligence: Its Humanity vs. Algorithms

The boons of AI don’t end here, it’s thriving and improving faster. Why? Because, humans need to address a whole lot of problems with the help of technology. From conducting complicated surgeries to developing hi-tech BI tools, the scope of computer intelligence is vast and still increasing.


Another crucial factor is that the human brain is limited and can only contain a fixed amount of cerebral cortex and related substances that helps us think and remember. Beyond that, there is no scope for expansion, but in computer technology, the sky is the limit. It is possible to create a computer as large as a 3-storeyed building and store humongous amount of data in it.

6

The research says within the next 25 years, computer intelligence will become so efficacious that it will leave behind man’s intelligence in every way. So, what are you waiting for you? Give your career a robust boost with R programming courses. Reach us at DexLab Analytics, a leading R language certification institute for more queries.


Interested in a career in Data Analyst?

To learn more about Machine Learning Using Python and Spark – click here.
To learn more about Data Analyst with Advanced excel course – click here.
To learn more about Data Analyst with SAS Course – click here.
To learn more about Data Analyst with R Course – click here.
To learn more about Big Data Course – click here.

How will IoT help Industrial Class?

How will IoT help Industrial Class?

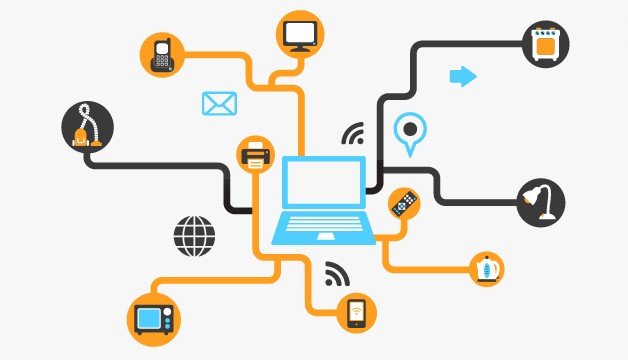
Internet of Things (IoT) is the new buzz these days. The new tide of connectivity goes beyond smartphones and laptops. It includes smart homes, smart cities, smart cars, connected wearables and tries to provide a “Connected Life”. People are increasingly becoming aware of the applications of IoT in their daily lives.

AAEAAQAAAAAAAAJMAAAAJDcyN2I4ZTE5LTI4M2UtNDQyMC1hMjI0LTdkNzNkMWI5NzNhMQ

However, little do they know about the application of IoT in Industries, commonly known as “Industrial IoT”. Through this blog, we would like to share our thoughts on how IoT can save time, energy and money in industries.

SUPPLY CHAIN MANAGEMENT

cloud-computing-in-supply-chain1

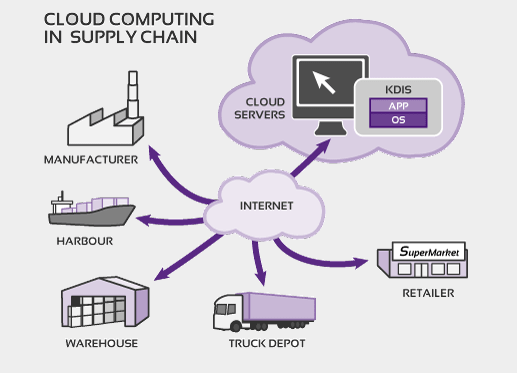
Notable research firm, Gartner in its research highlighted that a thirty-fold increase in Internet-connected physical devices by the year 2020 will significantly alter the mechanism in which supply chain operates. For quite some time, ERP and Supply Chain Management have been going hand-in-hand. However, IoT will revolutionize the entire supply chain management process by smartly connecting people, processes, data and things through sensors and devices.

Through IoT, a firm can do the following tasks:

  • Real time fleet management – A firm can optimize its fleet routes by monitoring real time traffic conditions and save fuel costs.
  • Inventory Monitoring– A smart label can be attached to every product/ container so that the movement of every product/ container can be tracked. This will help in reducing the probability of stock out situations due to insufficient stock, theft, pilferage etc. 
  • Storage Condition Control– Temperature stability can be ensured with connected devices and sensors.
  • Predictive Maintenance– IoT can help in knowing about product issues in time to find solutions.

ENERGY MANAGEMENT

Nowadays, every firm is trying to reduce its ecological footprint. IoT can be helpful in achieving this goal through smart energy. A bulb or tube light in the factory can switch on automatically as soon as a worker passes by and switch off once the worker has left. This will help in saving electricity costs.

TIME MANAGEMENT

IoT can be helpful in reducing the overall time taken in production of goods and services. For example- Setup time can be reduced by switching on the machines before the workers arrive at the factory, thanks to connected machines and smart phones. Inventory monitoring and tracking time can also be reduced through IoT. IoT can also be useful in managing the workflow in an event of accident at the factory. In case of an accident, an alarm can be rung in the factory, providing all the relevant details about the accident to the workers. The work can then by diverted through some other route, or some other worker can be employed as soon as possible in place of the injured worker. All this will save time.

Another use can be spending less time on searching for equipments at the workplace. Since equipments and devices are interconnected and geographically tagged, workers can find equipments more easily instead of searching them around. Also, if workers know a piece of equipment has location-tracking, it acts as a deterrent from potential theft (the National Retail Federation estimated that in 2011, employee theft cost companies a whopping $34.5 billion).

Thus, IoT offers great opportunities for the industries, which ensures better and faster production of goods and management of processes. 

To learn more about IoT, take up courses on Machine Learning Using Python. Check out DexLab Analytics for further details on SAS training courses.


Interested in a career in Data Analyst?

To learn more about Data Analyst with Advanced excel course – Enrol Now.
To learn more about Data Analyst with R Course – Enrol Now.
To learn more about Big Data Course – Enrol Now.

To learn more about Machine Learning Using Python and Spark – Enrol Now.
To learn more about Data Analyst with SAS Course – Enrol Now.
To learn more about Data Analyst with Apache Spark Course – Enrol Now.
To learn more about Data Analyst with Market Risk Analytics and Modelling Course – Enrol Now.

Role of Self Service Analytics in Businesses

Role of Self Service Analytics in Businesses

Self Service Analytics is proving useful for business users, who are working on business data without necessarily having a background in technology and statistics. It is essentially bridging the gap between trained data analysts and normal business users.

Following are the characteristics of Self Service Analytics:

  1. Business Users Independence:

Self Service Analytics reduces dependency on IT and Data warehousing teams, thereby reducing the turnaround time for a request made by a business user.

It does so by continuously collating and loading real time data into a singular stream without disparity, which is easily accessible through browsers. Thus, it helps business users in taking decisions on Real-Time basis.

This feature benefits organizations because vital decisions made within time can be more profitable as compared to the traditional way of analysing data, which may not be a good idea in respect to the urgency constraint.

2

  1. Easier and Reduced Cost of Operations:

Often, the company’s data are fragmented and widespread across various divisions. This increases the headache of channelling the data meaningfully and in a wholesome manner.

Further to this, preparing reports using this data becomes a cumbersome job for the IT department or the department, which is serving such request. Hence, it may lead to increased cost of time or decreased quality of efficiency at which the operations have to run. However, many a times, these reports fail to give an overview of the operations in an organisation.

Self-service BI integrates data from different systems and delivers a “Single Version of Truth”. Accessing this data and running computations on it requires only a browser for access and eliminates the need to install, maintain and administer large-footprint software clients on each user’s workstation.

If Self Service Analytics is hosted on SaaS, it will further reduce the cost of machinery and maintenance associated with it. The provision for usage can be increased or decreased in no time according to the usage pattern. This really means that Self Service Analytics helps you adapt with time and Pay-Per-Use model, which is a leading trend in most of the industries.

  1. Resolving the conflict over accuracy:

Typically, a business user using Excel would have a local copy of data and run computations on it. He can merge and transform it by using various formulas and finally derive a conclusion.

This is dangerous because in live operations, data keeps changing and data integrity is at stake by working on local copies. Thus, accuracy in decision-making becomes a game of luck.

In Self Service BI, the data from the source is extracted, transformed and loaded into a unique data model, which goes with all operations. In this case, data integrity is assured. In addition, all business users have the same source of data, removing the risk that working with different local copies have.

Therefore, from the above stated facts, we can conclude that Self Service Analytics is a need for today’s businesses.

However, there are a few risks involved in Self Service Business Analytics:

  1. Loose corporate governance and make data available to business users directly may be taken advantage of in an undue manner.
  2. Business users may not be properly trained or skilled to make decisions.
  3. Relying heavily on any tool without some real life experience and insight into the background of that data can result into an impaired decision-making.

If all the above-mentioned risks are mitigated and proper corporate governance structure is in place, Self Service Analytics can be very beneficial for the success of any organization.

To excel in Self-Service Analytics, why not take up Machine Learning courses in Delhi from DexLab Analytics! They are informative, interesting and elaborate.


Interested in a career in Data Analyst?

To learn more about Data Analyst with Advanced excel course – Enrol Now.
To learn more about Data Analyst with R Course – Enrol Now.
To learn more about Big Data Course – Enrol Now.

To learn more about Machine Learning Using Python and Spark – Enrol Now.
To learn more about Data Analyst with SAS Course – Enrol Now.
To learn more about Data Analyst with Apache Spark Course – Enrol Now.
To learn more about Data Analyst with Market Risk Analytics and Modelling Course – Enrol Now.

How Machine Learning Training Course and AI Made Lives Easier

How Machine Learning Training Course and AI Made Lives Easier

Technological superiority, the rise of the machines and an eventual apocalypse are often highlighted in sci-fi Hollywood movies. The unfavorable impacts of machine learning and excessive dependence on artificial intelligence have always been the hot topic for several Hollywood blockbusters, since years. And people who watch such movies develop a perception that more the technical advancement, higher is the chances that it will ignite a war against humans.

However, in reality, away from the world of Hollywood and motion pictures, Machine Learning and Artificial Intelligence is creating a sensation! If we look past the hype of Hollywood movies, we will understand that the Rise of Machines is certainly not the end of the world or the harbinger of apocalypse but a window of opportunity to achieve technical convenience.

How Things Got Simpler Using Machine Learning Training Course

Though individual are reaping benefits from AI, but it is the business world that is deriving most of its benefits. You will find AI everywhere- from gaming parlors to the humongous amount of data piled in workstation computers. Extensive research is being carried out in this field and scientists and tech gurus are spending huge amount of time in making this improved technology reach the masses. Also, Google and Facebook have placed their high hopes on AI and have also started implementing it in their products and services. Soon, we will see how easily Machine Learning and AI will stream from one product to another.

Data Science Machine Learning Certification

Who Are The Best Users of Machine Learning?

Machine learning cannot be implemented by every SaaS. Then who can be the active users of machine learning? As stated by a spokesperson of a reputable AI company, the implementation of Machine Learning is suitable for companies that have massive amounts of historical data stored. To train a puppy, you need a handful of treats, similarly to tackle an algorithm you need a vast amount of human corrected error-free data.

Secondly, to get the taste of success the companies, who are thinking of implementing AI, need a proper business case. You need a proper plan before you start operating. Always question yourself, whether your machine learning algorithm will be able to reduce your costs, while offering better value. If yes, then it is a green signal for you!

Take machine Learning course from experts who possess incredible math skills! The Machine Learning course in India is offered by DexLab Analytics. For more details, go through our Machine Learning Certification course brochure uploaded on the website. 


.

Can We Fight Discrimination With Better Machine Learning?

Can We Fight Discrimination With Better Machine Learning?

With the increase in use of machine learning, for taking important corporate as well as national operational decisions, it is important to set across some core social domains. They will work to make sure that these decisions are not biased with discrimination against certain categories whatever they may be applied into.

In this post, we will discuss the crucial matters of “threshold classifiers”, a part of some machine learning operations that is critical to the issues of discrimination. With a threshold classifier one can essentially make a yes/no decision, which in turn helps to put things in perspective with one category or the other. Here we will take a look at how these classifiers work, the ways in which they can potentially be biased and how one may be able to turn an unfair classifier into a much fairer one.

By opting for a course on Machine Learning Using Python, you will be able to grasp the subject matter of this topic better.

In order to provide an illustrative example, we will concentrate on loan granting scenarios where the bank may approve or deny a loan based on one single, number computed automatically like a Credit score.

"<center

In the above-mentioned diagram, the dark dots represent people who do pay off their loans and debts, while the lighter dots show those who would not. In an ideal scenario, we may get to work with statistics that cleanly distinguish the classes as in the left example. However, sadly this is far more common to see a situation wherein at the right where the group overlaps.

A standalone statistic can stand in for several different variables, and boiling them down to just one number. In case of the credit score, which is evaluated by looking at several numbers of factors, that include income, promptness in debt repayment and much more. The number might even correctly represent the likelihood that a person may pay off a debt or also default, or might not. This relationship is actually pretty blurred and it is rare to find a statistic that correlates perfectly with real-world outcomes.

And that is exactly where the idea of a “threshold classifier” comes in: the bank selects a particular cut-off or threshold, and the people who have their credit scores are mentioned below it, will be denied of loans and people above it are usually granted the lending. However, real banks have several more additional complexities, but this simple model is often useful for studying some of the fundamental issues. Also to be clear, Google does not use credit scores for their products!

"<center
Take our credit risk management courses in Delhi to know more about financial management with data driven insights.

The above-mentioned diagram makes use of synthetic data to show how a threshold classifier works. For further simplification of the explanation, we will be staying away from realistic credit scores  or the data what you see shows just the simulated data with a score based on the range of 0 to 100.

As can be well understood, selecting a threshold needs some tradeoffs. Too low and the bank wil l end up giving loans to many people who default; if too high many people who actually do deserve a loan will not get them.

So, how to determine the right threshold? That is subjective. One important goal may be to maximize the number of appropriate decisions. (Can you tell us what threshold will do that in this example scenario?)

Another financial situational goal may be to, maximize profit. At the bottom of the above mentioned diagram, is a readout hypothetical “profit” which is based on the model wherein a successful loan will make USD 300, but a default will cost a bank USD 700. So what will be the most profitable threshold? And does it match the threshold with the maximum correct decisions?

Discrimination and categorization:

The aspect of how to make a correct decision is defined, and with sensitivities to which factors will become particularly thorny, when a statistic like a credit score ends up distributed separately in between the two teams.

Let us imagine that we have two teams of people ‘orange’ and ‘blue’. We are keen on making small loans, subject to the following rules:

  • A successful loan will make USD 300
  • But an unsuccessful loan will make USD 700
  • Everyone will have a credit score of range 0 to 100

DexLab Analytics offers credit risk analysis course online for the ease of promoting financial credit risk knowledge and data analytics know-how to the right personnel conveniently.

How to simulate loan decisions for different groups:

Drag the black threshold bars either left or right to alter the cut-offs for loans. Click on the varying preset loan strategies:

In the above mentioned case, the distributions of the two groups are slightly varying. While the blue and the orange people are equivalently likely to pay off a debt. But if you take look for a pair of thresholds that maximize total profit (or click on max profit button), then you will be able to see that the blue group is held in a slightly higher standard than the orange one.

How to improve machine-learning systems:

An important outcome of the paper by Hardt, Price, and Srebro depicted that – when mentioned essentially in any scoring system, it will be possible to efficiently to find the thresholds that meet any of the above mentioned criteria. Put in other words, even if you do not posses control over   the underlying scoring system (which is quite a common case) it will still be possible to attack the issue of discrimination.


Interested in a career in Data Analyst?

To learn more about Data Analyst with Advanced excel course – Enrol Now.
To learn more about Data Analyst with R Course – Enrol Now.
To learn more about Big Data Course – Enrol Now.

To learn more about Machine Learning Using Python and Spark – Enrol Now.
To learn more about Data Analyst with SAS Course – Enrol Now.
To learn more about Data Analyst with Apache Spark Course – Enrol Now.
To learn more about Data Analyst with Market Risk Analytics and Modelling Course – Enrol Now.

Pandora: Blending Music with Machine Learning

Pandora: Blending Music with Machine Learning
 

Erik Schmidt, a Senior Scientist at Pandora is going to propose an insight of recommendations and deeper challenges involved with Pandora at the Machine Intelligence Summit. This global tech event will take place in San Francisco on 23rd and 24th of March 2017. Continue reading “Pandora: Blending Music with Machine Learning”

Facebook is planning to evaluate its quest for generalised AI

Facebook Artificial Intelligence Researchers

A major misconception about artificial intelligence is the fact that today’s robots possess a very generalized intelligence, however, we are fairly efficient in leveraging large datasets to accomplish otherwise complex tasks. Nevertheless we still fail and fall flat at the prospect of replicating the breadth of human intelligence.

Care to contribute to AI development in today’s world? Then take up a Machine Learning course online with us. But in order to move forward a generalized intelligence, Facebook is ensure that we know how to evaluate the process. In a recently released paper, Facebook’s AI research (FAIR) lab has outlined just that as a part of its CommAI framework.

2

We will need our systems to be able to communicate and will be able to learn through language effectively even when they lack in context and discussing thing in undefined terms.

Furthermore, such systems should be capable of learning up new skills, fairly simply. As per Facebook this skill set is called “learning to learn”. Present machine learning models may be trained on data and be used for classifying defined objects. We can also make use of transfer learning to quickly adapt a model to achieve the same task on the new data, however our machines cannot completely teach themselves without heavy to moderate intervention from the developers.

It is in general agreed upon, that in order to generalize across several tasks, a program should be capable of compositional training. And that is of storing and recombination solutions to sub-problems across the different tasks, as per the team from Facebook.

As per Facebook they consider these capabilities to be of more of a prerequisite to being a generalized AI than the true Turing test. Alan Turing created the original Turing test in the 1950s. It is usually understood to be a means of assessing machine learning intelligence with respect to human intelligence.

However, with the maturation of the field of Ai the Turing test has lost a lot of its relevance. Facebook hopes to offer a nice alternative way to think about the necessary requirements of a modern generalized AI which should be less of a research distraction than the more rigid Turing Test.

The team at FAIR which include – Marco Baroni, Armand Joulin, Allan Jabri, Germán Kruszewski, Angeliki Lazaridou, Klemen Simonic and Tomas Mikolov have also developed another open source platform for the testing and training of AI systems.

For more information on Machine Learning training in Gurgaon or in Delhi NCR, drop by our institute at DexLab Analytics.


Interested in a career in Data Analyst?

To learn more about Data Analyst with Advanced excel course – Enrol Now.
To learn more about Data Analyst with R Course – Enrol Now.
To learn more about Big Data Course – Enrol Now.

To learn more about Machine Learning Using Python and Spark – Enrol Now.
To learn more about Data Analyst with SAS Course – Enrol Now.
To learn more about Data Analyst with Apache Spark Course – Enrol Now.
To learn more about Data Analyst with Market Risk Analytics and Modelling Course – Enrol Now.

How to Parse Data with Python

How to Parse Data with Python

Before we begin with our Python tutorial on how to parse data with Python, we would like you to download this machine learning data file, and then get set to learn how to parse data.

The data set we have provided in the above link, mimics exactly the way the data was when we visited the web pages at that point of time, but the interesting thing about this is we need not visit the page even. We actually have the full HTML source code, so it is just like parsing the website without the annoying bandwidth use.

Now, the first thing to do when we start is to correspond the date to our data, and then we will pull the actual data.

Here is how we start:

import pandas as pd
import os
import time
from datetime import datetime

path = "X:/Backups/intraQuarter"

Looking for a Machine Learning course online? We have Big Data courses that will bring big dreams to reality.

As given above, we are importing the Pandas for the Pandas module, OS, that is so we can interact with the directories, date and time for managing the date and time information.

Furthermore, we will finally define the path, which is the path to the intraQuarter folder than one will need to unzip the original zip file, which you just downloaded from the website.

def Key_Stats(gather="Total Debt/Equity (mrq)"):
    statspath = path+'/_KeyStats'
    stock_list = [x[0] for x in os.walk(statspath)]
    #print(stock_list)

We began our functions, with the specification that we are going to try to collect all the Debt/equity values.

The path to the stats directory is Statspath.

To list all the contents in the directory, you can use stock_list which is a fast one-liner for the loop that uses os.walk.

Take up our Machine Learning training course with Python to know more about this in-demand skill!

Then the next step is to do this:

    for each_dir in stock_list[1:]:
        each_file = os.listdir(each_dir)
        if len(each_file) > 0:

Mentioned above is a cycling through of directory (which is every stock ticker). Then the next step is to list “each_file”, which is each file within that very stock’s directory. If in case the length of each_file which is in fact is a list of all of the files in the stock’s directory, is greater than 0 only then will we want to proceed. However, there are some stocks with no files or data:

            for file in each_file:

                date_stamp = datetime.strptime(file, '%Y%m%d%H%M%S.html')
                unix_time = time.mktime(date_stamp.timetuple())
                print(date_stamp, unix_time)
                #time.sleep(15)

Key_Stats()

Finally, at the end, we must run a loop that pulls the date_stamp, from each file. All our files are actually stored under their ticket, with a file name for the exact date and time from which the information is being taken out.

It is from there that we will explain to date-time what the format for our date stamp is, and then we will convert it to a Unix time stamp.

To know more about data parsing or anything else in python, learn Machine Learning Using Python with the experts at DexLab Analytics.


This post originally appeared onpythonprogramming.net/parsing-data-website-machine-learning


.

Call us to know more