hadoop training in gurgaon Archives - Page 2 of 3 - DexLab Analytics | Big Data Hadoop SAS R Analytics Predictive Modeling & Excel VBA

The Power of Data: How the Industry Has Changed After Adding Data

The volume of data is expanding at an enormous rate, each day. No more are 1s and 0s are petty numerical digits, they are now a whole new phenomenon – known as Big Data. A fair assessment of the term helped us understand the massive volume of corporate data collected from a broad spectrum of sources is what big data is all about.

A recent report suggested that organizations are expected to enhance their annual revenues by an average of $5.2 million – thanks to big data.

More about Data, Rather Big Data

Back in the day, most of the company information used to be stored in written formats, like on paper. For example, if 80% of confidential information was kept on paper, 20% was stored electronically. Now, out of that 20%, 80% was kept in databases.

With time, things have changed. Across the business domain, more than 80% of companies store their data in electronic formats nowadays, and at least 80% of that is found outside databases, because most organizations prefer storing data in ad hoc basis in files at random places.

2

Now, the question is what kind of data is of crucial importance? Data, that impacts the most?

With that in mind, we’ve three kinds of data:

  • Customer Data
  • IT Data
  • Internal Financial Data

The Value of Data

For companies, data means dollars – the way data costs companies’ their time and resources, it also leads to increased revenue generation. However, the key factor to be noted here is – the data have to be RELEVANT. Despite potential higher revenues through advanced data skills and technology implementation, an average enterprise is only able to employ 51% of total accumulated and generated data, and less than 48% of decisions are based on that.

To say the least, unlike before, today’s organizations gather data from a wide array of sources – CCTV footage, video-audio files, social networking data, health metrics, blogs, web traffic logs and sensor feeds – previously companies were not as efficient and tech-savvy as they are now. In fact, five years ago, some of the sources from which data is accumulated did not even exist nor were they available on corporate radar.

With the rise of ingenious and connected technologies, companies are turning digital. It hardly matters if you are an automobile manufacturer, fashion collaborator or into digital marketing – being connected digitally and owning meaningful data is all to cash on. You can structure intricate database just with consumers’ details, both personal and professional, such as age, gender, interests, buying patterns, behavioral statistics and habits. Remember, accumulating and analyzing data is not only productive for your company but also becomes a saleable service in its own way.

Make Data the Bedrock of Your Business

Data has to be the life and blood of business plans and decisions you want to make. Ensure your employees learn about the value of data collection, make sure you align your IT resources properly and keep pace with the latest data tools and technologies as they tend to keep on changing, constantly.

Embrace the change – while physical assets are losing importance, data appears to be the most valuable asset a company can ever have.

For big data hadoop certification in gurgaon, look no further than DexLab Analytics. With the right skills in tow and adequate years of experience, this analytics training institute is the toast of the town. For more information, visit our official page. 


The blog has been sourced from:

https://www.digitaldoughnut.com/articles/2016/april/data-may-be-the-most-valuable-asset-your-company-h

https://www.techrepublic.com/blog/cio-insights/big-data-cheat-sheet/

https://www.techrepublic.com/article/the-3-most-important-types-of-data-for-your-business


Interested in a career in Data Analyst?

To learn more about Data Analyst with Advanced excel course – Enrol Now.
To learn more about Data Analyst with R Course – Enrol Now.
To learn more about Big Data Course – Enrol Now.

To learn more about Machine Learning Using Python and Spark – Enrol Now.
To learn more about Data Analyst with SAS Course – Enrol Now.
To learn more about Data Analyst with Apache Spark Course – Enrol Now.
To learn more about Data Analyst with Market Risk Analytics and Modelling Course – Enrol Now.

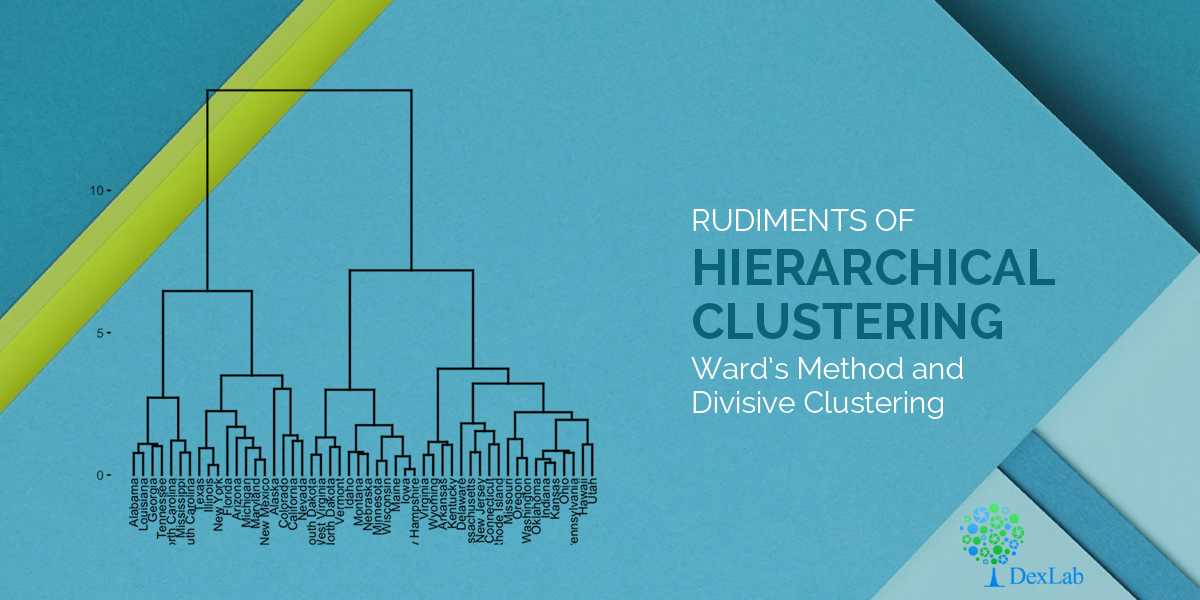
Rudiments of Hierarchical Clustering: Ward’s Method and Divisive Clustering

Rudiments of Hierarchical Clustering: Ward’s Method and Divisive Clustering

Clustering, a process used for organizing objects into groups called clusters, has wide ranging applications in day to day life, including fields like marketing, city-planning and scientific research.

Hierarchical clustering, one the most common methods of clustering, builds a hierarchy of clusters either by a ‘’bottom up’’ approach (Agglomerative clustering) or by a ‘’top down’’ approach (Divisive clustering). In the previous blogs, we have discussed the various distance measures and how to perform Agglomerative clustering using linkage types. Today, we will explain the Ward’s method and then move on to Divisive clustering.

Ward’s method:

This is a special type of agglomerative hierarchical clustering technique that was introduced by Ward in 1963. Unlike linkage method, Ward’s method doesn’t define distance between clusters and is used to generate clusters that have minimum within-cluster variance. Instead of using distance metrics it approaches clustering as an analysis of variance problem. The method is based on the error sum of squares (ESS) defined for jth cluster as the sum of the squared Euclidean distances from points to the cluster mean.

Where Xij is the ith observation in the jth cluster. The error sum of squares for all clusters is the sum of the ESSj values from all clusters, that is,

Where k is the number of clusters.

The algorithm starts with each observation forming its own one-element cluster for a total of n clusters, where n is the number of observations. The mean of each of these on-element clusters is equal to that one observation. In the first stage of the algorithm, two elements are merged into one cluster in a way that ESS (error sum of squares) increases by the smallest amount possible. One way of achieving this is merging the two nearest observations in the dataset.

Up to this point, the Ward algorithm gives the same result as any of the three linkage methods discussed in the previous blog. However, as each stage progresses we see that the merging results in the smallest increase in ESS.

This minimizes the distance between the observations and the centers of the clusters. The process is carried on until all the observations are in a single cluster.

2

Divisive clustering:

Divisive clustering is a ‘’top down’’ approach in hierarchical clustering where all observations start in one cluster and splits are performed recursively as one moves down the hierarchy. Let’s consider an example to understand the procedure.

Consider the distance matrix given below. First of all, the Minimum Spanning Tree (MST) needs to be calculated for this matrix.

The MST Graph obtained is shown below.

The subsequent steps for performing divisive clustering are given below:

Cut edges from MST graph from largest to smallest repeatedly.

Step 1: All the items are in one cluster- {A, B, C, D, E}

Step 2: Largest edge is between D and E, so we cut it in 2 clusters- {E}, {A., B, C, D}

Step 3: Next, we remove the edge between B and C, which results in- {E}, {A, B} {C, D}

Step 4: Finally, we remove the edges between A and B (and between C and D), which results in- {E}, {A}, {B}, {C} and {D}

Hierarchical clustering is easy to implement and outputs a hierarchy, which is structured and informative. One can easily figure out the number of clusters by looking at the dendogram.

However, there are some disadvantages of hierarchical clustering. For example, it is not possible to undo the previous step or move around the observations once they have been assigned to a cluster. It is a time-consuming process, hence not suitable for large datasets. Moreover, this method of clustering is very sensitive to outlietrs and the ordering of data effects the final results.

In the following blog, we shall explain how to implement hierarchical clustering in R programming with examples. So, stay tuned and follow DexLab Analytics – a premium Big Data Hadoop training institute in Gurgaon. To aid your big data dreams, we are offering flat 10% discount on our big data Hadoop courses. Enroll now!


Check back for our previous blogs on clustering:

Hierarchical Clustering: Foundational Concepts and Example of Agglomerative Clustering

A Comprehensive Guide on Clustering and Its Different Methods
 

Interested in a career in Data Analyst?

To learn more about Data Analyst with Advanced excel course – Enrol Now.
To learn more about Data Analyst with R Course – Enrol Now.
To learn more about Big Data Course – Enrol Now.

To learn more about Machine Learning Using Python and Spark – Enrol Now.
To learn more about Data Analyst with SAS Course – Enrol Now.
To learn more about Data Analyst with Apache Spark Course – Enrol Now.
To learn more about Data Analyst with Market Risk Analytics and Modelling Course – Enrol Now.

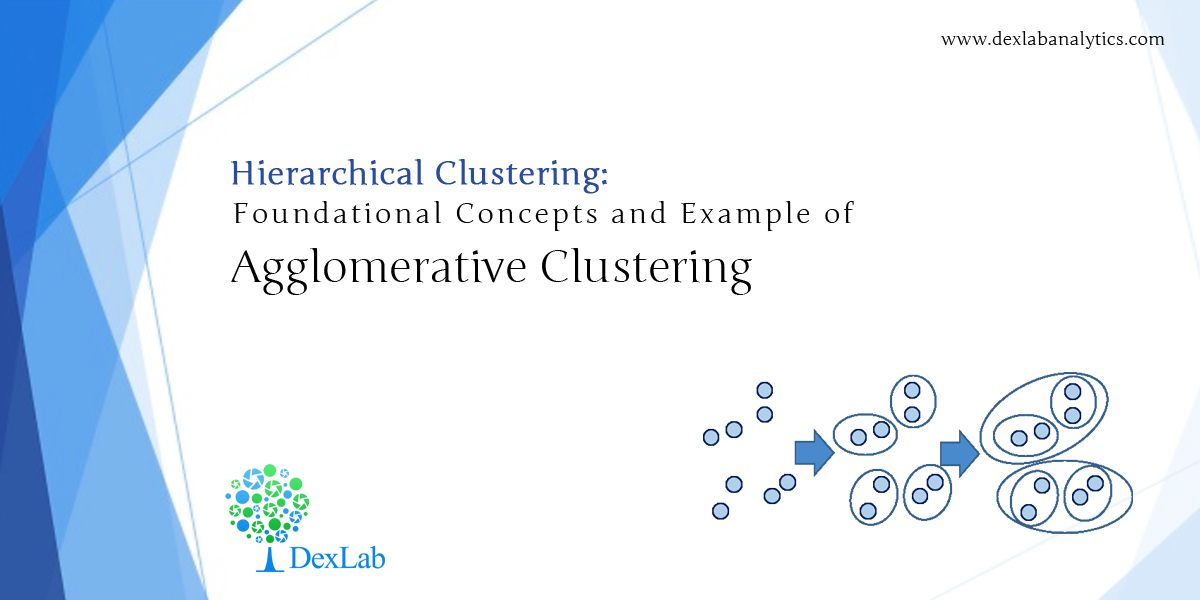
Hierarchical Clustering: Foundational Concepts and Example of Agglomerative Clustering

Hierarchical Clustering: Foundational Concepts and Example of Agglomerative Clustering

Clustering is the process of organizing objects into groups called clusters. The members of a cluster are ‘’similar’’ between them and ‘’dissimilar’’ to members of other groups.

In the previous blog, we have discussed basic concepts of clustering and given an overview of the various methods of clustering. In this blog, we will take up Hierarchical Clustering in greater details.

Hierarchical Clustering:

Hierarchical Clustering is a method of cluster analysis that develops a hierarchy (ladder) of clusters. The two main techniques used for hierarchical clustering are Agglomerative and Divisive.

Agglomerative Clustering:

In the beginning of the analysis, each data point is treated as a singleton cluster. Then, clusters are combined until all points have been merged into a single remaining cluster. This method of clustering wherein a ‘’bottom up’’ approach is followed and clusters are merged as one moves up the hierarchy is called Agglomerative clustering.

Linkage types:

The clustering is done with the help of linkage types. A particular linkage type is used to get the distance between points and then assign it to various clusters. There are three linkage types used in Hierarchical clustering- single linkage, complete linkage and average linkage.

Single linkage hierarchical clustering: In this linkage type, two clusters whose two closest members have the shortest distance (or two clusters with the smallest minimum pairwise distance) are merged in each step.

Complete linkage hierarchical clustering: In this type, two clusters whose merger has the smallest diameter (two clusters having the smallest maximum pairwise distance) are merged in each step.

Average linkage hierarchical clustering: In this type, two clusters whose merger has the smallest average distance between data points (or two clusters with the smallest average pairwise distance), are merged in each step.

Single linkage looks at the minimum distance between points, complete linkage looks at the maximum distance between points while average linkage looks at the average distance between points.

Now, let’s look at an example of Agglomerative clustering.

The first step in clustering is computing the distance between every pair of data points that we want to cluster. So, we form a distance matrix. It should be noted that a distance matrix is symmetrical (distance between x and y is the same as the distance between y and x) and has zeros in its diagonal (every point is at a distance zero from itself). The table below shows a distance matrix- only lower triangle is shown an as the upper one can be filled with reflection.

Next, we begin clustering. The smallest distance is between 3 and 5 and they get merged first into the cluster ‘35’.

After this, we replace the entries 3 and 5 by ‘35’ and form a new distance matrix. Here, we are employing complete linkage clustering. The distance between ‘35’ and a data point is the maximum of the distance between the specific data point and 3 or the specific data point and 5. This is followed for every data point. For example, D(1,3)=3 and D(1,5) =11, so as per complete linkage clustering rules we take D(1,’35’)=11. The new distance matrix is shown below.

Again, the items with the smallest distance get clustered. This will be 2 and 4. Following this process for 6 steps, everything gets clustered. This has been summarized in the diagram below. In this plot, y axis represents the distance between data points at the time of clustering and this is known as cluster height.

Complete Linkage

If single linkage clustering was used for the same distance matrix, then we would get a single linkage dendogram as shown below. Here, we start with cluster ‘35’. But the distance between ‘35’ and each data point is the minimum of D(x,3) and D(x,5). Therefore, D(1,’35’)=3.

Single Linkage

Agglomerative hierarchical clustering finds many applications in marketing. It is used to group customers together on the basis of product preference and liking. It effectively determines variations in consumer preferences and helps improving marketing strategies.

In the next blog, we will explain Divisive clustering and other important methods of clustering, like Ward’s Method. So, stay tuned and follow Dexlab Analytics. We are a leading big data Hadoop training institute in Gurgaon. Enroll for our expert-guided certification courses on big data Hadoop and avail flat 10% discount!

DexLab Analytics Presents #BigDataIngestion

DexLab Analytics Presents #BigDataIngestion


Check back for the blog A Comprehensive Guide on Clustering and Its Different Methods


Interested in a career in Data Analyst?

To learn more about Data Analyst with Advanced excel course – Enrol Now.
To learn more about Data Analyst with R Course – Enrol Now.
To learn more about Big Data Course – Enrol Now.

To learn more about Machine Learning Using Python and Spark – Enrol Now.
To learn more about Data Analyst with SAS Course – Enrol Now.
To learn more about Data Analyst with Apache Spark Course – Enrol Now.
To learn more about Data Analyst with Market Risk Analytics and Modelling Course – Enrol Now.

Predicting World Cup Winner 2018 with Big Data

Predicting World Cup Winner 2018 with Big Data

Is there any way to predict who will win World Cup 2018?

Could big data be used to decipher the internal mechanisms of this beautiful game?

How to collect meaningful insights about a team before supporting one?

Data Points

Opta Sports and STATS help predict which teams will perform better. These are the two sports companies that have answers to all the above questions. Their objective is to collect data and interpret it for their clients, mainly sports teams, federations and of course media, always hungry for data insights.

How do they do it? Opta’s marketing manager Peter Deeley shares that for each football match, his company representatives collects as many as 2000 individual data points, mostly focused on ‘on-ball’ actions. Generally, a team of three analysts operates from the company’s data hub in Leeds; they record everything happening on the pitch and analyze the positions on the field where each interaction takes place. The clients receive live data; that’s the reason why Gary Lineker, former England player is able to share information like possession and shots on goal during half time.

The same procedure is followed at Stats.com; Paul Power, a data scientist from Stats.com explains how they don’t rely only on humans for data collection, but on latest computer vision technologies. Though computer vision can be used to log different sorts of data, yet it can never replace human beings altogether. “People are still best because of nuances that computers are not going to be able to understand,” adds Paul.

Who is going to win?

In this section, we’re going to hit the most important question of this season – which team is going to win this time? As far as STATS is concerned, it’s not too eager to publish its predictions this year. The reason being they believe is a very valuable piece of information and by spilling the beans they don’t want to upset their clients.

On the other hand, we do have a prediction from Opta. According to them, veteran World Cup champion Brazil holds the highest chance of taking home the trophy – giving them a 14.2% winning chance. What’s more, Opta also has a soft corner for Germany – thus giving them an 11.4% chance of bringing back the cup once again.

If it’s about prediction and accuracy, we can’t help but mention EA Sports. For the last 3 World Cups, it maintained a track record of predicting the eventual World Cup winner impeccably. Using the encompassing data about the players and team rankings in FIFA 2018, the company representatives ran a simulation of the tournament, in which France came out to be the winner, defeating Germany in the final. As it has already predicted right about Germany and Spain in 2014 and 2010 World Cups, consecutively, this new revelation is a good catch.

So, can big data predict the World Cup winner? We guess yes, somehow.

DexLab Analytics Presents #BigDataIngestion

If you are interested in big data hadoop certification in Noida, we have some good news coming your way! DexLab Analytics has started a new admission drive for prospective students interested in big data and data science certification. Enroll in #BigDataIngestion and enjoy 10% off on in-demand courses, including data science, machine learning, hadoop and business analytics.


The blog has been sourced from – https://www.techradar.com/news/world-cup-2018-predictions-with-big-data-who-is-going-to-win-what-and-when


Interested in a career in Data Analyst?

To learn more about Data Analyst with Advanced excel course – Enrol Now.
To learn more about Data Analyst with R Course – Enrol Now.
To learn more about Big Data Course – Enrol Now.

To learn more about Machine Learning Using Python and Spark – Enrol Now.
To learn more about Data Analyst with SAS Course – Enrol Now.
To learn more about Data Analyst with Apache Spark Course – Enrol Now.
To learn more about Data Analyst with Market Risk Analytics and Modelling Course – Enrol Now.
Fintech Companies: How They Are Revolutionizing the Banking Industry?

Fintech Companies: How They Are Revolutionizing the Banking Industry?

The world of technology is expanding rapidly. And so is the finance. Fintech is the new buzzword; and its extensive use of cutting edge algorithms, big data solutions and AI is transforming the traditional banking sector.

Nevertheless, there exist many obstacles, which fintech companies need to deal with before creating an entirely complementary system that covers the gap between both.

Ezbob and LaaS

Innovation takes time to settle, but with little effort, banks can strike gold than ever. New transparency laws and digital standards are being introduced and if banks are quicker in embracing this new technology, they can ring off success very easily. Not every fintech is determined to cause discomfort to banks, in fact a lot of fintech startups offer incredible services to attract new customers.

One of them is ezbob, a robust platform in partnership with multiple major banking institutions that streamlines an old process with cutting edge technology. This platform develops a smooth, automatic lending process for bank’s customers by sorting data accumulated from more than 25 sources in real time. Currently, it’s leading Lending-as-a-Service (LaaS) industry, which is deemed to be the future of banking sector.

LaaS is one of the key transforming agents that have brought in a new trend in the banking sector. It reflects how everyone can benefit, including customers and partners, when efficiency is improved. Real time decisions are crucial; it helps bankers turn attention to the bigger picture, while technology takes care of other factors.

2

The Art of Regulations

Conversely, fintech startups should be wary of regulations. Notwithstanding the fact that technology is fast decentralizing the whole framework and disrupting institutional banking sector, fintech companies should focus on regulation and be patient with all the innovations taking place around. Banks need time to accept the potentials of fintech’s innovation but once they do, they would gain much more from adopting these technologies.

The aftermath of 2008 financial crisis have made it relatively easier for fintech startups to remain compliant and be more accountable. One of the latest regulations passed is about e-invoicing, which require organizations should send digital invoices through a common system. This measure is expected to save billions of dollars on account of businesses and governments, as well.

Some of the other reforms that have been passed recently are mainly PSD2, which has systematized mobile and internet payments, and AMLD, which is an abbreviation of Anti Money Laundering Directive. The later hurts those who don’t want to be accountable for their income, or involved in terrorism activities.

Conclusion

As closing thoughts, we all can see the financial sector has been the largest consumers of big data technology. According to Gartner, 64% of financial service companies have used big data in 2013. And the figures are still rising.

To be the unicorn among the horses, it’s high time to imbibe big data hadoop skills. This new-age skill is going to take you a long way, provided you get certified from a reputable institute. In Delhi-Gurgaon region, we’ve DexLab Analytics. It offers state-of-the-art hadoop training in Gurgaon. For more information, drop by their site now.

DexLab Analytics Presents #BigDataIngestion

A Special Alert: DexLab Analytics is offering #SummerSpecial 10% off on in-demand courses of big data hadoop, data science, machine learning and business analytics. Enroll now for #BigDataIngstion: the new on-going admission drive!

 
The blog has been sourced from – http://dataconomy.com/2017/10/rise-fintechpreneur-matters
 

Interested in a career in Data Analyst?

To learn more about Data Analyst with Advanced excel course – Enrol Now.
To learn more about Data Analyst with R Course – Enrol Now.
To learn more about Big Data Course – Enrol Now.

To learn more about Machine Learning Using Python and Spark – Enrol Now.
To learn more about Data Analyst with SAS Course – Enrol Now.
To learn more about Data Analyst with Apache Spark Course – Enrol Now.
To learn more about Data Analyst with Market Risk Analytics and Modelling Course – Enrol Now.

How Big Data Is Influencing HR Analytics for Employees and Employers, Both

How Big Data Is Influencing HR Analytics for Employees and Employers, Both

HR analytics powered by big data is aiding talent management and hiring decisions. A Deloitte 2015 report says 35% of companies surveyed revealed that they were actively developing suave data analytics strategies for HR. Moreover, big data analytics isn’t leaving us anytime soon; it’s here to stay for good.

Now, with that coming, employers are of course in an inapt position: whether to use HR analytics or not? And even if they do use the data, how are they going to do that without violating any HR policies/laws or upsetting the employees?

2

Health Data

While most of the employers are concerned about healthcare and wellness programs for their employees, a whole lot of other employees have started employing HR analytics for evaluation of the program’s effectiveness and addressing the gaps in healthcare coverage with an aim to improve overall program performance.

Today, data is the lifeblood of IT services. Adequate pools of employee data in conjunction with company data are aiding discoveries of the best benefit package for employees where they get best but affordable care. However, in the process, the employers need to be very careful and sensitive to employee privacy at the same time. During data analysis, the process should appear as if the entire organization is involved in it, instead of focusing on a single employee or sub-groups.

Predictive Performance Analytics

For talent management, HR analytics is a saving grace. Especially, owing to its predictive performance. Because of that, more and more employers are deploying this powerful skill to determine future hiring needs and structure a strong powerhouse of talent.

Rightfully so, predictive performance analytics use internal employee data to calculate potential employee turnover, but unfortunately, in some absurd cases, the same data can also be used to influence decisions regarding firing and promotion – and that becomes a problem.

Cutting edge machine learning algorithms dictate whether an event is going to happen or not, instead of what employees are doing or saying. Though it comes with its own advantages, its better when people frame decisions based on data. Because, people are unpredictable and so are the influencing factors.

Burn away irrelevant information

Sometimes, it may happen that employers instead of focusing on the meaningful things end up scrutinizing all the wrong things. For example, HR analytics show that employees living close to the office, geographically, are less likely to leave the office premise early. But, based on this, can we pass off top talent just because they reside a little farther from the office? We can’t, right?!

Hence, the bottom line is, whenever it comes to analyzing data, analysts should always look for the bigger picture rather giving stress on minute features – such as which employee is taking more number of leaves, and so on. Stay ahead of the curve by making the most productive decisions for employees as well as business, as a whole.

In the end, the power of data matters. HR analytics help guide the best decisions, but it’s us who are going to make them. We shouldn’t forget that. Use big data analytics responsibly to prevent any kind of mistrust or legal issues from the side of employees, and deploy them in coordination with employee feedback to come at the best conclusions ever. 

Those who are inclined towards big data hadoop certification, we’ve some droolworthy news for you! DexLab Analytics, a prominent data science learning platform has launched a new admission drive: #BigDataIngestion on in-demand skills: data science and big data with exclusive 10% discounts for all students. This summer, unfurl your career’s wings of success with DexLab Analytics!


Get the details here : www.dexlabanalytics.com/events/dexlab-analytics-presents-bigdataingestion


Reference:

The article has been sourced from https://www.entrepreneur.com/article/271753


Interested in a career in Data Analyst?

To learn more about Data Analyst with Advanced excel course – Enrol Now.
To learn more about Data Analyst with R Course – Enrol Now.
To learn more about Big Data Course – Enrol Now.

To learn more about Machine Learning Using Python and Spark – Enrol Now.
To learn more about Data Analyst with SAS Course – Enrol Now.
To learn more about Data Analyst with Apache Spark Course – Enrol Now.
To learn more about Data Analyst with Market Risk Analytics and Modelling Course – Enrol Now.

Enjoy 10% Discount, As DexLab Analytics Launches #BigDataIngestion

Enjoy 10% Discount, As DexLab Analytics Launches #BigDataIngestion

This summer, DexLab Analytics, a pioneering analytics training institute in Delhi is back in action with a whole new admission drive for prospective students: #BigDataIngestion with exclusive discount deals on offer. With an aim to promote an intensive data culture, we have launched Summer Industrial Training on Big Data Hadoop/Data Science. An exclusive 10% discount is on offer for all interested candidates. And, the main focus of the admission drive is on Hadoop, Data Science, Machine Learning and Business Analytics certification.

Data analytics is deemed to be the sexiest job of the 21st century; it’s comes as no surprise that young aspirants are more than eager to grasp the in-demand skills. Especially for them and others, DexLab Analytics emerges as a saving grace. Our state of the art certification training is completely in sync with the vision of providing top-of-the-line quality analytics coaching through fine approaches and student-friendly curriculum.

2

That being said, #BigDataIngestion is one of its kinds; while Hadoop and Data Science modules are targeted towards B. Tech and B.E students, Data Science and Business Analytics modules are exclusively oriented for Eco, Statistics and Mathematics students. The comprehensive certification courses help students embark on a wishful journey across various big data domains and architectures, triggering high-end IT jobs, but to avail the high-flying discount offer, the students need to present a valid ID card, while enrolling for the courses.

We are glad to announce that already the institute has gathered a good reputation through its cutting edge, open-to-all demo sessions. The demo sessions has helped countless prospective students in understanding the quality of courses and the way they are being imparted. Now, the new offer announced by the team is like an icing on the cake – 10% discount on in-demand big data courses sounds too alluring! And the admission procedure is also as easy as pie; you can either drop by the institute in person, or else can opt for online registration.

In this context, the spokesperson of DexLab Analytics stated, “We are glad to play an active role in the process of development and condoning of data analytics skills amongst the data-friendly students’ community of the country. We go beyond traditional classroom training and provide hands-on industrial training that will enable you to approach your career with confidence”. He further added, “We’ve always been more than overwhelmed to contribute towards the betterment of skilled human resources of the nation, and #BigDataIngestion is no different. It’s a summer industrial training program to equip students with formidable data skills for a brighter future ahead.”

For more information or to register online, click here: DexLab Analytics Presents #BigDataIngestion

#BigDataIngestion: DexLab Analytics Offers Exclusive 10% Discount for Students This Summer

Interested in a career in Data Analyst?

To learn more about Data Analyst with Advanced excel course – Enrol Now.
To learn more about Data Analyst with R Course – Enrol Now.
To learn more about Big Data Course – Enrol Now.

To learn more about Machine Learning Using Python and Spark – Enrol Now.
To learn more about Data Analyst with SAS Course – Enrol Now.
To learn more about Data Analyst with Apache Spark Course – Enrol Now.
To learn more about Data Analyst with Market Risk Analytics and Modelling Course – Enrol Now.

How Big Data Plays the Key Role in Promoting Cyber Security

The number of data breaches and cyber attacks is increasing by the hour. Understandably, investing in cyber security has become the business priority for most organizations. Reports based on a global survey of 641 IT and cyber security professionals reveal that a whopping 69% of organizations have resolved to increase spending on cyber security. The large and varied data sets, i.e., the BIG DATA, generated by all organizations small or big, are boosting cyber security in significant ways.

How Big Data Plays the Key Role in Promoting Cyber Security

Business data one of the most valuable assets of a company and entrepreneurs are becoming increasingly aware of the importance of this data in their success in the current market economy. In fact, big data plays the central role in employee activity monitoring and intrusion detection, and thereby combats a plethora of cyber threats.

Let’s Take Your Data Dreams to the Next Level

  1. EMPLOYEE ACTIVITY MONITERING:

Using an employee system monitoring program that relies on big data analytics can help a company’s human resource division keep a track on the behavioral patterns of their employees and thereby prevent potential employee-related breaches. Following steps may be taken to ensure the same:

  • Restricting the access of information only to the staff that is authorized to access it.
  • Staffers should use theirlogins and other system applications to change data and view files that they are permitted to access. 
  • Every employee should be given different login details depending on the complexity of their business responsibilities.


  1. INTRUSION DETECTION:

A crucial measure in the big data security system would be the incorporation of IDS – Intrusion Detection System that helps in monitoring traffic in the divisions that are prone to malicious activities. IDS should be employed for all the pursuits that are mission-crucial, especially the ones that make active use of the internet. Big data analytics plays a pivotal role in making informed decisions about setting up an IDS system as it provides all the relevant information required for monitoring a company’s network.

The National Institute of Standards and Technology recommends continuous monitoring and real-time assessments through Big Data analytics. Also the application of predictive analytics in the domain of optimization and automation of the existing SIEM systems is highly recommended for identifying threat locations and leaked data identity.

  1. FUTURE OF CYBER SECURITY:

Security experts realize the necessity of bigger and better tools to combat cyber crimes. Building defenses that can withstand the increasingly sophisticated nature of cyber attacks is the need of the hour. Hence advances in big data analytics are more important than ever.

Relevance of Hadoop in big data analytics:

  • Hadoop provides a cost effective storage solution to businesses.
  • It facilitates businesses to easily access new data sources and draw valuable insights from different types of data.
  • It is a highly scalable storage platform.
  • The unique storage technique of Hadoop is based on a distributed file system that primarily maps the data when placed on a cluster. The tools for processing data are often on the same servers where the data is located. As a result data processing is much faster.
  • Hadoop is widely used across industries, including finance, media and entertainment, government, healthcare, information services, and retail.
  • Hadoop is fault-tolerant. Once information is sent to an individual node, that data is replicated in other nodes in the cluster. Hence in the event of a failure, there is another copy available for use.
  • Hadoop is more than just a faster and cheaper analytics tool. It is designed as a scale-out architecture that can affordably store all the data for later use by the company.


Developing economies are encouraging investment in big data analytics tools, infrastructure, and education to maintain growth and inspire innovation in areas such as mobile/cloud security, threat intelligence, and security analytics.

Thus big data analytics is definitely the way forward. If you dream of building a career in this much coveted field then be sure to invest in developing the relevant skill set. The Big Data training and Hadoop training imparted by skilled professionals at Dexlab Analytics in Gurgaon, Delhi is sure to give you the technical edge that you seek. So hurry and get yourself enrolled today!


Interested in a career in Data Analyst?

To learn more about Machine Learning Using Python and Spark – click here.

To learn more about Data Analyst with Advanced excel course – click here.
To learn more about Data Analyst with SAS Course – click here.
To learn more about Data Analyst with R Course – click here.
To learn more about Big Data Course – click here.

10 Frequently-asked Hadoop Interview Questions with Answers

10 Frequently-asked Hadoop Interview Questions with Answers

A substantial part of the Apache project, Hadoop is an open source, Java-based programming software framework that is used for storing data and running applications on different clusters of commodity hardware. Be it any kind of data, Hadoop acts as a massive storage unit backed by gargantuan processing power and an ability to tackle virtually countless tasks and jobs, simultaneously.

In this blogpost, we are going to discuss top 10 Hadoop interview questions – cracking these questions may help you bag the sexiest job of this decade.

What are the components of Hadoop?

There are 3 layers in Hadoop and they are as follows:

  • Storage layer (HDFS) – Also known as Hadoop Distributed File System, HDFS is responsible for storing various forms of data as blocks of information. It includes NameNode and DataNode.
  • Batch processing engine (MapReduce) For parallel processing of large data sets across a standard Hadoop cluster, MapReduce is the key.
  • Resource management layer (YARN) Yet Another Resource Negotiator is the powerful processing framework in Hadoop system that keeps a check on the resources.

Why is Hadoop streaming?

Hadoop distribution includes a generic application programming interface for drawing MapReduce jobs in programming languages like Ruby, Python, Perl, etc. and this is known as Hadoop streaming.

2

What are the different modes to run Hadoop?

  • Local (standalone) Mode
  • Pseudo-Distributed Mode
  • Fully-Distributed Mode

How to restart Namenode?

Begin by clicking on stop-all.sh and then on start-all.sh

OR

Write sudo hdfs (then press enter), su-hdfs (then press enter), /etc/init.d/ha (then press enter) and finally /etc/init.d/Hadoop-0.20-name node start (then press enter).

How can you copy files between HDFS clusters?

Use multiple nodes and the distcp command to ensure smooth copying of files between HDFS clusters.

What do you mean by speculative execution in Hadoop?

In case, a node executes a task slower, the master node has the ability to start the same task on another node. As a result, the task that finishes off first will be accepted and the other one will be rejected. This entire procedure is known as “speculative execution”.

What is “WAL” in HBase?

Here, WAL stands for “Write Ahead Log (WAL)”, which is a file located in every Region Server across the distributed environment. It is mostly used to recover data sets in case of mishaps.

How to do a file system check in HDFS?

FSCK command is your to-go option to do file system check in HDFS. This command is extensively used to block locations or names or check overall health of any files.

Follow

hdfs fsck /dir/hadoop-test -files -blocks –locations

What sets apart an InputSplit from a Block?

A block divides the data, physically without taking into account the logical equations. This signifies you can posses a record that originated in one block and stretches over to another. On the other hand, InputSplit includes the logical boundaries of records, which are crucial too.

Why should you use Storm for Real-Time Processing?

  • Easy to operate simple operating system makes it easy
  • Fast processing it can process around 100 messages per second per node
  • Fault detection it can easily detect faults and restarts functional attributes
  • Scores high on reliability expect execution of each data unit at least for once
  • High scalability it operates throughout clusters of machines


The article has been sourced from
– www.besthadooptraining.in/blog/top-100-hadoop-interview-questions


Learn how Big Data Hadoop can help you manage your business data decisions from DexLab Analytics. We are a leading Big Data Hadoop training institute in Delhi NCR region offering industry standard big data related courses for data-aspiring candidates. 


Interested in a career in Data Analyst?

To learn more about Data Analyst with Advanced excel course – Enrol Now.
To learn more about Data Analyst with R Course – Enrol Now.
To learn more about Big Data Course – Enrol Now.

To learn more about Machine Learning Using Python and Spark – Enrol Now.
To learn more about Data Analyst with SAS Course – Enrol Now.
To learn more about Data Analyst with Apache Spark Course – Enrol Now.
To learn more about Data Analyst with Market Risk Analytics and Modelling Course – Enrol Now.

Call us to know more