hadoop certification in delhi Archives - Page 2 of 4 - DexLab Analytics | Big Data Hadoop SAS R Analytics Predictive Modeling & Excel VBA

How Can Big Data Tools Complement a Data Warehouse?

How Can Big Data Tools Complement a Data Warehouse?

Every person believes that he/she is above average. Businesses feel the same way about their best asset— data. They want to believe that their big data is above average and perfect for implementing advanced big data tools. But, that’s not the case always.

Do you really need big data tools?

In the data world, big data tools like Hadoop Spark and NoSQL are like freight trains delivering goods. Freight trains are powerful, but they’ve limited routes and a slow start. They are great for delivering goods in bulk regularly. However, if you need a swift delivery, freight train might not be the best choice.

So firs of all, it is important to understand if there’s a big data scenario in your business or not.

A 100 times increase in data velocity, volume or variety indicates that you have a big data situation at hand. For example, if data velocity increases to hundreds of thousands of transactions per hour from thousands of transactions, or if the data sources shoot up from dozens to hundreds, you can safely conclude that your business is dealing with big data.

In such scenarios, you are likely to get frustrated with traditional SQL tools. A complete revamp or moderate tuning of existing big data tools is needed to effectively handle such massive data sets.

2

What tools to use?

The tool to be used depends on the task at hand. For main business outcomes like sales, payments, etc., traditional reporting tools employed within the data warehouse architecture are suitable. For secondary business outcomes like following the customer journey in detail, tracking browsing history and monitoring device activity, big data tools within data warehouse are necessary. In a data warehouse these events are aggregated into models that show the summarized business processes.

Incorporating Big Data Tools in Data Warehouse

Consider an alarm company with sensors that are connected though the internet across an entire country. Storing the response of individual sensors in a SQL data warehouse would incur huge expenses, but no value. An alternative storage solution is retaining this information in data lake environments that are cheaper and later aggregating them in a data warehouse. For example, the company could define sensor events that constitute a person locking up a house. A fact table recording departures and arrivals could be stoked up in a data warehouse as an aggregate event.

There are many other use cases. Some are given below:

Sum up and filter IoT data:  A leading bed manufacturing company uses biometric sensors in their range of luxury mattresses. Apache Hadoop could be used to store individual sensor readings and Apache Spark can be employed to amass and filter signals. The aggregated data in data warehouses can be used to create time-trended reports once the boundary metrics are surpassed.

Merge real-time data with past data: Financial institutes need live access to market data. However, they also need to store that data and use it for identifying historical trends in future. Merging these two types of data with tools like Apache Kafka or Amazon Kinesis is important because, with these tools the data can be directly streamed to visualization tools and there’s hardly any delay.

The ultimate goal is to form a balance between the two sides of the data pipeline. While it is important to collect as much raw data about customers as possible, it is equally important to use the right tool for the right job.

To read more blogs on the latest developments in the field of big data, follow DexLab Analytics. We are a premier Hadoop training institute in Gurgaon. To aid your big data dreams, we have started a new admission drive #BigDataIngestion where we offer flat 10% discount to all students interested in our big data Hadoop courses. Enroll now!


Reference: https://tdwi.org/articles/2018/07/20/arch-all-5-use-cases-integrating-big-data-tools-with-data-warehouse.aspx


Interested in a career in Data Analyst?

To learn more about Data Analyst with Advanced excel course – Enrol Now.
To learn more about Data Analyst with R Course – Enrol Now.
To learn more about Big Data Course – Enrol Now.

To learn more about Machine Learning Using Python and Spark – Enrol Now.
To learn more about Data Analyst with SAS Course – Enrol Now.
To learn more about Data Analyst with Apache Spark Course – Enrol Now.
To learn more about Data Analyst with Market Risk Analytics and Modelling Course – Enrol Now.

The 8 Leading Big Data Analytics Influencers for 2018

The 8 Leading Big Data Analytics Influencers for 2018

Big data is one of the most talked about technology topics of the last few years. As big data and analytics keep evolving, it is important for people associated with it to keep themselves updated about the latest developments in this field. However, many find it difficult to be up to date with the latest news and publications.

If you are a big data enthusiast looking for ways to get your hands on the latest data news, then this blog is the ideal read for you. In this article, we list the top 8 big data influencers of 2018. Following these people and their blogs and websites shall keep you informed about all the trending things in big data.

2

Kirk Borne

Known as the kirk in the field of analytics, his popularity has been growing over the last couple of years.  From 2016 to 2017, the number of people following him grew by 30 thousand. Currently he’s the principal data scientist at Booz Allen; previously he has worked with NASA for a decade. Kirk was also appointed by the US president to share his knowledge on Data Mining and how to protect oneself from cyber attacks. He has participated in several Ted talks. So, interested candidates should listen to those talks and follow him on Twitter.

Ronald Van Loon

He is an expert on not only big data, but also Business Intelligence and the Internet of Things, and writes articles on these topics so that readers become familiar with these technologies. Ronald writes for important organizations like Dataconomy and DataFloq. He has over hundred thousand followers on Twitter. Currently, he works as a big data educator at Simplelearn.

Hilary Manson

She is a big data professional who manages multiple roles together. Hilary is a data scientist at Accel, Vice president at Cloudera, and a speaker and writer in this field. Back in 2014, she founded a machine learning research company called Fast Forward labs. Clearly, she is a big data analytics influencer that everyone should follow.

Carla Gentry

Currently working in Samtec Inc; she has helped many big shot companies to draw insights from complicated data and increase profits. Carla is a mathematician, an economist, owner of Analytic Solution, a social media ethusiat, and a must-follow expert in this field.

Vincent Granville

Vincent Granville’s thorough understanding of topics like machine learning, BI, data mining, predictive modeling and fraud detection make him one the best influencers of 2018. Data Science Central-the popular online platform for gaining knowledge on big data analytics has been cofounded by Vincent.

Merv Adrian

Presently the Research Vice President at Gartner, he has over 30 years of experience in IT sector. His current work focuses on upcoming Hadoop technologies, data management and data security problems. By following Merv’s blogs and twitter posts, you shall be informed about important industry issues that are sometimes not covered in his Gartner research publications.

Bernard Marr

Bernard has earned a good reputation in the big data and analytics world. He publishes articles on platforms like LinkedIn, Forbes and Huffington Post on a daily basis. Besides being the major speaker and strategic advisor for top companies and the government, he is also a successful business author.

Craig Brown

With over twenty years of experience in this field, he is a renowned technology consultant and subject matter expert. The book Untapped Potential, which explains the path of self-discovery, has been written by Craig.

If you have read the entire article, then one thing is very clear-you are a big data enthusiast! So, why not make your career in the big data analytics industry?

Enroll for big data Hadoop courses in Gurgaon for a firm footing in this field. To read more interesting blogs regularly, follow Dexlab Analytics– a leading big data Hadoop training center in Delhi. Interested candidates can avail flat 10% discount on selected courses at DexLab Analytics.


Reference: www.analyticsinsight.net/top-12-big-data-analytics-and-data-science-influencers-in-2018


Interested in a career in Data Analyst?

To learn more about Data Analyst with Advanced excel course – Enrol Now.
To learn more about Data Analyst with R Course – Enrol Now.
To learn more about Big Data Course – Enrol Now.

To learn more about Machine Learning Using Python and Spark – Enrol Now.
To learn more about Data Analyst with SAS Course – Enrol Now.
To learn more about Data Analyst with Apache Spark Course – Enrol Now.
To learn more about Data Analyst with Market Risk Analytics and Modelling Course – Enrol Now.

Analytics of Things is Transforming the Way Businesses Run

Analytics of Things is Transforming the Way Businesses Run

As Internet of Things (IoT) invades every aspect of our lives, big data analytics is likely to be utilized for many more things other than solving business problems. This growing popularity of big data analytics, which is altering the way businesses run, has given birth to a new term- ‘ Analytics of Things’.

Much before big data was identified as the most valuable asset for businesses, enterprises had expressed need for a system that could handle an ‘information explosion’. In 2006, an open source distributed storage and processing system was developed. This system called Hadoop spread across commodity hardware and encouraged the nurturing of many more open source projects that would target different aspects of data and analytics.

Growth of Hadoop:

The primary objective with which Hadoop was developed was storing large volumes of data in a cost effective manner. Enterprises were clueless how to handle their ever increasing volumes of data. So, the first requirement was to dump all that data in a data lake and figure out the use cases gradually. Initially, there used to be a standard set of open source tools for managing data and the data architecture lacked variety.

Prior to adopting big data, companies managed their reporting systems through data warehouses and different types of data management tools. The telecom and banking industry were among the first to step into big data. Over time, some of them completely shifted their reporting work to Hadoop.

2

Evolution of big data architecture:

Big data tools have witnessed drastic evolution. This encouraged enterprises to employ a new range of use cases on big data using the power of real-time processing hubs. This includes fraud detection, supply chain optimization and digital marketing automation among other things. Since Hadoop’s birth in 2006, big data has developed a lot. Some of these developments include intelligent automation and real-time analytics.

To keep up with the demands for better big data architecture, real-time analytics was incorporated in Hadoop and its speed was also improved. Different cloud vendors developed Platform as a Service (PaaS) component and this development was a strong driving force behind big data architectures becoming more diverse.

As companies further explored ways to extract more meaning from their data, it led to the emergence of two major trends: Analytics as a service (AaaS) and data monetization.

AaaS platforms provided a lot of domain experience and hence gave generic PaaS platforms a lot more context. This development made big data architecture more compact.

Another important development came with data monetization. Some sectors, like healthcare and governance, depend heavily on data collected through a range of remote IoT devices. To make these processes speedier and reduce network load, localized processing was needed and this led to the emergence of ‘edge analytics’. Now, there is good sync between edge and centralized platforms, which in turn enhances the processes of data exchange and analysis.

The above mentioned developments show how much big data has evolved and that currently a high level of fine-tuning is possible in its architecture.

Often enterprises struggle with successful implementation of big data. The first step is to define your big data strategy. Instead of going for full blown implementation, undertake shorter implementation cycles.

It is highly likely that our future will become completely driven by big data and ground-breaking innovations like automated analysts and intelligent chatbots. Don’t be left behind. Enroll for big data Hadoop certification courses and take full advantage of the power big data holds in today’s world of work. The big data Hadoop training in Gurgaon ensures that every student becomes proficient enough to face real challenges in the industry. Enroll now and get flat 10% discount on all big data certification courses.


Reference: www.livemint.com/AI/bRwVnGBm6hH78SoUIccomL/Big-Data-Analytics-of-Things-upend-the-way-biz-gets-done.html


Interested in a career in Data Analyst?

To learn more about Data Analyst with Advanced excel course – Enrol Now.
To learn more about Data Analyst with R Course – Enrol Now.
To learn more about Big Data Course – Enrol Now.

To learn more about Machine Learning Using Python and Spark – Enrol Now.
To learn more about Data Analyst with SAS Course – Enrol Now.
To learn more about Data Analyst with Apache Spark Course – Enrol Now.
To learn more about Data Analyst with Market Risk Analytics and Modelling Course – Enrol Now.
Rudiments of Hierarchical Clustering: Ward’s Method and Divisive Clustering

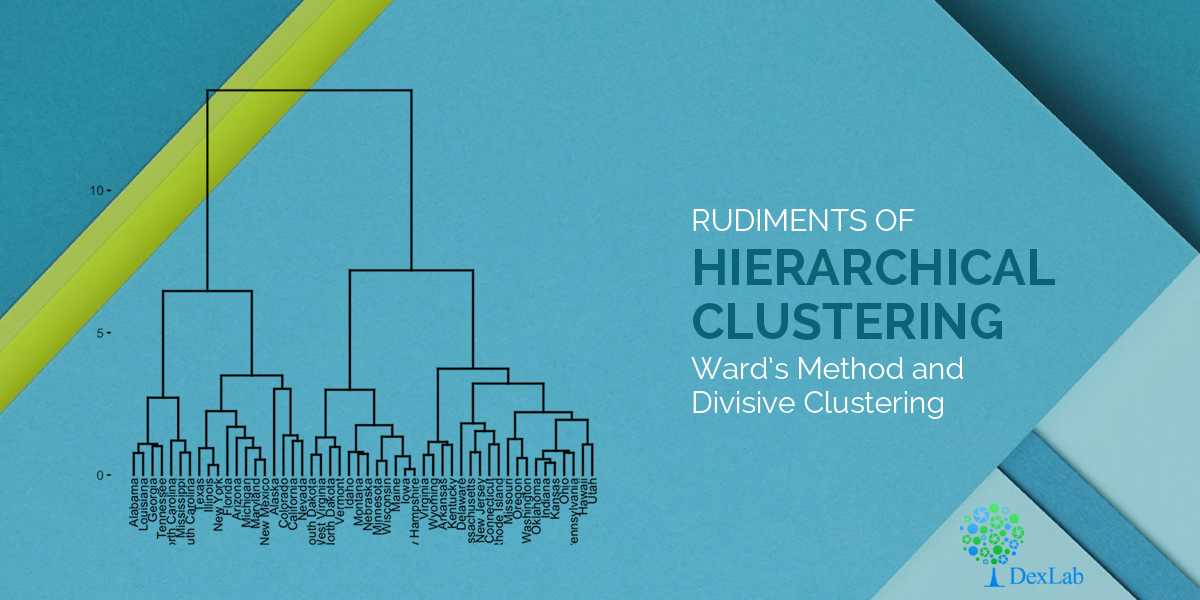
Rudiments of Hierarchical Clustering: Ward’s Method and Divisive Clustering

Clustering, a process used for organizing objects into groups called clusters, has wide ranging applications in day to day life, including fields like marketing, city-planning and scientific research.

Hierarchical clustering, one the most common methods of clustering, builds a hierarchy of clusters either by a ‘’bottom up’’ approach (Agglomerative clustering) or by a ‘’top down’’ approach (Divisive clustering). In the previous blogs, we have discussed the various distance measures and how to perform Agglomerative clustering using linkage types. Today, we will explain the Ward’s method and then move on to Divisive clustering.

Ward’s method:

This is a special type of agglomerative hierarchical clustering technique that was introduced by Ward in 1963. Unlike linkage method, Ward’s method doesn’t define distance between clusters and is used to generate clusters that have minimum within-cluster variance. Instead of using distance metrics it approaches clustering as an analysis of variance problem. The method is based on the error sum of squares (ESS) defined for jth cluster as the sum of the squared Euclidean distances from points to the cluster mean.

Where Xij is the ith observation in the jth cluster. The error sum of squares for all clusters is the sum of the ESSj values from all clusters, that is,

Where k is the number of clusters.

The algorithm starts with each observation forming its own one-element cluster for a total of n clusters, where n is the number of observations. The mean of each of these on-element clusters is equal to that one observation. In the first stage of the algorithm, two elements are merged into one cluster in a way that ESS (error sum of squares) increases by the smallest amount possible. One way of achieving this is merging the two nearest observations in the dataset.

Up to this point, the Ward algorithm gives the same result as any of the three linkage methods discussed in the previous blog. However, as each stage progresses we see that the merging results in the smallest increase in ESS.

This minimizes the distance between the observations and the centers of the clusters. The process is carried on until all the observations are in a single cluster.

2

Divisive clustering:

Divisive clustering is a ‘’top down’’ approach in hierarchical clustering where all observations start in one cluster and splits are performed recursively as one moves down the hierarchy. Let’s consider an example to understand the procedure.

Consider the distance matrix given below. First of all, the Minimum Spanning Tree (MST) needs to be calculated for this matrix.

The MST Graph obtained is shown below.

The subsequent steps for performing divisive clustering are given below:

Cut edges from MST graph from largest to smallest repeatedly.

Step 1: All the items are in one cluster- {A, B, C, D, E}

Step 2: Largest edge is between D and E, so we cut it in 2 clusters- {E}, {A., B, C, D}

Step 3: Next, we remove the edge between B and C, which results in- {E}, {A, B} {C, D}

Step 4: Finally, we remove the edges between A and B (and between C and D), which results in- {E}, {A}, {B}, {C} and {D}

Hierarchical clustering is easy to implement and outputs a hierarchy, which is structured and informative. One can easily figure out the number of clusters by looking at the dendogram.

However, there are some disadvantages of hierarchical clustering. For example, it is not possible to undo the previous step or move around the observations once they have been assigned to a cluster. It is a time-consuming process, hence not suitable for large datasets. Moreover, this method of clustering is very sensitive to outlietrs and the ordering of data effects the final results.

In the following blog, we shall explain how to implement hierarchical clustering in R programming with examples. So, stay tuned and follow DexLab Analytics – a premium Big Data Hadoop training institute in Gurgaon. To aid your big data dreams, we are offering flat 10% discount on our big data Hadoop courses. Enroll now!


Check back for our previous blogs on clustering:

Hierarchical Clustering: Foundational Concepts and Example of Agglomerative Clustering

A Comprehensive Guide on Clustering and Its Different Methods
 

Interested in a career in Data Analyst?

To learn more about Data Analyst with Advanced excel course – Enrol Now.
To learn more about Data Analyst with R Course – Enrol Now.
To learn more about Big Data Course – Enrol Now.

To learn more about Machine Learning Using Python and Spark – Enrol Now.
To learn more about Data Analyst with SAS Course – Enrol Now.
To learn more about Data Analyst with Apache Spark Course – Enrol Now.
To learn more about Data Analyst with Market Risk Analytics and Modelling Course – Enrol Now.

Predicting World Cup Winner 2018 with Big Data

Predicting World Cup Winner 2018 with Big Data

Is there any way to predict who will win World Cup 2018?

Could big data be used to decipher the internal mechanisms of this beautiful game?

How to collect meaningful insights about a team before supporting one?

Data Points

Opta Sports and STATS help predict which teams will perform better. These are the two sports companies that have answers to all the above questions. Their objective is to collect data and interpret it for their clients, mainly sports teams, federations and of course media, always hungry for data insights.

How do they do it? Opta’s marketing manager Peter Deeley shares that for each football match, his company representatives collects as many as 2000 individual data points, mostly focused on ‘on-ball’ actions. Generally, a team of three analysts operates from the company’s data hub in Leeds; they record everything happening on the pitch and analyze the positions on the field where each interaction takes place. The clients receive live data; that’s the reason why Gary Lineker, former England player is able to share information like possession and shots on goal during half time.

The same procedure is followed at Stats.com; Paul Power, a data scientist from Stats.com explains how they don’t rely only on humans for data collection, but on latest computer vision technologies. Though computer vision can be used to log different sorts of data, yet it can never replace human beings altogether. “People are still best because of nuances that computers are not going to be able to understand,” adds Paul.

Who is going to win?

In this section, we’re going to hit the most important question of this season – which team is going to win this time? As far as STATS is concerned, it’s not too eager to publish its predictions this year. The reason being they believe is a very valuable piece of information and by spilling the beans they don’t want to upset their clients.

On the other hand, we do have a prediction from Opta. According to them, veteran World Cup champion Brazil holds the highest chance of taking home the trophy – giving them a 14.2% winning chance. What’s more, Opta also has a soft corner for Germany – thus giving them an 11.4% chance of bringing back the cup once again.

If it’s about prediction and accuracy, we can’t help but mention EA Sports. For the last 3 World Cups, it maintained a track record of predicting the eventual World Cup winner impeccably. Using the encompassing data about the players and team rankings in FIFA 2018, the company representatives ran a simulation of the tournament, in which France came out to be the winner, defeating Germany in the final. As it has already predicted right about Germany and Spain in 2014 and 2010 World Cups, consecutively, this new revelation is a good catch.

So, can big data predict the World Cup winner? We guess yes, somehow.

DexLab Analytics Presents #BigDataIngestion

If you are interested in big data hadoop certification in Noida, we have some good news coming your way! DexLab Analytics has started a new admission drive for prospective students interested in big data and data science certification. Enroll in #BigDataIngestion and enjoy 10% off on in-demand courses, including data science, machine learning, hadoop and business analytics.


The blog has been sourced from – https://www.techradar.com/news/world-cup-2018-predictions-with-big-data-who-is-going-to-win-what-and-when


Interested in a career in Data Analyst?

To learn more about Data Analyst with Advanced excel course – Enrol Now.
To learn more about Data Analyst with R Course – Enrol Now.
To learn more about Big Data Course – Enrol Now.

To learn more about Machine Learning Using Python and Spark – Enrol Now.
To learn more about Data Analyst with SAS Course – Enrol Now.
To learn more about Data Analyst with Apache Spark Course – Enrol Now.
To learn more about Data Analyst with Market Risk Analytics and Modelling Course – Enrol Now.

Fintech Companies: How They Are Revolutionizing the Banking Industry?

Fintech Companies: How They Are Revolutionizing the Banking Industry?

The world of technology is expanding rapidly. And so is the finance. Fintech is the new buzzword; and its extensive use of cutting edge algorithms, big data solutions and AI is transforming the traditional banking sector.

Nevertheless, there exist many obstacles, which fintech companies need to deal with before creating an entirely complementary system that covers the gap between both.

Ezbob and LaaS

Innovation takes time to settle, but with little effort, banks can strike gold than ever. New transparency laws and digital standards are being introduced and if banks are quicker in embracing this new technology, they can ring off success very easily. Not every fintech is determined to cause discomfort to banks, in fact a lot of fintech startups offer incredible services to attract new customers.

One of them is ezbob, a robust platform in partnership with multiple major banking institutions that streamlines an old process with cutting edge technology. This platform develops a smooth, automatic lending process for bank’s customers by sorting data accumulated from more than 25 sources in real time. Currently, it’s leading Lending-as-a-Service (LaaS) industry, which is deemed to be the future of banking sector.

LaaS is one of the key transforming agents that have brought in a new trend in the banking sector. It reflects how everyone can benefit, including customers and partners, when efficiency is improved. Real time decisions are crucial; it helps bankers turn attention to the bigger picture, while technology takes care of other factors.

2

The Art of Regulations

Conversely, fintech startups should be wary of regulations. Notwithstanding the fact that technology is fast decentralizing the whole framework and disrupting institutional banking sector, fintech companies should focus on regulation and be patient with all the innovations taking place around. Banks need time to accept the potentials of fintech’s innovation but once they do, they would gain much more from adopting these technologies.

The aftermath of 2008 financial crisis have made it relatively easier for fintech startups to remain compliant and be more accountable. One of the latest regulations passed is about e-invoicing, which require organizations should send digital invoices through a common system. This measure is expected to save billions of dollars on account of businesses and governments, as well.

Some of the other reforms that have been passed recently are mainly PSD2, which has systematized mobile and internet payments, and AMLD, which is an abbreviation of Anti Money Laundering Directive. The later hurts those who don’t want to be accountable for their income, or involved in terrorism activities.

Conclusion

As closing thoughts, we all can see the financial sector has been the largest consumers of big data technology. According to Gartner, 64% of financial service companies have used big data in 2013. And the figures are still rising.

To be the unicorn among the horses, it’s high time to imbibe big data hadoop skills. This new-age skill is going to take you a long way, provided you get certified from a reputable institute. In Delhi-Gurgaon region, we’ve DexLab Analytics. It offers state-of-the-art hadoop training in Gurgaon. For more information, drop by their site now.

DexLab Analytics Presents #BigDataIngestion

A Special Alert: DexLab Analytics is offering #SummerSpecial 10% off on in-demand courses of big data hadoop, data science, machine learning and business analytics. Enroll now for #BigDataIngstion: the new on-going admission drive!

 
The blog has been sourced from – http://dataconomy.com/2017/10/rise-fintechpreneur-matters
 

Interested in a career in Data Analyst?

To learn more about Data Analyst with Advanced excel course – Enrol Now.
To learn more about Data Analyst with R Course – Enrol Now.
To learn more about Big Data Course – Enrol Now.

To learn more about Machine Learning Using Python and Spark – Enrol Now.
To learn more about Data Analyst with SAS Course – Enrol Now.
To learn more about Data Analyst with Apache Spark Course – Enrol Now.
To learn more about Data Analyst with Market Risk Analytics and Modelling Course – Enrol Now.

How Big Data Plays the Key Role in Promoting Cyber Security

The number of data breaches and cyber attacks is increasing by the hour. Understandably, investing in cyber security has become the business priority for most organizations. Reports based on a global survey of 641 IT and cyber security professionals reveal that a whopping 69% of organizations have resolved to increase spending on cyber security. The large and varied data sets, i.e., the BIG DATA, generated by all organizations small or big, are boosting cyber security in significant ways.

How Big Data Plays the Key Role in Promoting Cyber Security

Business data one of the most valuable assets of a company and entrepreneurs are becoming increasingly aware of the importance of this data in their success in the current market economy. In fact, big data plays the central role in employee activity monitoring and intrusion detection, and thereby combats a plethora of cyber threats.

Let’s Take Your Data Dreams to the Next Level

  1. EMPLOYEE ACTIVITY MONITERING:

Using an employee system monitoring program that relies on big data analytics can help a company’s human resource division keep a track on the behavioral patterns of their employees and thereby prevent potential employee-related breaches. Following steps may be taken to ensure the same:

  • Restricting the access of information only to the staff that is authorized to access it.
  • Staffers should use theirlogins and other system applications to change data and view files that they are permitted to access. 
  • Every employee should be given different login details depending on the complexity of their business responsibilities.


  1. INTRUSION DETECTION:

A crucial measure in the big data security system would be the incorporation of IDS – Intrusion Detection System that helps in monitoring traffic in the divisions that are prone to malicious activities. IDS should be employed for all the pursuits that are mission-crucial, especially the ones that make active use of the internet. Big data analytics plays a pivotal role in making informed decisions about setting up an IDS system as it provides all the relevant information required for monitoring a company’s network.

The National Institute of Standards and Technology recommends continuous monitoring and real-time assessments through Big Data analytics. Also the application of predictive analytics in the domain of optimization and automation of the existing SIEM systems is highly recommended for identifying threat locations and leaked data identity.

  1. FUTURE OF CYBER SECURITY:

Security experts realize the necessity of bigger and better tools to combat cyber crimes. Building defenses that can withstand the increasingly sophisticated nature of cyber attacks is the need of the hour. Hence advances in big data analytics are more important than ever.

Relevance of Hadoop in big data analytics:

  • Hadoop provides a cost effective storage solution to businesses.
  • It facilitates businesses to easily access new data sources and draw valuable insights from different types of data.
  • It is a highly scalable storage platform.
  • The unique storage technique of Hadoop is based on a distributed file system that primarily maps the data when placed on a cluster. The tools for processing data are often on the same servers where the data is located. As a result data processing is much faster.
  • Hadoop is widely used across industries, including finance, media and entertainment, government, healthcare, information services, and retail.
  • Hadoop is fault-tolerant. Once information is sent to an individual node, that data is replicated in other nodes in the cluster. Hence in the event of a failure, there is another copy available for use.
  • Hadoop is more than just a faster and cheaper analytics tool. It is designed as a scale-out architecture that can affordably store all the data for later use by the company.


Developing economies are encouraging investment in big data analytics tools, infrastructure, and education to maintain growth and inspire innovation in areas such as mobile/cloud security, threat intelligence, and security analytics.

Thus big data analytics is definitely the way forward. If you dream of building a career in this much coveted field then be sure to invest in developing the relevant skill set. The Big Data training and Hadoop training imparted by skilled professionals at Dexlab Analytics in Gurgaon, Delhi is sure to give you the technical edge that you seek. So hurry and get yourself enrolled today!


Interested in a career in Data Analyst?

To learn more about Machine Learning Using Python and Spark – click here.

To learn more about Data Analyst with Advanced excel course – click here.
To learn more about Data Analyst with SAS Course – click here.
To learn more about Data Analyst with R Course – click here.
To learn more about Big Data Course – click here.

If Big Data is the Problem, Then Hadoop is the Solution

If Big Data is the Problem, Then Hadoop is the Solution

A lot of IT professionals and tech nerds are curious to learn about the difference between Big Data and Hadoop. A majority of them are yet to understand the subtle line of distinction between the two. And the increasing prominence and popularity of Big Data Hadoop certification has further added to the confusion.

Importantly, Big Data and Hadoop, the most popular open-source Hadoop program actually ends up complementing each other, in every way. If you think of Big Data as a problem then Hadoop acts like a solution for that problem – yes, they are that much compatible and complementary to each other. While big data is a dubious and complex concept, Hadoop being a simple, open source program that helps in fulfilling a certain creed of objectives of asset, in this case Big Data.

The best way to explain this issue would be by talking about the challenges associated with Big Data and how Hadoop efficiently resolves them – this would be the best way to know the differences between the two.

2

Challenges with Big Data

Big Data is best defined with 5 characteristics: Volume, Variety, Velocity, Value and Veracity. Here, volume depicts the quantity of data, variety means the kind of data, velocity is the rate at which data is being generated, value points at the usefulness of the data and veracity is the amount of inconsistent data.

Now, let’s talk about two of the emerging problems with Big Data:

  • Storage The archaic storage solutions are not adept enough to store such mammoth amount of data that is being generated every day. Moreover, the variety of data is different, thus the data needs to be stored separately for effective use.
  • Speed of accessing and processing data Though the hard disk capacities have increased manifold, not much development has been done on the front of the speed of accessing or processing data.

But no more, you have to worry about all these issues, as Hadoop is here. It has effectively mitigated all the above-mentioned challenges and made big data powerful as a rock!

What is Hadoop?

Generally speaking, Hadoop is an open source programming platform – it helped big data to get stored in distributed environments so as to be processed in a parallel way. It is composed of two important elements – Hadoop Distributed File System (HDFS) and YARN (Yet Another Resource Negotiator), Hadoop’s processing unit.

Now, let’s see how Hadoop resolves the emerging big data challenges:

  • Storage – With the help of HDFS, Big Data can now be stored in a proper distributed manner. For that, datanode block is used, it’s an efficient storage solution and allows you to specify the size of every block in use. Additionally, it doesn’t only divides the data across different blocks but also replicated all the blocks on the data nodes, thus making way for better storage solution.
  • The speed of accessing and processing data – Instead of relying on traditional methodologies, Hadoop prefers moving processing to the data, which means the processing dynamo is moved across different slave nodes and parallel processing of data is carried on throughout the slave nodes. And the processed results are then shifted into a master node, where a mixing of data takes place and the response arising out of it is sent to the client.

Hence, you can see how big data and hadoop are related to each other, not like alternatives but like complements. So, to climb the ladder of success and be an ace developer or data scientist, Big Data Hadoop certification in Gurgaon is your go-to option. Get Big Data Hadoop certification today from DexLab Analytics.


Interested in a career in Data Analyst?

To learn more about Data Analyst with Advanced excel course – Enrol Now.
To learn more about Data Analyst with R Course – Enrol Now.
To learn more about Big Data Course – Enrol Now.

To learn more about Machine Learning Using Python and Spark – Enrol Now.
To learn more about Data Analyst with SAS Course – Enrol Now.
To learn more about Data Analyst with Apache Spark Course – Enrol Now.
To learn more about Data Analyst with Market Risk Analytics and Modelling Course – Enrol Now.

Incorporating Hadoop into Adobe Campaign for Advanced Segmentation and Personalization

Big data is the new CRAZE. Reports suggest that investments in big data have surpassed $57 billion in 2017, and are expected to rise by 10% for the next three years.

Incorporating Hadoop into Adobe Campaign for Advanced Segmentation and Personalization

Customers are happy – those who have applied advanced capabilities to predictive analytics, machine learning, customer analytics, customer profiles, inventory management and tracking, and more – as big data implementation across many verticals has resulted in measurable positive results.

Continue reading “Incorporating Hadoop into Adobe Campaign for Advanced Segmentation and Personalization”

Call us to know more