excel training courses in Delhi Archives - DexLab Analytics | Big Data Hadoop SAS R Analytics Predictive Modeling & Excel VBA

G-Suite and Office 365: A Comparison of Spreadsheets for Your Business Needs

G-Suite and Office 365: A Comparison of Spreadsheets for Your Business Needs

When Google introduced its G-Suite in 2006, Microsoft Office was a world leader with virtually no competition. Over time, however, Google Suite (initially known as Google Docs and Spreadsheets) has managed to draw a loyal user base despite its subscription fee. Faced with this new challenge, Microsoft went ahead and introduced in the market what it calls Office 365, a subscription based version of its Office, which is regularly updated with new features.

Common features

G-Suite and Office 365 have many features and aspects in common. For instance, both work offline and both offer apps for the Android and iOS versions. The suites offer the same core and basic utilities. They have word processing, spreadsheet, presentation, email, calendar, contacts, video conferencing, and programs like messaging, note-taking software among others. The two suites also have cloud storage though these are different from each other by virtue of the tools used to manage them.

When thinking about which suite to use for your business needs, compare the prices of the two. But before that, it is important that you know that you can use several online apps from the two suites – like Google Docs, Sheets and Slides as well as Microsoft Word Online, Excel Online and Powerpoint Online. In India, Microsoft is still a little more popular and it is not surprising that institutes aiming at excellence in computing like DexLab Analytics prefer to have a separate course on excel certification in gurgaon.

Cost and Word Processors

The G-Suite comes in three ranges – Basic, Business and Enterprise with the prices starting from $6 to $25 per month. Office 365 is a little expensive, its cost ranging from $5 to $35 per month. When it comes to their word processing software, Google Docs is better for collaboration while Word has numerous editing features and templates to offer.

Spreadsheets and Presentations

When it comes to Google Sheets against Microsoft Excel, again, collaboration becomes the bellwether. If users are prone to working on spreadsheets by themselves without collaborating with others, then Microsoft Excel is the application for you. But if you are going to collaborate with fellow workers, then Google Sheets is the option for you. Similarly, collaboration is easier on Google Sheets than it is on Powerpoint but for every other reason, be they charts or slide layouts, Powerpoint is the winner.

Email

If you prefer simplicity over clutter, then Gmail is your go-to mail service. Gmail has succeeded in cutting the clutter and offers this really fast and streamlined mail service. However, Microsoft Outlook is also trying to be as straightforward as possible. It can be anything, composing a mail to managing it and responding to it, Gmail has a system which is intuitive and understands user response. When it comes to the Microsoft Outlook, power features like the Focused Inbox are a great draw. Focused Inbox helps prioritize important mails and enables you to read them and respond to them first.

Data Science Machine Learning Certification

And, “because the contacts and calendar functions are part of Outlook itself, they’re well integrated with email. Gmail relies on the separate Google Contacts and Calendar apps, which can be a bit more cumbersome to navigate”, says a handy report on the comparison of the two suites.


Interested in a career in Data Analyst?

To learn more about Data Analyst with Advanced excel course – Enrol Now.
To learn more about Data Analyst with R Course – Enrol Now.
To learn more about Big Data Course – Enrol Now.

To learn more about Machine Learning Using Python and Spark – Enrol Now.
To learn more about Data Analyst with SAS Course – Enrol Now.
To learn more about Data Analyst with Apache Spark Course – Enrol Now.
To learn more about Data Analyst with Market Risk Analytics and Modelling Course – Enrol Now.

Ms Excel is All-Powerful: Some Tasks You Never Know You Could Do With Excel!

Ms Excel is All-Powerful: Some Tasks You Never Know You Could Do With Excel!

Data is everywhere and evident. With the multiplication of data and the increasing need to preserve it, we must always organise data. A properly organised data not only makes it easier to analyse data in the future, but it also makes everything clear and presentable. 

Though we had some initial difficulties of maintaining data right at the beginning, MS Excel has surely been making our tasks easier ever since it was discovered. Therefore, it is not a shock that Microsoft Excel is one of the most demanding skills in the present age we are living. However, you should always choose the Advanced excel institute in Gurgaon, if you are interested in learning MS Excel in a top-notch environment, from the experts. 

Microsoft Excel and its Advantages

Microsoft Excel has come a long way from helping us in the basic tasks of keeping things comprehensible and organised. Many of our daily chores of simple arithmetic calculations, interactive representation of data in the form of tables, charts and statistical representation of data via bar graphs, line graphs and pie charts are easier than ever with MS Excel. Besides, with the progressive age, it is remarkable how Excel is keeping up with the dizzying pace and the rising demands of the technological advancements we are experiencing a day in and day out.

Business Intelligence and location intelligence are the new trends of the hour and you can count on MS Excel to help you out with them as well. If you find us asking for too much here, then check some compelling tasks which you can perform via MS Excel.

Data Science Machine Learning Certification

You can Wield the Spreadsheet as a Map

Did you know that you can gain a deep insight into the location just through your spreadsheets? Well, perhaps you can! 

Though your spreadsheet appears to be all tables, they can eventually fetch you important information on the location. Moreover, you can also look at MS Excel as a spatial dataset bringing you spatial relationships, which is similar to a GML or an Esri Shapefile. Besides, with the introduction of innovative FME technology, you can:

  1. Convert the existing coordinates into geometrical representations of latitudes and longitudes.
  2. Geocode the available addresses on your spreadsheet to spatialize them automatically. ArcGIS Online and Google are some of the popular options òf geocoding services that you can avail.
  3. Associate your spreadsheet to an existing geometry stored somewhere else. 

Merge all into One with Ms Excel

You might gather data in a wide range of available formats but you need not be confused with MS Excel. Whether your data is in complex spreadsheets, represented by GIS and CAD drawings or etched in the form of orthophotos, you can import them all and most importantly, merge them with your current MS Excel worksheet. Moreover, FME also enables you to integrate your spreadsheet with data in variegated formats. Therefore, you just need to build a workflow initially and you can import a convincing amount of data and merge them just as you want to.

To Sum Up!

Apart from these, you can also load all your data; manage and analyse data effectively and generate lengthy reports and summaries without any hassles. Therefore, it is important to grasp all the latest skills of MS Excel to be updated with the age. Here’s where Dexlab Analytics stands by you as a compelling companion with Advanced Excel course in Gurgaon

Automation is seeping into every other discipline and the same goes for Excel as well. So, if you are interested to explore the world of automation in relation to MS Excel, then check out the upcoming workshop scheduled by Dexlab on 28th and 29th of December, 2019, promising you intensive training on Automation in Ms Excel.

If you also want to be a part of this all-inclusive training, then


This blog is sourced from www.safe.com/blog/2015/03/5-automated-excel-tasks


Interested in a career in Data Analyst?

To learn more about Data Analyst with Advanced excel course – Enrol Now.
To learn more about Data Analyst with R Course – Enrol Now.
To learn more about Big Data Course – Enrol Now.

To learn more about Machine Learning Using Python and Spark – Enrol Now.
To learn more about Data Analyst with SAS Course – Enrol Now.
To learn more about Data Analyst with Apache Spark Course – Enrol Now.
To learn more about Data Analyst with Market Risk Analytics and Modelling Course – Enrol Now.

Know More, Practice Hard: Best MIS Interview Questions for You

Know More, Practice Hard: Best MIS Interview Questions for You

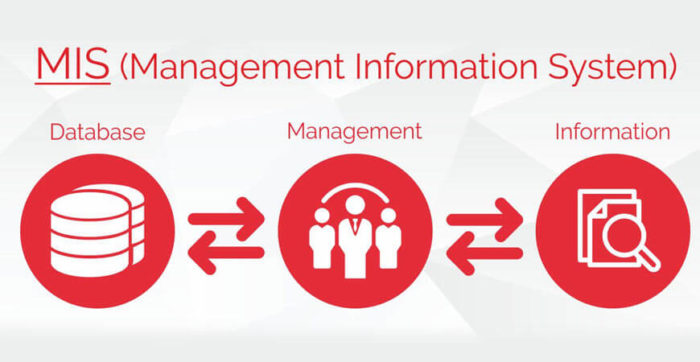
Management Information Systems (MIS) is a game-changer. Today’s businesses fail to survive long without leveraging some kind of MIS structure – MIS manages humongous amounts of data and processes them to fuel decision-making capabilities.

In a nutshell, MIS is a systematic collection of hardware, people, procedures and software that all work together in sync to process, store and generate information that is useful to the enterprise.

Now, are you gearing up to crack an MIS Executive interview? If the answer is in affirmative then you are at the right place. In this blog, we will talk about some common aspects of MIS and its components – this will help you hone your skills and nurture your talent to become an ace research analyst, data analyst or business analyst.

Highlight the objective of an MIS (Management Information Systems).

The main purpose of an MIS is to help the management to come up with superior, strategic and tactical decisions boosting and securing future company growth.

Mention the various types of MIS.

  • Databank Information System
  • Decision Information System
  • Predictive Information System
  • Transaction Processing System

Data Science Machine Learning Certification

What makes MIS so popular?

Take a look below to know what purposes do MIS fulfill, which in turn makes it an indispensable business tool:

  • Management Information Systems is the wonder tool that feeds in relevant information into the minds of decision-makers. This eventually helps them chalk out effective decisions.
  • MIS enables communication within the enterprise as well as outside – employees working within an organization find it extremely easy to lay their hands information for day-to-day operations, but facilities, like emails and SMS, facilitate quick exchange with the customers and suppliers from MIS that the in-question organization has been using.
  • Management Information Systems is an ideal record-keeping tool, keeping in check all business transactions of an enterprise and offering a reference point for transactions.

What are the components of MIS?

The major components of MIS are tabulated below:

  • People are the ones who leverage the information system
  • Data is the essence of MIS
  • Business procedures are the very ways in which you record, store and analyze data
  • Hardware includes workstations, printers, servers, networking equipment and more
  • Software are predetermined programs that handle data – such as database software and spreadsheet programs

Mention the levels of information requirement in an MIS.

  • Organization level
  • Application level
  • Technical level
  • Database level

What are the advantages of MIS?

  • Better data accuracy – say thanks to easy verification checks and data validation!
  • Faster data processing – MIS boosts information retrieval system and ensures fast data processing, leading to an improved and enhanced client-customer relationship.
  • Improved data security – along with restricting user access to the database server, the computerized information system facilitates other security measures, including access right controls, user’s authentication, biometric authentication systems and more.

As a matter of fact, DexLab Analytics is a budding MIS training institute in Gurgaon – it helps professionals and newbies to maintain and revamp the existing MIS within an organization. If interested, you can also hone your advanced Excel skills with Excel training courses in Delhi offered by the same.

The blog has been sourced from – learning.naukri.com/articles/top-mis-executive-interview-questions-answers


Interested in a career in Data Analyst?

To learn more about Data Analyst with Advanced excel course – Enrol Now.
To learn more about Data Analyst with R Course – Enrol Now.
To learn more about Big Data Course – Enrol Now.

To learn more about Machine Learning Using Python and Spark – Enrol Now.
To learn more about Data Analyst with SAS Course – Enrol Now.
To learn more about Data Analyst with Apache Spark Course – Enrol Now.
To learn more about Data Analyst with Market Risk Analytics and Modelling Course – Enrol Now.

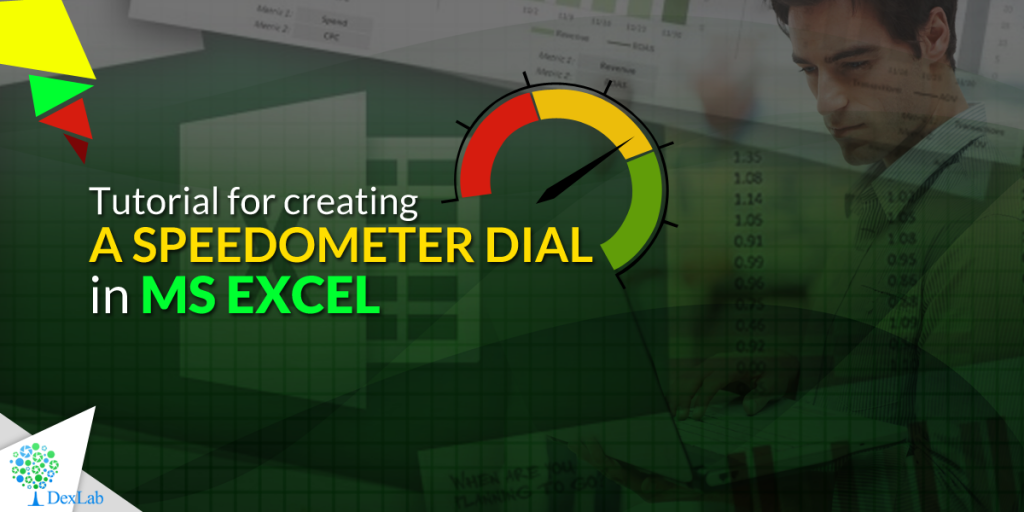
Tutorial for creating a Speedometer dial in MS Excel

 Tutorial for creating a Speedometer dial in MS Excel

Here in this video tutorial we have discussed in detailed steps, how to create a Speedometer chart in MS Excel. A Speedometer chart is often called as a gauge chart and combines two different type of charts, a pie chart and a doughnut chart.

The Speedometer dial is made with the help of using a Doughnut chart and needle is actually a combination of two types of charts, another doughnut chart and a pie chart.

A speedometer chart or a gauge chart can be created in other data visualization software as well, like for instance in Tableau and is usually easier to create due to availability of better controls and features.  It is due to the simplistic nature of these charts which is well adjusted to context of data and is a great use of space in a spreadsheet that charts like these are popular with non-data executives. Usually such non-data personnel do not want to dig deep into the contextual details like an analyst which is why these charts are great for using in a presentation where diverse departmental executives will be participating.

Gauge charts pack in a lot of horsepower and form a sort of ubiquitous symbol when it comes to understanding business metrics from an analytical point of view. So, learn to create these charts with our simple tutorial and for more such interesting lessons on data analysis software, join us every day as we share technical posts based on data on a regular basis.


Interested in a career in Data Analyst?

To learn more about Data Analyst with Advanced excel course – Enrol Now.
To learn more about Data Analyst with R Course – Enrol Now.
To learn more about Big Data Course – Enrol Now.

To learn more about Machine Learning Using Python and Spark – Enrol Now.
To learn more about Data Analyst with SAS Course – Enrol Now.
To learn more about Data Analyst with Apache Spark Course – Enrol Now.
To learn more about Data Analyst with Market Risk Analytics and Modelling Course – Enrol Now.
Gain Expertise in MS Excel with DexLab Analytics

Gain-Expertise-in-MS-Excel-with-DexLab-Analytics

MS Excel needs no introduction as spreadsheet program. As part of the MS Office suite it has been a regular software skill expected from employees across the globe regardless their roles or levels. But the utility of MS Excel in the world of Big Data is not so widely acknowledged due to the lack of awareness. But that does not rob it of any of its sting as a Big Data tool to advanced Excel users.

So if you are keen to know more about the emerging technology that elite techies cannot stop raving about, a solid grounding in MS Excel will serve you well. Accordingly DexLab Analytics has scheduled a symposium on the topic of Designing MS Excel Dashboards as an introduction to the Big Data capabilities of Big Data to aspiring data analystand data scientists. The symposium is going to be MS Excel Experts who also instruct students of DexLab Analytics most of whom have been advanced users of MS Excel for more than a decade.

How to Create a Macro With MS Excel – @Dexlabanalytics.

The main speaker of the symposium is an industry expert who is currently attached with a leading Multi-National Company for over 5 years. He will bring with himself invaluable information regarding the latest developments in data science. We will cover the following topics in the meet scheduled to be held on the 26th of January:

  •  MS Excel functions overview like V Look Up, Match, H Look Up, Address, Match, Countlfs, Indirect, Sumlfs amongst many others.
  •  Introducing the world of recording macros and building VBA.
  • Introducing Advanced Excel with abilities in Dynamic Referencing and pivot.
  • Hot to make use of Excel and VBA in order to generate KPI dashboards.

The interactive session with industry professionals with many years of experience and help you acquire invaluable exposure to the basics of MS Excel so that you get a foretaste of what lies in store for you in this new and exciting world called Big Data.

Note: It is assumed that the participants of this event have a basic understanding of the rudiments of statistics.

Looking for an Advanced excel training in Gurgaon? Drop by DexLab Analytics – their Excel dashboards training is unparalleled!


Interested in a career in Data Analyst?

To learn more about Data Analyst with Advanced excel course – Enrol Now.
To learn more about Data Analyst with R Course – Enrol Now.
To learn more about Big Data Course – Enrol Now.

To learn more about Machine Learning Using Python and Spark – Enrol Now.
To learn more about Data Analyst with SAS Course – Enrol Now.
To learn more about Data Analyst with Apache Spark Course – Enrol Now.
To learn more about Data Analyst with Market Risk Analytics and Modelling Course – Enrol Now.
Call us to know more