Management Information Systems (MIS) is a game-changer. Today’s businesses fail to survive long without leveraging some kind of MIS structure – MIS manages humongous amounts of data and processes them to fuel decision-making capabilities.
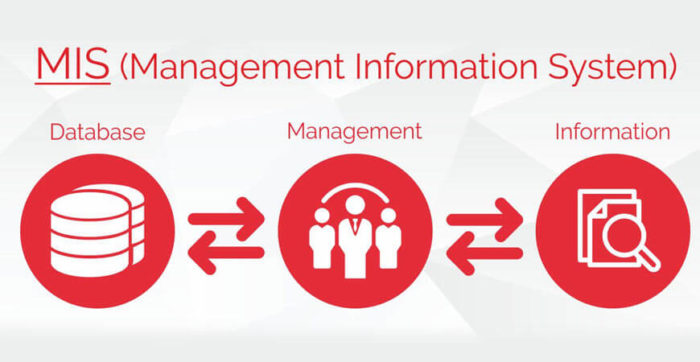
In a nutshell, MIS is a systematic collection of hardware, people, procedures and software that all work together in sync to process, store and generate information that is useful to the enterprise.
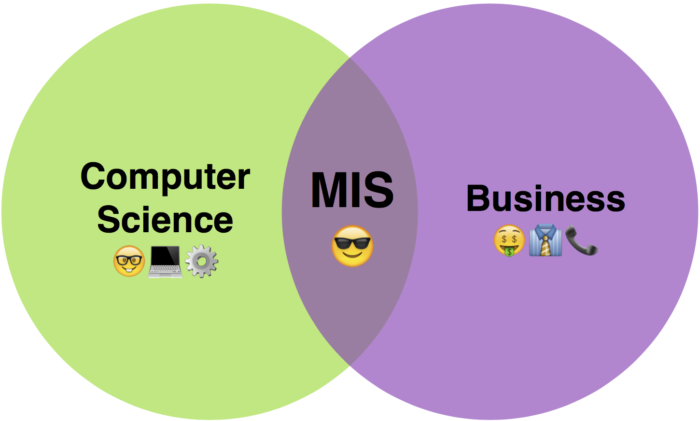
Now, are you gearing up to crack an MIS Executive interview? If the answer is in affirmative then you are at the right place. In this blog, we will talk about some common aspects of MIS and its components – this will help you hone your skills and nurture your talent to become an ace research analyst, data analyst or business analyst.
Highlight the objective of an MIS (Management Information Systems).
The main purpose of an MIS is to help the management to come up with superior, strategic and tactical decisions boosting and securing future company growth.
Mention the various types of MIS.
- Databank Information System
- Decision Information System
- Predictive Information System
- Transaction Processing System

What makes MIS so popular?
Take a look below to know what purposes do MIS fulfill, which in turn makes it an indispensable business tool:
- Management Information Systems is the wonder tool that feeds in relevant information into the minds of decision-makers. This eventually helps them chalk out effective decisions.
- MIS enables communication within the enterprise as well as outside – employees working within an organization find it extremely easy to lay their hands information for day-to-day operations, but facilities, like emails and SMS, facilitate quick exchange with the customers and suppliers from MIS that the in-question organization has been using.
- Management Information Systems is an ideal record-keeping tool, keeping in check all business transactions of an enterprise and offering a reference point for transactions.
What are the components of MIS?
The major components of MIS are tabulated below:
- People are the ones who leverage the information system
- Data is the essence of MIS
- Business procedures are the very ways in which you record, store and analyze data
- Hardware includes workstations, printers, servers, networking equipment and more
- Software are predetermined programs that handle data – such as database software and spreadsheet programs
Mention the levels of information requirement in an MIS.
- Organization level
- Application level
- Technical level
- Database level
What are the advantages of MIS?
- Better data accuracy – say thanks to easy verification checks and data validation!
- Faster data processing – MIS boosts information retrieval system and ensures fast data processing, leading to an improved and enhanced client-customer relationship.
- Improved data security – along with restricting user access to the database server, the computerized information system facilitates other security measures, including access right controls, user’s authentication, biometric authentication systems and more.
As a matter of fact, DexLab Analytics is a budding MIS training institute in Gurgaon – it helps professionals and newbies to maintain and revamp the existing MIS within an organization. If interested, you can also hone your advanced Excel skills with Excel training courses in Delhi offered by the same.
The blog has been sourced from – learning.naukri.com/articles/top-mis-executive-interview-questions-answers
Interested in a career in Data Analyst?
To learn more about Data Analyst with Advanced excel course – Enrol Now.
To learn more about Data Analyst with R Course – Enrol Now.
To learn more about Big Data Course – Enrol Now.To learn more about Machine Learning Using Python and Spark – Enrol Now.
To learn more about Data Analyst with SAS Course – Enrol Now.
To learn more about Data Analyst with Apache Spark Course – Enrol Now.
To learn more about Data Analyst with Market Risk Analytics and Modelling Course – Enrol Now.