Excel dashboards training Archives - DexLab Analytics | Big Data Hadoop SAS R Analytics Predictive Modeling & Excel VBA

G-Suite and Office 365: A Comparison of Spreadsheets for Your Business Needs

G-Suite and Office 365: A Comparison of Spreadsheets for Your Business Needs

When Google introduced its G-Suite in 2006, Microsoft Office was a world leader with virtually no competition. Over time, however, Google Suite (initially known as Google Docs and Spreadsheets) has managed to draw a loyal user base despite its subscription fee. Faced with this new challenge, Microsoft went ahead and introduced in the market what it calls Office 365, a subscription based version of its Office, which is regularly updated with new features.

Common features

G-Suite and Office 365 have many features and aspects in common. For instance, both work offline and both offer apps for the Android and iOS versions. The suites offer the same core and basic utilities. They have word processing, spreadsheet, presentation, email, calendar, contacts, video conferencing, and programs like messaging, note-taking software among others. The two suites also have cloud storage though these are different from each other by virtue of the tools used to manage them.

When thinking about which suite to use for your business needs, compare the prices of the two. But before that, it is important that you know that you can use several online apps from the two suites – like Google Docs, Sheets and Slides as well as Microsoft Word Online, Excel Online and Powerpoint Online. In India, Microsoft is still a little more popular and it is not surprising that institutes aiming at excellence in computing like DexLab Analytics prefer to have a separate course on excel certification in gurgaon.

Cost and Word Processors

The G-Suite comes in three ranges – Basic, Business and Enterprise with the prices starting from $6 to $25 per month. Office 365 is a little expensive, its cost ranging from $5 to $35 per month. When it comes to their word processing software, Google Docs is better for collaboration while Word has numerous editing features and templates to offer.

Spreadsheets and Presentations

When it comes to Google Sheets against Microsoft Excel, again, collaboration becomes the bellwether. If users are prone to working on spreadsheets by themselves without collaborating with others, then Microsoft Excel is the application for you. But if you are going to collaborate with fellow workers, then Google Sheets is the option for you. Similarly, collaboration is easier on Google Sheets than it is on Powerpoint but for every other reason, be they charts or slide layouts, Powerpoint is the winner.

Email

If you prefer simplicity over clutter, then Gmail is your go-to mail service. Gmail has succeeded in cutting the clutter and offers this really fast and streamlined mail service. However, Microsoft Outlook is also trying to be as straightforward as possible. It can be anything, composing a mail to managing it and responding to it, Gmail has a system which is intuitive and understands user response. When it comes to the Microsoft Outlook, power features like the Focused Inbox are a great draw. Focused Inbox helps prioritize important mails and enables you to read them and respond to them first.

Data Science Machine Learning Certification

And, “because the contacts and calendar functions are part of Outlook itself, they’re well integrated with email. Gmail relies on the separate Google Contacts and Calendar apps, which can be a bit more cumbersome to navigate”, says a handy report on the comparison of the two suites.


Interested in a career in Data Analyst?

To learn more about Data Analyst with Advanced excel course – Enrol Now.
To learn more about Data Analyst with R Course – Enrol Now.
To learn more about Big Data Course – Enrol Now.

To learn more about Machine Learning Using Python and Spark – Enrol Now.
To learn more about Data Analyst with SAS Course – Enrol Now.
To learn more about Data Analyst with Apache Spark Course – Enrol Now.
To learn more about Data Analyst with Market Risk Analytics and Modelling Course – Enrol Now.

Most Popular MS Excel Shortcuts That Would Save Time, Money and Effort

Most Popular MS Excel Shortcuts That Would Save Time, Money and Effort

Marketers look up to MS Excel every day. The reason can be anything – from creating charts to data analysis to structure a report for the upcoming presentation.

But, of course, working on Excel can be too time-consuming. Don’t you think it would be great if you could labor less formatting and entering gibberish formulas in the desktop or laptop?! Wouldn’t it be helpful if there were some keyboard shortcuts that could make the task easier and faster?!

Woah! Glad you did ask!

Fortunately, we’ve shortlisted a list of most common and widely used keyboard shortcuts for Microsoft Excel. No wonder, you can do all the navigation manually, but these hacks will save a lot of time as well effort, leaving you to focus only on the important stuffs.


To view our whole compilation of MS Excel shortcuts, click here


Or, another more profound way to fill in excellent MS Excel skills and expertise is through an advanced Excel course in Gurgaon. Encompassing courses like this helps students arm up with advanced skills and take the world in their stride. So, when are you enrolling?

Till then, pore over the list below. These simple yet effective shortcuts does help chop off time, enhance productivity and maneuver swiftly through workbooks, rows, sheets and columns:

Shortcuts play a significant role in every marketer’s or analyst’s life. Since its launch in 1985, MS Excel shortcuts have been helping users across the globe – they help analyze data quickly and efficiently. Undoubtedly, Excel spreadsheet is one of the top notch computer applications that helps store, manage and analyze data in tabular form for easy evaluation and scrutiny.

To know more about Excel that too in depth, look for an advanced excel VBA institute in Gurgaon. DexLab Analytics can come to your rescue. In the heart of India, specifically in the capital city, Delhi, DexLab Analytics with a core team of industry professionals offers state of the art data analytics training. The institute excels in numerous in-demand skill training, including training on Big Data Hadoop, PySpark, Python, R Programming, Business Analytics, Business Intelligence, SQL, VBA Macros, Ms Dashboards, Data Science, Machine Learning, Deep Learning, Data Visualization using Tableau and Excel. Drop by the site for more details.


The blog has been sourced from ― blog.hubspot.com/marketing/excel-shortcuts


Interested in a career in Data Analyst?

To learn more about Data Analyst with Advanced excel course – Enrol Now.
To learn more about Data Analyst with R Course – Enrol Now.
To learn more about Big Data Course – Enrol Now.

To learn more about Machine Learning Using Python and Spark – Enrol Now.
To learn more about Data Analyst with SAS Course – Enrol Now.
To learn more about Data Analyst with Apache Spark Course – Enrol Now.
To learn more about Data Analyst with Market Risk Analytics and Modelling Course – Enrol Now.

How Much Excel Excels in Deriving Rich ‘Insights’ from Your Data

For millions, Excel is the ultimate tool to understand data and frame insights. It makes analysis easy as pie and intuitive for all. Those who are well acquainted with Excel might know about Insights – it is the newest artificial intelligence-backed capability that rolled out in preview to Office Insiders last month.

How Much Excel Excels in Deriving Rich ‘Insights’ from Your Data

A quick note on Insights

Insights is a brand new service used to highlight patterns it identifies from your data, aiding you discover and inspect new insights, like outliers, trends and several other relevant visualizations and analyses. It will take special care to find out intriguing trends in your data and offer concise summaries with charts and PivotTables. As it’s powered by machine learning, the capability to churn out advanced analysis tends to increase as usage grows.

Continue reading “How Much Excel Excels in Deriving Rich ‘Insights’ from Your Data”

The Boons of Technology: How Excel Has Changed Workplace Dynamics

Microsoft Excel is a smorgasbord of information – it is a staple technology tool in any business environment. Whether you are crunching business data, organizing client sales inventory or planning an office event, Excel is arguably the most powerful tool entrenched across multiple business domains worldwide.

 
The Boons of Technology: How Excel Has Changed Workplace Dynamics
 

Aspiring professionals contemplating to make an entry into the workplace are required to excel on Excel tricks – Excel Dashboards Training Pune from DexLab Analytics is a promising gateway to your dreams!

Continue reading “The Boons of Technology: How Excel Has Changed Workplace Dynamics”

Microsoft Excel or Google Sheets: Which is better for Business?

Getting all work done from inside a browser through an internet-enable computer is no mean feat. Just after Google cracked the idea, Microsoft and Apple soon followed the bandwagon and developed online office suites of their own.


Microsoft Excel or Google Sheets: Which is better for Business?


So, do you think Google deserves the tag of top dog or should you give accolades to Microsoft for developing a feature-rich office suite?

Continue reading “Microsoft Excel or Google Sheets: Which is better for Business?”

Interesting Things to Do With Microsoft Excel

MS Excel Online training in Delhi

Microsoft Excel, whenever you hear this term, you visualise calculations, graphs, tables, formulas and what not – stuffs normally used to arrange and analyse data making pie charts, and countless related gimmicks.

Gaining proficiency in this specific software appears to be a common matter of concern for aspiring professionals from whatever field, they belongs to – and not just the ones who hail from a finance, accounts or IT background.

But do you know that MS Excel can be used for other interesting stuffs, apart from regular work-related things, like gaming and art? I guess not.

Leaf through a set of amazing projects completed with Microsoft Excel, which will surely knock you off your feet. So, are you ready?

Digital Art

Digital Art with MS Excel? Are you kidding me? No, I’m not. A 73-year old Japanese Tatsuo Horiuchi will change your entire perception. He practised digital art using MS Excel spreadsheet, why, because he found other graphics software to be quite expensive. He used the ‘autoshape’ feature of Excel to create stunning works of art. Fascinating, right?

excel-art

Sudoku

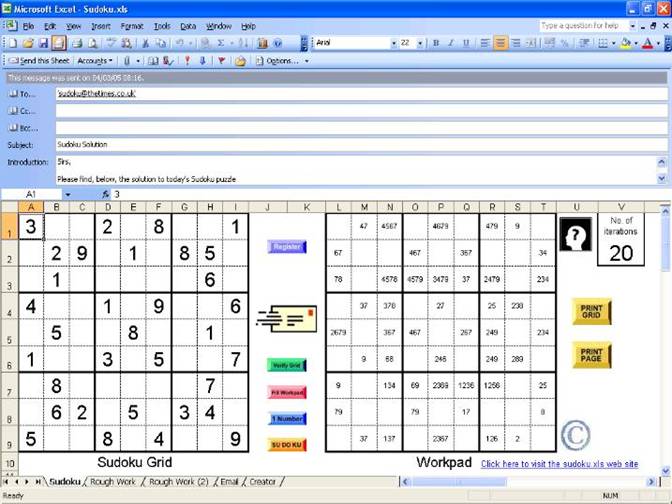
Did you finish solving the Sudoku puzzle in the newspaper? You want more? Fortunately, Microsoft is here to help you out! Download an Excel file and use it to create a never-ending stream of Sudoku puzzles and go on teasing your brain cells by solving the puzzle, till you get worn out.

MS-Excel-online-training

Re-inventing legendary games

Work hard, party harder! Excel totally buys the thought. By using Microsoft Excel, you can recreate the stellar games, like Monopoly, Pacman, Tetris and lot more. Of late, latest games like Candy Crush and 2048 have their own versions in Excel format, and that definitely calls for celebration!

pacell

Stop-motion animation

Animations and music video are two sides of the same coin. For years, it has been a popular medium. While A-ha’s “Take on Me” revolutionised the digital world 30 years back, Joe Penna, also known as Mystery Guitar Man on YouTube has taken the world by storm today, thanks to its stop-motion animation music video created using Excel spreadsheets.

He filmed himself performing the song “Cuban Pete”, broke down the video into 730 separate frames and then used each frame to develop a spreadsheet mosaic. The rest simply fell into place!

Advanced excel training

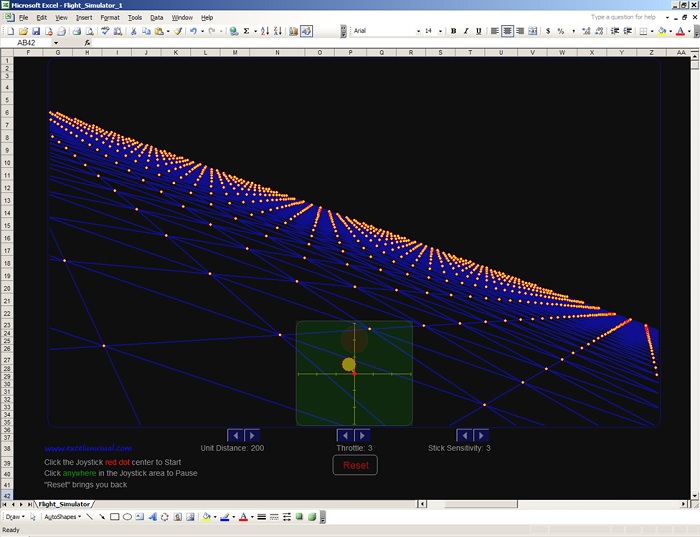
A working flight simulator

Scroll your thoughts to 1997, flight simulators came in from there. With the simulators, you can manoeuvre your environment as your mouse converts into the airplane control – move it back and forth or sideways and keep rolling.

No doubt, it became a favourite pastime for thousands of employees across the globe, including yours truly.

Excel dashboards training

Transport columns into rows

Mistakenly did you put data in columns, instead of rows or vice versa? Relax Microsoft has got you covered. There is a shortcut to fix the mistake. Just copy the row or column you need to interchange, right click on the cell you want to put it on and select Paste Special. A popup window named Transpose will appear. Check the box and click OK. That’s all you have to do. Easy, isn’t it?

Seeking Microsoft excel certification training online, DexLab Analytics is here! Check out our comprehensive MS Excel Online training in Delhi courses and hone your excel skills.


Interested in a career in Data Analyst?

To learn more about Machine Learning Using Python and Spark – click here.
To learn more about Data Analyst with Advanced excel course – click here.
To learn more about Data Analyst with SAS Course – click here.
To learn more about Data Analyst with R Course – click here.
To learn more about Big Data Course – click here.

Learn To Use The AND Function in Excel WS

In this Excel tutorial, we at DexLab Analytics will dig a little deeper with our Excel knowledge and explain how to use the Excel AND function with proper examples, and syntax use.

 
Learn To Use The AND Function in Excel WS

What is the AND function?

The MS Excel AND function works to return TRUE if all the conditions are true. And it returns FALSE if any of the conditions are false. The AND function is an internal function in Excel that is categorized as a Logical Function. It can be utilised as a Work Sheet (WS) function in Excel. Moreover, as a worksheet function, the AND function may as well be included as a part of a formula in a normal excel cell of a worksheet.

Continue reading “Learn To Use The AND Function in Excel WS”

Ms Excel VBA May Be Used To Predict Sales

banner 11

MS Excel VBA has uses in various facets of day to day activities of businesses. But it is a little known factthat this tool may also be used to carry out advanced functions like predicting future sales. This blogpost will try to represent in as an illustrative way as possible how it manages to do the same with thelimitations imposed by the format of this text based post.Suppose we have sales data of two sets for 24 periods within the time range of January 2013 to the December of 2014.

What we are trying to do is to utilize the function LINEST in order to predict sales for the year 2015 by making use of method of least squares as well as regression analysis. The elementary knowledge of this function suggests that it is worth sharing. In the lines that follow we will try to examine the rudiments of this function and the formula that we will put into use in the calculations we make.

The use of the LINEST function lies in regression analysis in order to make calculations about a line that uses the least squares method and return a straight line that is best fitted to the data that you input and outputs an array that serves as a description of the particular line.


The equation that represents the line is: y = mx + b


Here m stands for the slope, x represents the period of time dealt with the data and b is the y intercept.It is to be noted that there is necessity of having a column that indicates the period number of the existing as well as future sales. It should also be noted that while you use the LINEST function so that you may calculate the values of the Y- Intercept along with that of the slope those cells need to reside side by side.

So, what one has to do is to highlight the two cells that you want to use in order to make calculations of the Y-Intercept and the Slope before typing in the LINEST function. In such cases all that is needed is to include the “y”s that are already known. It is up to you whether you want to provide other arguments as they are optional. Then all you need to do is press Ctrl+Shift+Enter and you get the Y-Intercept and the Slope.

The magic that takes place in the background is basically this, by making use of the Slope and the Y-Intercept Excel does its crystal ball gazing and takes the last sales data of the precious 24 months and creates a straight-line that forecasts the trend that is likely to persist in the coming 12 months.

2

What Excel actually does is that it takes the actual values and manipulates them slightly to that is able to come up with a straight-line that serves as the trend line that extends out to the periods of forecast and thus the actual values and the values of the forecast have trends that are similar.This is the basics of crystal ball gazing through the use of MS Excel.


Want to shine bright in MS Excel? Visit DexLab Analytics – their Advanced Excel course is truly remarkable. Enrol for Advanced Excel training today.


Interested in a career in Data Analyst?

To learn more about Machine Learning Using Python and Spark – click here.
To learn more about Data Analyst with Advanced excel course – click here.
To learn more about Data Analyst with SAS Course – click here.
To learn more about Data Analyst with R Course – click here.
To learn more about Big Data Course – click here.

Call us to know more