deep learning for computer vision with python Archives - Page 3 of 3 - DexLab Analytics | Big Data Hadoop SAS R Analytics Predictive Modeling & Excel VBA

Most Demanding Programming Languages for Machine Learning: A Knowhow

Most Demanding Programming Languages for Machine Learning: A Knowhow

Machine Learning is among a handful of technologies which we can see going on for long. It is a process or a technology which applies Artificial Intelligence (AI) to enable the machines/computers to learn things all by them and continue improving them subsequently.

Andrew Ng, a computer scientist from Stanford University, describes Machine Learning as the science which helps the computers to act without any explicit programming.

2

This new stream, as we are seeing it now, was originally conceived in the 1950s, however, it was not until the 21st century that Machine Learning started to revolutionise the world.

Several industries have already adopted this ground-breaking technology successfully to ensure the growth of their business. Moreover, this new technology has also boosted the demand for advanced programming languages, which were only rarely pursued earlier.

Here are some of the programming languages which seem quite promising with the rise of Machine Learning:

Python

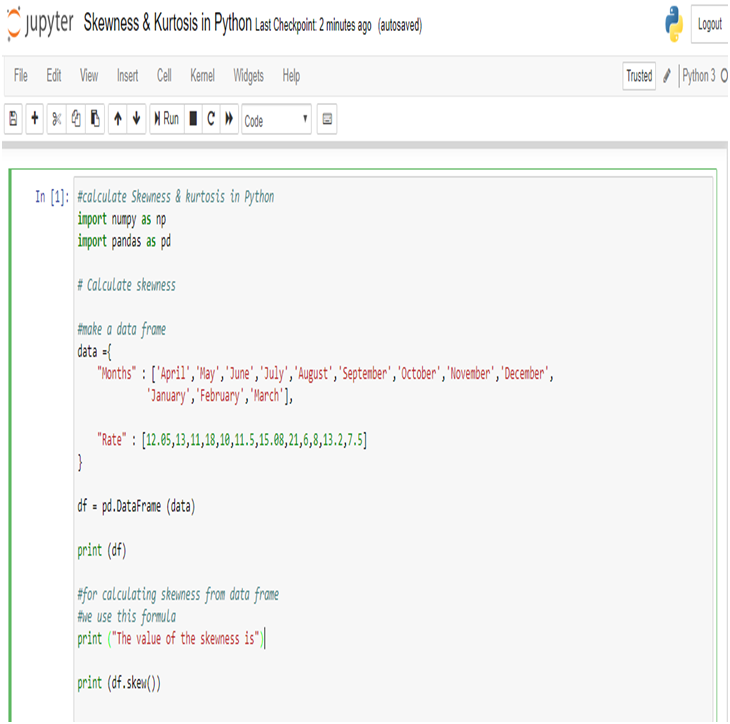
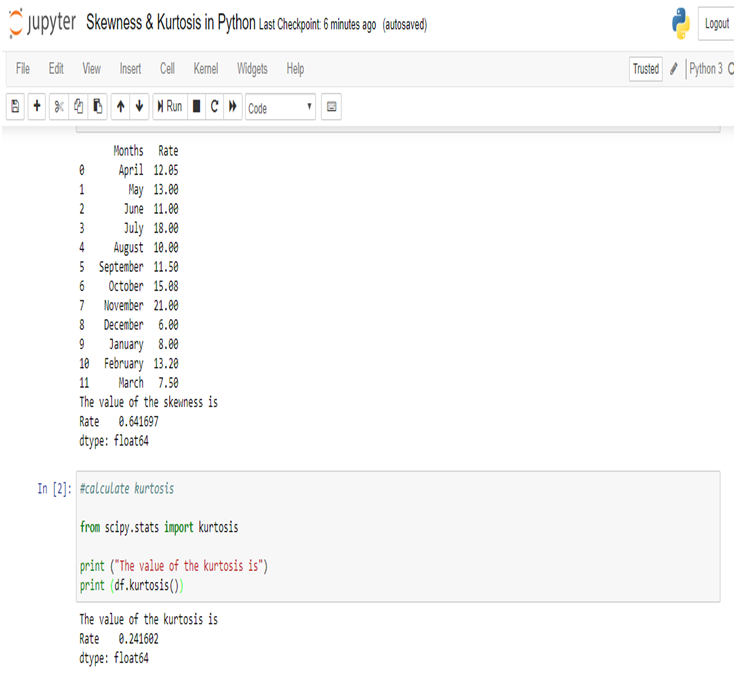
This high-level programming language dates back to the early 1990s and has been widely popular since then, for Data Science, back-end development and Deep Learning for computer vision with Python. Python for data analysis is regarded as a powerful tool and is actively used in Big Data Technology.

R

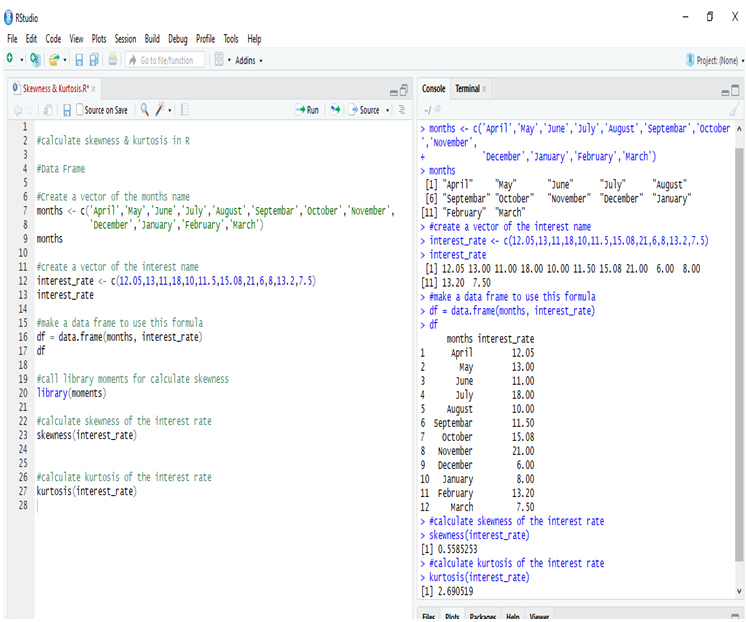
R has been developed in the 1990s along with Python and was a part of the GNU project. Ever since it was discovered, R finds its uses extensively in Data Analysis, Machine Learning and the development of Artificial Intelligence. Furthermore, R is revered by the world of statisticians. 

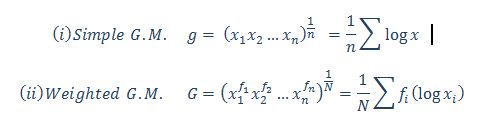
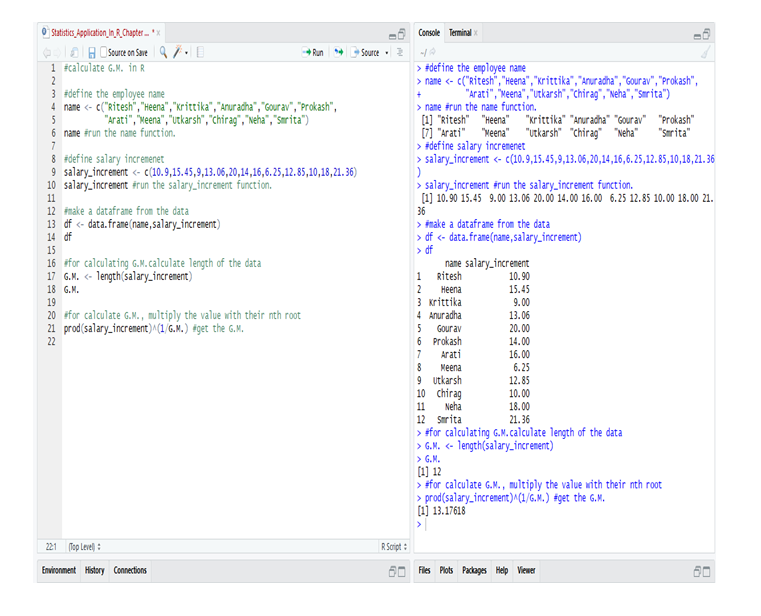
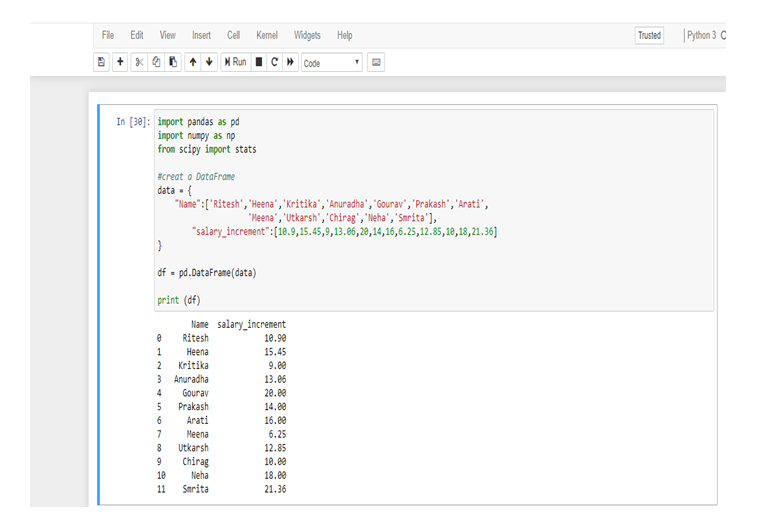
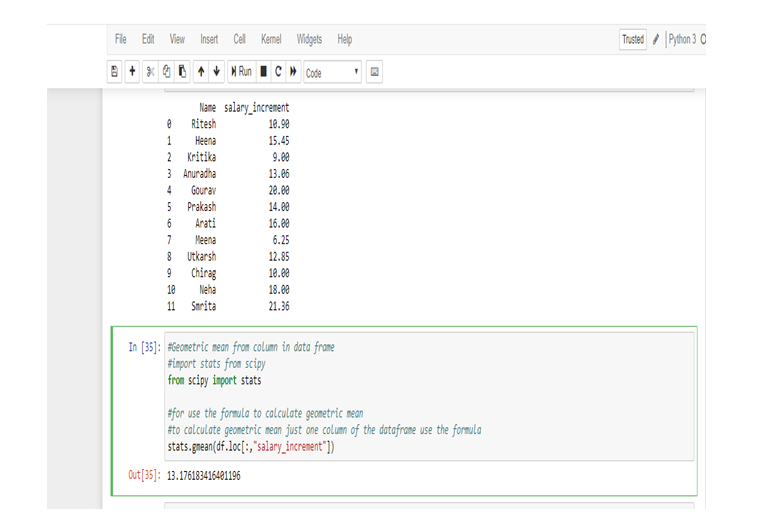
Application to R and Python are effectively used to calculate the Arithmetic mean, Harmonic mean, Geometric Mean, Skewness & Kurtosis. Statistical Application Of R & Python: Know Skewness & Kurtosis And Calculate It Effortlessly shows you the way how.

Deep Learning and AI using Python

JavaScript, C++, Java are some other notable programming languages that are dominant. So, hurry up and join the exclusive computer vision course Python now. With Dexlab Analytics, a formidable institute in the Big Data Analytics industry, you can enroll for our tailor-made Artificial Intelligence course in Delhi with just a click from the comfort of your house.


Interested in a career in Data Analyst?

To learn more about Data Analyst with Advanced excel course – Enrol Now.
To learn more about Data Analyst with R Course – Enrol Now.
To learn more about Big Data Course – Enrol Now.

To learn more about Machine Learning Using Python and Spark – Enrol Now.
To learn more about Data Analyst with SAS Course – Enrol Now.
To learn more about Data Analyst with Apache Spark Course – Enrol Now.
To learn more about Data Analyst with Market Risk Analytics and Modelling Course – Enrol Now.

Statistical Application of R & Python: Know Skewness & Kurtosis and Calculate it Effortlessly

Statistical Application of R & Python: Know Skewness & Kurtosis and Calculate it Effortlessly

This is a blog which shall widen your approach on the Statistical Application using R & Python. You perhaps already have been calculating Geometric Mean using R & Python and are already aware of the Application of Harmonic Mean using R & Python. However, if you are eager to further your knowledge about Skewness & Kurtosis and interested to know of their application using R and Python, then this is the right place.

Skewness:

Skewness is a metric which tells us about the location of my dataset. That is, if you want to know where most of the values are concentrated on an ascending scale.

Skewness is of two kinds: Positive skew and Negative skew. A positively skewed dataset will have most of the values concentrated at the beginning of the scale. Eg: If a woman is asked to rate 100 tinder profiles based on the looks on a scale of 1 – 10, 1 being the ugliest and 10 being the most handsome. Then the resulting ratings will be positively skewed. This is to say that women are harsh critiques of looks.

Now, consider another example: Say if the wealth of the 1% richest people were to be plotted on a scale of say $0 – $200 billion. Then, most of the values will be concentrated at the end of the scale. This will be an example of a negatively skewed dataset.

In essence, skewness is the third central moment about mean and gives us a feel for the location of the data set values. It is recommended to go through STATISTICAL APPLICATION IN R & PYTHON: CHAPTER 1 – MEASURE OF CENTRAL TENDENCY to have an understanding of the Central Tendency and its measures. Having no skewness will mean the data set is fairly symmetrical and has a bell shaped curve.

Where n is the sample size, Xi is the ith X value, X is the average and S is the sample standard deviation.  Note the exponent in the summation.  It is “3”.

Kurtosis:

Kurtosis is a statistical measure that’s used to describe, or Skewness, of observed data around the mean, sometimes referred to as the volatility to volatility. Kurtosis is used generally in the statistical field to describe trends in charts. Kurtosis can be present in a chart with fat tails and a low, even distribution, as well as be present in a chart with skinny tails and a distribution concentrated toward the mean.

Kurtosis for a normal distribution is 3.  Most software packages use the formula:


The types of kurtosis are:-


Application:

A person tries to analyze last 12months interest rate of the investment firm to understand the risk factor for the future investment.

The interest rates are:

12.05%, 13%, 11%, 18%, 10%, 11.5%, 15.08%, 21%, 6%, 8%, 13.2%, 7.5%.

Here is the table:

Months

(One Year)

Interest

Rate (%)

April12.05
May13
June11
July18
August10
September11.5
October15.08
November21
December6
January8
February13.2
March7.5


Calculate skewness & Kurtosis in R:

Calculate skewness & Kurtosis in R:
Calculating the Skewness & Kurtosis of interest rate in R, we get the positive skewed value, which is near to 0. The skewness of the interest rate is 0.5585253.

The kurtosis of the interest rate is 2.690519

Kurtosis is less than 3, so this is Platykurtic distribution.

Calculate Skewness & Kurtosis in Python:

Calculate Skewness & Kurtosis in Python:
Calculating the Skewness & Kurtosis of interest rate in Python, we get the positive skewed value and near from 0. The skewness of the interest rate is 0.641697.

The kurtosis of the interest rate is 0.241602.

Kurtosis is less than 3, so this is Platykurtic distribution.

Conclusion:

Firstly, according to the output of the data the value is positively skewed(R & Python), positive skewness indicates a distribution with an asymmetric tail extending toward more positive values.

And the kurtosis is less than 3 (R & Python), it is a platykurtic distribution. Positive kurtosis indicates a relatively peaked distribution. And the distribution is light tails.

Secondly, the value of the skewness and kurtosis are different in R and Python, but the actual effects are more or less the same. The results are different because skewness and kurtosis are calculated with different formulae or method for the measurement like Bowley’s measure, Pearson’s(First, Second) measures, Fisher’s measure & Moment’s measure. And different software (ex. R, Python, SAS, Excel etc) using different processes to calculate skewness & kurtosis brings the same ultimate result. The numerical values change only when the numbers are also changed. So, we sometimes get different results.

2

There are numerous other blogs that you can follow with Dexlab Analytics. Also, if you want to explore computer vision course Python, neural network machine learning Python and more extensive courses on R & Python, then you can also join us and boost both your passion and career.


Interested in a career in Data Analyst?

To learn more about Data Analyst with Advanced excel course – Enrol Now.
To learn more about Data Analyst with R Course – Enrol Now.
To learn more about Big Data Course – Enrol Now.

To learn more about Machine Learning Using Python and Spark – Enrol Now.
To learn more about Data Analyst with SAS Course – Enrol Now.
To learn more about Data Analyst with Apache Spark Course – Enrol Now.
To learn more about Data Analyst with Market Risk Analytics and Modelling Course – Enrol Now.

A Deeper Understanding of Deep Learning

A Deeper Understanding of Deep Learning

To define Deep Learning, it can be summed up as a machine learning technique used to teach computers all those things which comes to humans quite instinctively. This is a sub-classification of the umbrella term Machine Learning and is based on artificial neural networks.

The technology of driver-less cars, of computers with the knowledge of lampposts and trees as non-living entities and with their discretion of differentiating between a pedestrian and a lamppost, all are being developed from Deep Learning. Besides, the voice assistant you find nowadays, that comes with the smartphones, tablets, TVs and hands-free electronic gadgets, everything is matured by Deep Learning.

Deep Learning is an immensely effective technique with huge prospective. Thus, Deep Learning is a highly regarded technology and more and more people are looking forward to finding their career in it.

2

Deep Learning: The Path of Success

Among the ever-changing technologies, Deep Learning has its path paved to stand strong in the long run. Now, this is possible primarily because of the high accuracy levels that it has reached.

Pin-pointed Accuracy

With the convincing accuracy levels reached, Deep Learning is believed to be steadfast in situations which involves high risks and which calls for the least margin of errors. For example – driver-less cars.

Extensive Library

If you aim Deep Learning for computer vision with Python, you should be ready with enormous information that it can go through and process quite effortlessly, hence, putting forth an all-inclusive library to be used in real-time. For instance, millions of images, days of video and data should be fed to the system going forward to develop the technology of the driverless car.

Powerful Computing

If we talk about the power that Deep Learning needs, it is astonishingly unreal, the amount of power that this technology expects to perform in its optimum. None other than immensely powerful GPUs are used to get the best results.

As Deep Learning is quite a new thing, unknown in most of its dimensions, here are a few of the fields which have already absorbed or are trying to infuse Deep Learning in constructively.

  • Automobiles – As we have already mentioned that the automobile industry has already taken Deep Learning quite seriously and is effective moving in the direction, where, soon we would witness cars without any human drivers.
  • Defence and Aerospace – Deep learning is constantly taken into account when determining the objects that the satellites bring us. Via Deep Learning we can be sure of the areas/objects in the space. Furthermore, whether a particular zone is fit for the soldiers or not, can also be easily determined by Deep Learning.
  • Pharmacy – Deep Learning is highly significant even in modern medical science. For example, this technology is used to detect cancerous cells.

Deep Learning and AI using Python

With these being said, Deep Learning is simply superb in how it has performed still and the promise that it is showing to be on par with the age. Therefore, if you are seeking for the Deep learning for computer vision course, you can simply avail of Deep Learning for computer vision Training Center in Delhi NCR.


Interested in a career in Data Analyst?

To learn more about Data Analyst with Advanced excel course – Enrol Now.
To learn more about Data Analyst with R Course – Enrol Now.
To learn more about Big Data Course – Enrol Now.

To learn more about Machine Learning Using Python and Spark – Enrol Now.
To learn more about Data Analyst with SAS Course – Enrol Now.
To learn more about Data Analyst with Apache Spark Course – Enrol Now.
To learn more about Data Analyst with Market Risk Analytics and Modelling Course – Enrol Now.

Calculating Geometric Mean Using R and Python

Calculating Geometric Mean Using R and Python

In this blog, we are going to discuss the Geometric Mean and its application using Python and R.

Geometric Mean of group of ‘n’ observations is the nth root of their product. It is defined only when all observations have the same sign and none of them is zero.

Application:

Calculate the Geometric Mean of the salary increment of 12 employees. From the following table, calculate the average salary increment of the year (2019-2020):-


Name

Salary Increment in

Percentage (%)

Ritesh

10.09%

Heena

15.45%

Kritika

9%

Anuradha

13.06%

Gaurav

20%

Prakash

14%

Aarti

16%

Meena

6.25%

Utkarsh

12.85%

Chirag

10%

Neha

18%

Smrita

21.36%


Calculate the Geometric Mean in R:

So, from the data of the employee’s in R we calculate the G.M. and get that the average salary increment in the year (2019-2020) = 13.17618 or 13.18% (approx).

Calculate the Geometric Mean in Python:

First, make a data frame in Python from the following table.

Now, calculate the Geometric Mean from the data-frame.

So, from the data of the employee’s in Python we calculate the G.M. and get that the average salary increment in the year (2019-2020) = 13.176183416401196 or 13.18% (approx).

We use Geometric Mean for calculating ratios, rates and percentages. And it is not affected by the extreme value or outlier. In this particular problem, we use Geometric Mean because an average of the salary increment of the employee’s not affected by the extreme highest or extreme lowest value, that’s why the salary increment rates of Meena and Smrita do not have any effect on the total average rate.

Geometric Mean gives small value than Arithmetic Mean.

2

Note: This is a continuation of the blog: Statistical Application in R & Python: Chapter 1 – Measure of Central Tendency. It would be better to go through the first installment and then read this one. More blogs are to be followed, so stay tuned.

DexLab Analytics is a premier Python training institute in Delhi. Our industry-relevant courses are carefully crafted by experts. Follow us on Facebook and Instagram.


Interested in a career in Data Analyst?

To learn more about Data Analyst with Advanced excel course – Enrol Now.
To learn more about Data Analyst with R Course – Enrol Now.
To learn more about Big Data Course – Enrol Now.

To learn more about Machine Learning Using Python and Spark – Enrol Now.
To learn more about Data Analyst with SAS Course – Enrol Now.
To learn more about Data Analyst with Apache Spark Course – Enrol Now.
To learn more about Data Analyst with Market Risk Analytics and Modelling Course – Enrol Now.

Call us to know more