deep learning for computer vision with python Archives - Page 2 of 3 - DexLab Analytics | Big Data Hadoop SAS R Analytics Predictive Modeling & Excel VBA

Python Statistics Fundamentals: How to Describe Your Data? (Part II)

Python Statistics Fundamentals: How to Describe Your Data? (Part II)

In the first part of this article, we have seen how to describe and summarize datasets and how to calculate types of measures in descriptive statistics in Python. It’s possible to get descriptive statistics with pure Python code, but that’s rarely necessary.

Python is an advanced programming language extensively used in all of the latest technologies of Data Science, Deep Learning and Machine learning. Furthermore, it is particularly responsible for the growth of the Machine Learning course in IndiaMoreover, numerous courses like Deep Learning for Computer vision with Python, Text Mining with Python course and Retail Analytics using Python are pacing up with the call of the age. You must also be in line with the cutting-edge technologies by enrolling with the best Python training institute in Delhi now, not to regret it later.

In this part, we will see the Python statistics libraries which are comprehensive, popular, and widely used especially for this purpose. These libraries give users the necessary functionality when crunching data. Below are the major Python libraries that are used for working with data.

Data Science Machine Learning Certification

NumPy and SciPy – Fundamental Scientific Computing

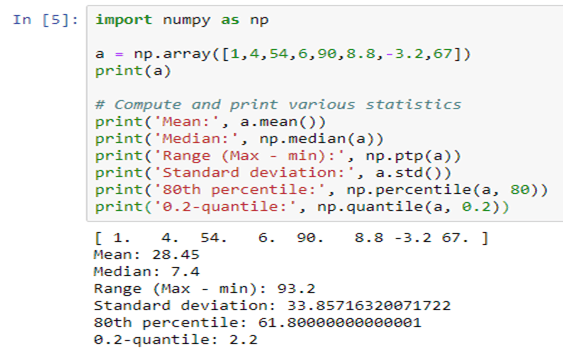
NumPy stands for Numerical Python. The most powerful feature of NumPy is the n-dimensional array. This library also contains basic linear algebra functions, Fourier transforms, advanced random number capabilities. NumPy is much faster than the native Python code due to the vectorized implementation of its methods and the fact that many of its core routines are written in C (based on the CPython framework).

For example, let’s create a NumPy array and compute basic descriptive statistics like mean, median, standard deviation, quantiles, etc.

SciPy stands for Scientific Python, which is built on NumPy. NumPy arrays are used as the basic data structure by SciPy.

Scipy is one of the most useful libraries for a variety of high-level science and engineering modules like discrete Fourier transforms, Linear Algebra, Optimization and Sparse matrices. Specifically in statistical modelling, SciPy boasts of a large collection of fast, powerful, and flexible methods and classes. It can run popular statistical tests such as t-test, chi-square, Kolmogorov-Smirnov, Mann-Whitney rank test, Wilcoxon rank-sum, etc. It can also perform correlation computations, such as Pearson’s coefficient, ANOVA, Theil-Sen estimation, etc.

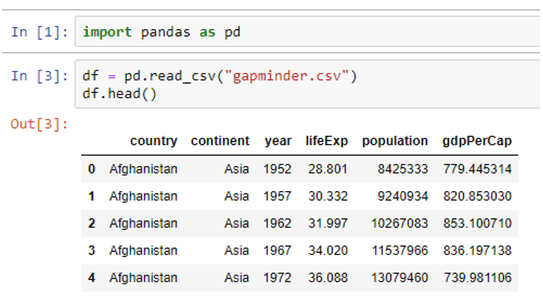
Pandas – Data Manipulation and Analysis

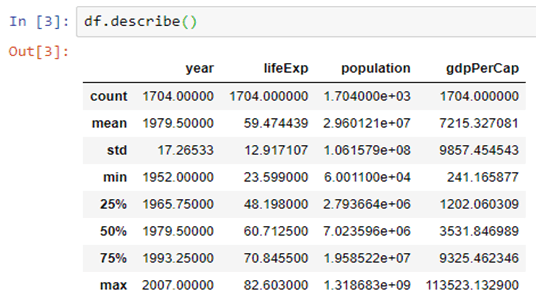
Pandas library is used for structured data operations and manipulations. It is extensively used for data preparation. The DataFrame() function in Pandas takes a list of values and outputs them in a table. Seeing data enumerated in a table gives a visual description of a data set and allows for the formulation of research questions on the data.

The describe() function outputs various descriptive statistics values, except for the variance. The variance is calculated using the var() function in Pandas.

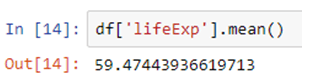
The mean() function, returns the mean of the values for the requested axis.

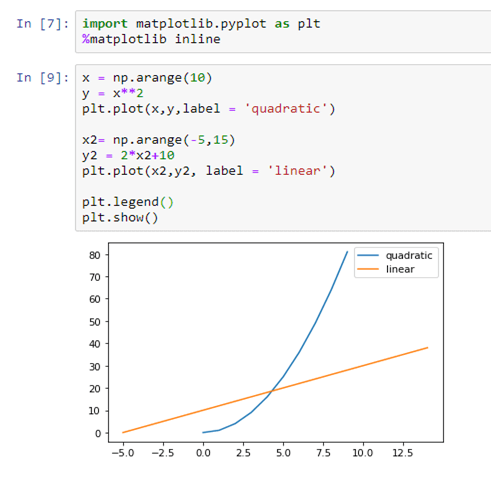
Matplotlib – Plotting and Visualization

Matplotlib is a Python library for creating 2D plots. It is used for plotting a wide variety of graphs, starting from histograms to line plots to heat plots. One can use Pylab feature in IPython notebook (IPython notebook –pylab = inline) to use these plotting features inline. If the inline option is ignored, then pylab converts IPython environment to an environment, very similar to Matlab.

matplotlib.pylot is a collection of command style functions.

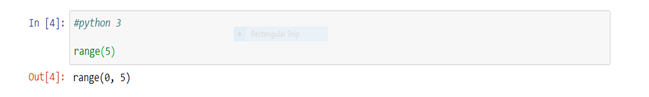
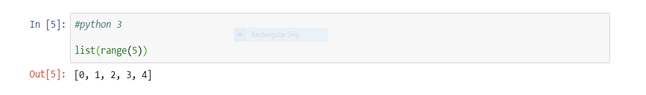
If a single list array is provided to the plot() command, matplotlib assumes it is a sequence of Y values and internally generates the X value for you.

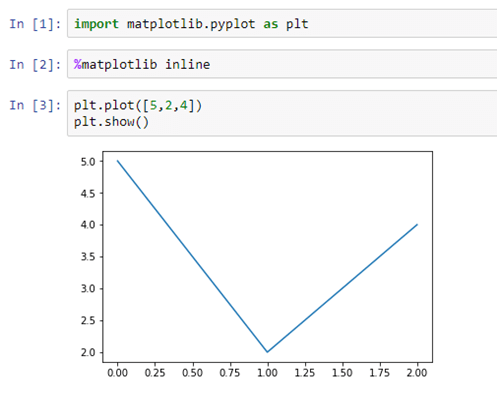
Each function makes some change to a figure, like creating a figure, creating a plotting area in a figure, decorating the plot with labels, etc. Now, let us create a very simple plot for some given data, as shown below:

Scikit-learn – Machine Learning and Data Mining

Scikit-learn built on NumPy, SciPy and matplotlib. Scikit-learn is the most widely used Python library for classical machine learning. But, it is necessary to include it in the discussion of statistical modeling as many classical machine learning (i.e. non-deep learning) algorithms can be classified as statistical learning techniques. This library contains a lot of efficient tools for machine learning and statistical modeling including classification, regression, clustering and dimensional reduction.

Conclusion

In this article, we covered a set of Python open-source libraries that form the foundation of statistical modelling, analysis, and visualization. On the data side, these libraries work seamlessly with the other data analytics and data engineering platforms, such as Pandas and Spark (through PySpark). For advanced machine learning tasks (e.g. deep learning), NumPy knowledge is directly transferable and applicable in popular packages such as TensorFlow and PyTorch. On the visual side, libraries like Matplotlib, integrate nicely with advanced dashboarding libraries like Bokeh and Plotly.


https://pandas.pydata.org/pandas-docs/stable/reference/api/pandas.DataFrame.html


Interested in a career in Data Analyst?

To learn more about Data Analyst with Advanced excel course – Enrol Now.
To learn more about Data Analyst with R Course – Enrol Now.
To learn more about Big Data Course – Enrol Now.

To learn more about Machine Learning Using Python and Spark – Enrol Now.
To learn more about Data Analyst with SAS Course – Enrol Now.
To learn more about Data Analyst with Apache Spark Course – Enrol Now.
To learn more about Data Analyst with Market Risk Analytics and Modelling Course – Enrol Now.

Statistical Application in R & Python: Negative Binomial Distribution

Statistical Application in R & Python: Negative Binomial Distribution

Negative binomial distribution is a special case of Binomial distribution. If you haven’t checked the Exponential Distribution, then read through the Statistical Application in R & Python: EXPONENTIAL DISTRIBUTION.

It is important to know that the Negative Binomial distribution could be of two different types, i.e. – Type 1 and Type 2. In many ways, it could be seen as a generalization of the geometric distribution. The Negative Binomial Distribution essentially operates on the same principals as the binomial distribution but the objective of the former is to model for the success of an event happening in “n” number of trials. Here it is worth observing that the Geometric distribution models for the first success whereas a Negative Binomial distribution models for the Kth 

Data Science Machine Learning Certification

This is explained below.

Type 1 Binomial distribution  aims to model the trails up to and including the “kth success” in “n number of trials”. To give a simple example, imagine you are asked to predict the probability that the fourth person to hear a gossip will believe that! This kind of prediction could be made using the negative binomial type 1 distribution. 

Conversely, Type 2 Binomial distribution is used to model the number of failures before the “kth success”. To give an example, imagine you are asked about how many penalty kicks it will take before a goal is scored by a particular football player. This could be modeled using a negative binomial type 2 distribution, which might be pretty tricky or almost impossible with any other methods.

The probability distribution function is given below: 

In the next section, we will take you through its practical application in Python and R. 

Application:

Mr. Singh works in an Insurance Company where his target is to sale a minimum of five policies in a day. On a particular day, he had already sold 2 policies after numerous attempts. The probability of sales on each policy is 0.6. Now, if the policies may be considered as independent Bernoulli trials, then:

  1. What is the probability that he has exactly 4 failed attempts before his 3rd successful sales of the day?
  2. What is the probability that he was fewer than 4 failed attempts before his 3rd successful sales of the day?

So, the number of sales = 3.

The probability of failed attempts is 4.

The success of each sale is 0.6.

Calculate Negative Binomial Distribution in R:

In R, we calculate negative binomial distribution to find the probability of insurance sales. Thus, we get,

  1. The probability that he has exactly 4 failed attempts before his 3rd successful sales are 8.29%.
  2. The probability that he has fewer than 4 failed attempts before his 3rd successful sales is 82.08%.

Hence, we can see that chances are quite high that Mr. Singh will succeed in making a sale after 4 failed attempts.

Calculate Negative Binomial Distribution in Python:

In Python, we get the same results as above.

Conclusion:

Negative Binomial distribution is the discrete probability distribution that is actually used for calculating the success and failure of any observation. When applied to real-world problems, the outcomes of the successes and failures may or may not be the outcomes we ordinarily view as good and bad, respectively.

Suppose we used the negative binomial distribution to model the number of days a certain machine works before it breaks down. In this case, “success” would be the days that the machine worked properly, whereas the day when the machine breaks down would be a “failure”. Another example would be, if we used the negative binomial distribution to model the number of attempts an athlete makes on goal before scoring r goals, though, then each unsuccessful attempt would be a “success”, and scoring a goal would be “failure”.

This blog will surely aid in developing a better understanding of how negative binomial distribution works in practice. If you have any comments please leave them below. Besides, if you are interested in catching up with the cutting edge technologies, then reach the premium training institute of Data Science and Machine Learning leading the market with the top-notch Machine Learning course in India.


Interested in a career in Data Analyst?

To learn more about Data Analyst with Advanced excel course – Enrol Now.
To learn more about Data Analyst with R Course – Enrol Now.
To learn more about Big Data Course – Enrol Now.

To learn more about Machine Learning Using Python and Spark – Enrol Now.
To learn more about Data Analyst with SAS Course – Enrol Now.
To learn more about Data Analyst with Apache Spark Course – Enrol Now.
To learn more about Data Analyst with Market Risk Analytics and Modelling Course – Enrol Now.

An All-Inclusive Guide on Python and its Changing Trends

An All-Inclusive Guide on Python and its Changing Trends

Python is an extremely readable and versatile high-level programming language. Many companies such as Google, YouTube, Dropbox use the language for developing applications. It also finds its use extensively in diverse fields as in Python for data analysis, Machine Learning Using Python, Natural Language Processing, Web Development, Scientific Computing, Image processing, Robotics, Computer Vision and many more.

It supports both Object-oriented programming and Functional programming. Python is generally referred to as an interpreted language which implies that each line of code is executed one by one and if the interpreter finds an error, it stops immediately with an error message on the screen.

Another important feature of Python is its interactive prompt. A Python statement can be typed and immediately executed, which is in sharp contradiction to any other compiled language.

What are Python 2.x and Python 3.x?

There are two main versions of Python: Python 2.x and Python 3.x. If someone is new to Python, then he/she might be in confusion about which version to use. However, in the current scenario, we can easily migrate from Python 2 to Python 3, as the Python Software Foundation has finally taken the step to formally announce that Python 2 will reach the end of life (EOL) on January 1st, 2020.

Key differences between Python 2.x and Python 3.x

This article discusses the differences between these two versions of Python, making Python 3 less confusing for a new programmer.

  1. Print Function

In Python 2, print is a statement. There is no need of parenthesis.

In Python 3, print is a function. It needs parenthesis.

  1. Integer Division

In Python 2, if the division operator is performed on two integers, then the output will be an integer for example: – 7/3 = 2.

In Python 3, if the division operator is performed on two integers, then the output will be accurate. It can also be in float for example: – 7/3 = 2.33.

To get the result in an integer only a different division operator is used that is (//) it returns an integer result for example, – 7//3 = 2.

 3. Unicode Support

Both the versions of Python can handle strings (sequences of characters) differently.

Python 2 uses the ASCII encoding standard by default. ASCII is limited to representing 256 characters. This limits the flexibility of Python to encode the characters, particularly non-standard ones. Using Unicode in Python 2 requires extra syntax—for example when using print, the input text is to be wrapped in the Unicode() function to handle special characters.

In Python 3, Unicode is the default. The Unicode standard is much more versatile—it supports over 128,000 characters. There is no need for an extra syntax to define the Unicode values—they get printed automatically as utf-8 strings.

  1. Range Function

In Python 2, the range function returns a list of numbers.

In Python 2, the xrange class represents an iterable that provides the same object.

 In Python 3, original range function is removed and xrange is renamed to range:

In Python 3, it is needed to convert the range object to a list if someone desires the same result as the range function provides in Python 2.

  1. ­­­­Input() Method

Mainly what is expected from the input() method is that it reads input as string, then it can be converted into any datatype as per the requirement.

In Python 2, it has both the input() and raw_input() methods for taking input. The difference between the raw_input() and input()is that the raw_input() reads input as a string while the input() reads input as string only if it is inside quotes else reads as an integer.

In Python 3, there is no raw_input() method. The raw_input() method is replaced by input() in python 3. 

If someone still wants to use the input() method like in python 2, then it can be availed by using eval() method.

There are many other differences between Python 2 and Python 3 like: –

  1. Next() Method

In Python 2, .next() method is used and in Python 3 next() function is used to iterate the next element of an iterator.

  1. Raising Exception

To raise an exception in Python 3, the argument should be in parenthesis, while in Python 2, it is not necessary.

  1. Handling Exception

Handling exception is also changed in Python 3, “as” keyword is used in Python 3, while it is not necessary in Python 2.

So, if someone is a beginner, then it is strongly recommended to use Python 3 because it is the future of Python and also January 1, 2020, will be the last day of Python 2. It means that no improvement will be done anymore after that day, even if someone finds a security problem in it.

Data Science Machine Learning Certification

It is highly recommended to upgrade the version of the programming language to Python 3. Some ways can help the Python 2 users in porting their code from Python 2 to Python 3 and get the feel of Python 3 and figure out how it is different from Python 2. The code can be imported by using tools like “Futurize” and “Modernize”. Also, if someone wants to check the availability of Python 3 as part of his tests, then “caniusepython3.check()” can be used.

As a final note, everyone must look for upgrading their Python version to Python 3 to understand the subtleties of the new version and usher in the future. However, if you are interested in Deep learning for computer vision with Python and similar courses, then opt for the premium Python training institute in Delhi now!


.

Deep Learning and its Progress as Discussed at Intel’s AI Summit

Deep Learning and its Progress as Discussed at Intel’s AI Summit

At the latest AI summit organized by Intel, Mr. Naveen Rao, Vice President and General Manager of Intel’s AI Products Group, focused on the most vibrant age of computing that is the present age we are living. According to Rao, the widespread and sudden growth of neural networks is putting the capability of the hardware into a real test. Therefore, we now have to reflect deeply on “how processing, network, and memory work together” to figure a pragmatic solution, he said.

The storage of data has seen countless improvements in the last 20 years. We can now boast of our prowess of handling considerably large sets of data, with greater computing capability in a single place. This led to the expansion of the neural network models with an eye on the overall progress in neural Network Machine Learning Python and computing in general.

2

With the onset of exceedingly large data sets to work with, Deep learning for Computer Vision Course and the other models of Deep Learning to recognize speech, images, and text are extensively feeding on them. The technological giants were undoubtedly the early birds to grab the technical: the hardware and the software configuration to have an edge on the others.  

Surely, Deep Learning is on its peak now, where computers can identify the images with incredible vividness. On the other hand, chatbots can carry on with almost natural conversations with us. It is no wonder that the Deep learning Training Institutes all over the world are jumping in the race to bring all of these new technologies efficiently to the general mass.

The Big Problem

We are living in the dynamic age of AI and Machine Learning, with the biggies like Google, Facebook, and its peers, having the technical skills and configuration to take up the challenges. However, the neural networks have fattened up so much lately that it has already started to give the hardware a tough time, getting the better of them all the time.

Deep Learning and AI using Python

The number of parameters of the Neural network models is increasing as never before. They are “actually increasing on the order of 10x year on year”, as per Rao. Thus, it is a wall looming in AI. Though Intel is trying its best to tackle this obvious wall, which might otherwise give the industry a severe setback, with extensive research to bring new chip architectures and memory technologies into play, it cannot solve the AI processing problem single-handedly. Rao concluded on a note of requesting the partners in the present competitive scenario.


Sourced from: www.datanami.com/2019/11/13/deep-learning-has-hit-a-wall-intels-rao-says


Interested in a career in Data Analyst?

To learn more about Data Analyst with Advanced excel course – Enrol Now.
To learn more about Data Analyst with R Course – Enrol Now.
To learn more about Big Data Course – Enrol Now.

To learn more about Machine Learning Using Python and Spark – Enrol Now.
To learn more about Data Analyst with SAS Course – Enrol Now.
To learn more about Data Analyst with Apache Spark Course – Enrol Now.
To learn more about Data Analyst with Market Risk Analytics and Modelling Course – Enrol Now.

The Future of AI and Machine Learning: What the Experts Say?

The Future of AI and Machine Learning: What the Experts Say?

It’s hard to ignore the growing prowess of AI and machine learning.

Previously, Gartner predicted that AI will become one of the key priorities for more than 30% C-Suite professionals by 2020. Indeed, it’s true; software vendors across the globe are following this new gold rush. For them, data is like new oil. In this blog, we explore the future of this budding technology and gain some new insights and ideas. Let’s see what the heavyweights from the digital industry have to say:

Hyper-targeting and Personalization

Ben Wald, Co-Founder & VP of Solutions Implementation at Very

Though machine learning is a subset of data analysis, it’s rapidly influencing the IoT industry and its respective devices. In the last couple of years, nearly 90% of data was generated through an array of smartphones, watches and cars. These mountains of data help in forming better customer relationships.

How? Using Machine Learning Using Python of course! With this power tool, the corporate houses are trying to understand their target audience and extract crucial information regarding how well they receive their products and related after-sales services. Fine-tuning personalization on a wider scale is the key. Hopefully, soon, we will be able to achieve this goal. We are still in the nascent stage.

Improved Search Engine Experiences

Dorit Zilbershot, Chief Product Officer at Attivio

Did you know that AI algorithms have a massive impact on search engine results?

In the next few years, search engines are expected to enhance user and admin experience: courtesy breakthroughs in neural networks and deep learning technologies. These revolutionary technologies, especially deep learning for computer vision with Python will make sure users enjoy a fabulous searching experience and will deliver highly relevant answers. Currently, we are working on delivering results that are based on user’s query and profile. The process requires a lot of manual configurations and a fundamental understanding of how search engines work. Later, the results will be customized based on individuals’ past preferences, interactions and words used. It will be fun to see how machine learning algorithms transform the dynamo of content publishing and search engines.

Quantum Computing

Matt Reaney, Founder & CEO of Big Cloud

Real and revolutionary, the concept of quantum computing is wreaking havoc in the domain of science and technology. It is the future of machine learning triggering an array of innovations. Integrating quantum computing with machine learning is expected to transform the field triggering accelerated learning, quicker processing and better capabilities. This means the intricate challenges that we can’t solve now could be done in a fraction of time then.

The potential of quantum computing is huge in the future and is likely affect millions of lives, notably in medicine and healthcare industry.

Currently, there are no commercially-built quantum algorithms or hardware available in the market. However, several research facilities and government agencies have been investing in this new field of science of late.

Data Science Machine Learning Certification

End Notes

At DexLab Analytics, we love to craft and curate insights from industry pundits, especially when it comes to something as significant as technological innovations that transform lives altogether. Follow us and stay updated!


.

Statistical Application in R & Python: Poisson Distribution

Statistical Application in R & Python: Poisson Distribution

Continuing with the series of blogs, the first of which was Statistical Application In R & Python: Normal Probability Distribution, here we bring you a post on how you can calculate Poisson distribution effortless using R & Python. So, stay tuned!

Poisson distribution is a counting process which is a discrete probabilistic model. It has only one parameter, (lambda or “m”) which is essentially the average rate of change. Poisson distribution is used to model “number of anything”. The probability distribution function of a Poisson distribution is given by the below expression.

If m is the mean occurrence per interval, then the probability of having x occurrence with in a given interval is:

Application:

A business firm receives on an average 6.5 telephone calls per day during the time period 11:00 – 11:15 A.M., Find the probability that on a certain day, the firm receives exactly9 calls during the same period.

The random variable x is the ‘number of telephone calls received during the period 11:00 – 11:15 A.M, since x is assumed to Poisson distribution. The parameter m is equal to the mean of the distribution; i.e.  m = 6.5 and x = 9, then the equation is:

Calculate Poisson Distribution in R:

So, while calculating Poisson distribution in R, we notice that the probability of occurring exactly 9 calls instead of average 6.5 calls in a given particular time (11:00 A.M – 11:15 A.M ) = 85.81%

Calculate Poisson Distribution in Python:

So, while we calculate Poisson distribution in Python, we notice that the probability of occurring exactly 9 calls instead of average 6.5 calls in a given particular time (11:00 A.M – 11:15 A.M) = 85.81%

Conclusion:

Companies can use the Poisson distribution to contrive effective steps to improve their operational efficiency. For instance, an analysis done with the Poisson distribution might reveal how a company can arrange staffing in order to be able to handle the peak periods efficiently, when the customer service calls keep on pouring.

In this problem we see that the business firm receives on an average 6.5 telephone calls per day during the time period 11:00A.M – 11:15A.M, then the probability of the firm receives exactly 9 calls in a same is 85.81%.

Dexlab Analytics is the best Python training institute in Delhi, bringing you the all-inclusive courses of Python for Data Analysis and R Predictive Modelling Certification, among others to start your career in Data Science and Analytics.


Interested in a career in Data Analyst?

To learn more about Data Analyst with Advanced excel course – Enrol Now.
To learn more about Data Analyst with R Course – Enrol Now.
To learn more about Big Data Course – Enrol Now.

To learn more about Machine Learning Using Python and Spark – Enrol Now.
To learn more about Data Analyst with SAS Course – Enrol Now.
To learn more about Data Analyst with Apache Spark Course – Enrol Now.
To learn more about Data Analyst with Market Risk Analytics and Modelling Course – Enrol Now.

A Nifty Guide to Initiate AIOps in 2019

A Nifty Guide to Initiate AIOps in 2019

AIOps (artificial intelligence for IT operations) is the buzz word of the 21st century.

In this digitally-charged world, AIOps platforms are the key. They fuse ML and big data functionalities to boost and partly replace primary IT operations’ programs, including event correlation and analysis, performance monitoring and IT service automation and management.

In simple terms, AIOps is the combined application of data science and machine learning to help mitigate IT operations-related challenges and find faster insights. It fixes high-severity outages in a jiffy. 

The main objective of revolutionary AIOps platforms is to ingest and analyze the aggravating volume, variety and velocity of data and deliver it in a useful manner.

Deep Learning and AI using Python

IT bigwigs are excited about the prospects of applying AI and ML to IT operations.

Gartner expects that big enterprises’ usage of AIOps and other monitoring tools and applications will rise from 5% in 2018 to 30% in 2023. The long-term impact of AIOps on IT operations is predicted to be transformative.

Fortunately, AI capabilities are making headway, and more real-time solutions are being formulated and made available each day.

Read on to know how to get started with AIOPs:

Be prepared

First and foremost, you have to familiarize yourself with all the ML and AI capabilities and vocabulary. It doesn’t matter if you are gearing up for an AIOps project or not. Capabilities and priorities change; so be ready to implement the platform anytime soon.

Select the first few test cases carefully

Small and steady wins the race. The same phrase applies to transformation initiatives. They start small, seize knowledge and iterate from there. Imbibe the same approach for AIOps success.

Enhance your proficiency

Decode the intricacies of AIOps amongst your colleagues by displaying simple techniques. Ascertain your skills and identify the loopholes, then devise a relevant plan to fill up those gaps in-between.

Feel free to experiment

Although a majority of AIOps platforms are complex and costly, there is a substantial number of open-source and relatively low-cost ML software available in the market that lets you evaluate the efficacy of AIOps and ML applications and their uses.

Look beyond IT

Don’t forget to leverage all kinds of data analytics resources available in your organization. Data management is the cornerstone of AIOps. Most of the teams are already skilled in it. Statistical analytics and business analysis are key components of contemporary business frameworks, and many techniques traverse public domains. 

2

Standardize and modernize, as and when required

Prepare your work infrastructure to implement a robust AIOps adoption by embracing secure automation architecture, immutable infrastructure patterns and infrastructure as code (IaC).

Interested in learning more about Machine Learning Using Python? Feel free to reach us at DexLab Analytics. We’re a premier learning platform specialized in offering in-demand skill training courses to the interested candidates.


The blog has been sourced from ― www.gartner.com/smarterwithgartner/how-to-get-started-with-aiops


Interested in a career in Data Analyst?

To learn more about Data Analyst with Advanced excel course – Enrol Now.
To learn more about Data Analyst with R Course – Enrol Now.
To learn more about Big Data Course – Enrol Now.

To learn more about Machine Learning Using Python and Spark – Enrol Now.
To learn more about Data Analyst with SAS Course – Enrol Now.
To learn more about Data Analyst with Apache Spark Course – Enrol Now.
To learn more about Data Analyst with Market Risk Analytics and Modelling Course – Enrol Now.

How progressive is an Artificial Neural Network? Tracking ANNs

How progressive is an Artificial Neural Network? Tracking ANNs

The major improvements that Artificial Neural Network is bringing about in favour of deep learning for computer vision with Python are ground-breaking. Machine vision, in general, is hugely benefitted with the inclusion of the computer vision course Pythonspurred by the all-new technology of Neural Networks. This is by and large a huge advancement in the field of computer science and gives much of an insight into what the future holds for us.

However, along with an array of experiments that are performed day in day out with Neural Network Machine Learning Python, numerous other fields are also likely to be revamped in much the same way. Predicting the weather, studying animals and other critical studies of cosmology are also believed to be easing soon holding the hands of the Artificial Neural Network technology.

2

Some Well-known Feats of the Artificial Neural Network

Artificial Neural networks (ANNs) are used in studying the patterns, relationships from the collected data just like humans. Going by the name, ANNs are modelled on the neural networks found in our brains, which are used to infuse the machines with the ability to learn by them. Besides, ANNs have been hugely successful in bringing about the concept of self-driving cars, boosting medical technology and numerous other fields. But, here we lay down some other fields which are soaking in the Artificial Neural Network extensively.

Meteorology

The accurate prediction of hailstorms and providing relevant alerts to the specific areas are expected to boost shortly. With the inclusion of Convolutional neural networks, (CNNs) the study of meteorology is deemed to achieve new heights. Besides, this improved technology would also be capable of identifying the size of the hails during this storm.

Tracking Bird Migration

We are all aware of the phenomenon of migration for the birds. But with the changing age, the routes of the birds are also different from what they used to be. However, if you need to track the migration of the birds, you can opt for the exclusive Neural Networks in Python course.

Deep Learning and AI using Python

Interpreting the Dark Matter

Dark matter has been a topic which remains largely unexplored till date. Nothing beyond the name and the fact that it binds the universe together is brought to light. However, with the marked progress of the premium institutes like the Neural Networks Training in Delhithe dark matter will no longer be a mystery.


Interested in a career in Data Analyst?

To learn more about Data Analyst with Advanced excel course – Enrol Now.
To learn more about Data Analyst with R Course – Enrol Now.
To learn more about Big Data Course – Enrol Now.

To learn more about Machine Learning Using Python and Spark – Enrol Now.
To learn more about Data Analyst with SAS Course – Enrol Now.
To learn more about Data Analyst with Apache Spark Course – Enrol Now.
To learn more about Data Analyst with Market Risk Analytics and Modelling Course – Enrol Now.

Python vs. Scala: Which is Better for Data Analytics?

Python vs. Scala: Which is Better for Data Analytics?

Data Science and Analytics seem to be synonymous to progress as far as the field of computer science is concerned. Now, with the rise of these technologies, everything goes down to the programming languages, which single-handedly help in the growth of them. 

This gave rise to Python, now known as the most significant language in the world of technology. Scala is another versatile language which is not unknown to the researchers and tech geeks. These two languages are the most talked about in the industry today. Nevertheless, both of them are extensively used in data analytics and data science. However, the debate regarding which one to opt for among the two has always been constant. But worry no longer because here we will discuss both of them, in brief, to help you with your choice!

Deep Learning and AI using Python

Python

Python is really one of the most popular languages in the industry. The open-source nature of the language makes it a popular choice for scripting and automation works. 

Besides, Python is powerful, effective, and easy to learn. Moreover, Neural Network Machine learning Python boasts of its efficient high-level data structures and for object-oriented programming.

Advantages

  • Easy to learn and effective too.
  • Exhaustive support from active communities.
  • Python enjoys built-in support for the datatypes.

Disadvantages

  • Your computer might slow down a little when you are running Python. This is in contrast to when you are running other languages like C or Java.

Scala

If you want an object-oriented, functional programming language, then Scala would certainly be your first choice. It was basically built for the Java Virtual Machine (JVM) and remains the most compatible programming language with Java code till date.

Advantages

  • Scala can utilise the majority of the JVM libraries, thus helping them to be embedded in the enterprise code.
  • It shares an array of readable syntax features of the popular languages, like Ruby.
  • Scala brags about numerous incredible features like string comparison advancements, pattern matching and its likes.

2

Disadvantages

  • Scala has a limited number of users in the communities, which encourages lesser interactions and stunted growth.
  • At times the type-information in Scala is really complex to comprehend. This difficulty can be attributed to the functional and object-oriented nature of the language.

We hope that this article helps you to have a brief insight into two of the most demanding programming languages: Python and Scala.

Now, if you want to enrol yourself in Computer vision course Python, you can reach us right at Dexlab Analytics, the most reputable institute for Big Data Analytics. Also, if you are looking for all-inclusive Deep learning for computer vision Course, turn no further than our premium institute to shoot your career up!


Interested in a career in Data Analyst?

To learn more about Data Analyst with Advanced excel course – Enrol Now.
To learn more about Data Analyst with R Course – Enrol Now.
To learn more about Big Data Course – Enrol Now.

To learn more about Machine Learning Using Python and Spark – Enrol Now.
To learn more about Data Analyst with SAS Course – Enrol Now.
To learn more about Data Analyst with Apache Spark Course – Enrol Now.
To learn more about Data Analyst with Market Risk Analytics and Modelling Course – Enrol Now.

Call us to know more