Data Science training Archives - Page 4 of 4 - DexLab Analytics | Big Data Hadoop SAS R Analytics Predictive Modeling & Excel VBA

Want to Grow Quickly as a Data Scientist? Check Out 6 Ways

Want to Grow Quickly as a Data Scientist? Check Out 6 Ways

With the raging popularity of Data Science, only a few would be as unambitious as not choosing it as their field of work. Not only does Data Science open up a path long and promising for learning and attaining mastery but it also lets you get into the spotlight quicker than ever.

Most importantly, with the rising trend of Data Science, you can also shoot your career up.

Opting for Data Science, you can either be an employee in any of the distinguished IT sectors or you might also serve as a trainer, with your name all over the community.

But, as with all the other trades, marketing is important even when you seek for grounding your career in Data Science. But don’t worry because here we will give you some hacks to market yourself as a Data Scientist and grow as fast as feasible.

2

Knowing the Inside Out of the Domain

Ensure that you have a deep knowledge of Data Science before starting to market yourself as a Data Scientist. This is because as more and more people are getting trained in Data Science and starting to pave their career in the same field, none but they with a steadfast knowledge would thrive. Furthermore, in this digital career, you shall also pledge to be always updated and Data Science Courses in Gurgaon can give you the edge.

So, it would prove to be indispensable if you invest a considerable amount of time to learn, on hands-on-experience, leading to chiselling your knowledge and skillset.

Delve into Social Media

When it comes to marketing, you shall never disregard Social Media. In fact, that is the platform which you must first target. Facebook, Twitter and LinkedIn is the trio that you must first address.

Navigate to your Social Media accounts as frequently as you can. There, try to make friends with the people of the same profession, interact with them, discuss various problems and highlight your feats.

Value your Content

As in marketing, the common phrase goes “Content is King”, the validity of this saying is never to be tested.

Like your friends from Media, Content Marketing and Digital Marketing, there is no alternative to create your content and build your own trust.

Note – Bad content and plagiarism are a strict no-no.

Speak Often

Data Science is a relatively new stream, meetings, conferences, discussions are happening almost all the time around the world. Hence, keep yourself aware of these events and try to participate in them both as a speaker as well as a diligent and inquisitive audience.

Grow this habit and you will be amazed at assessing the popularity of yourself incredibly fast.

Be Inclined to Help

Knowledge is always ought to be shared. If you discover that you have an irrefutable knowledge of something and someone is asking for help in your domain of expertise, then extend your helping hands to them. This way you will simply be recognised all the way more.

Deep Learning and AI using Python

Hackathons

For computer geeks and coders, Hackathons speak volumes. You should also try and participate in more such hackathons which are widely occurring. This will not only help you test your knowledge and understanding but will push you further and even help you extend the contacts in your professional field.

The points that we have highlighted here should surely help you be more marketable as a Data Scientist. So, keep these in mind and watch your career take a flight!


Interested in a career in Data Analyst?

To learn more about Data Analyst with Advanced excel course – Enrol Now.
To learn more about Data Analyst with R Course – Enrol Now.
To learn more about Big Data Course – Enrol Now.

To learn more about Machine Learning Using Python and Spark – Enrol Now.
To learn more about Data Analyst with SAS Course – Enrol Now.
To learn more about Data Analyst with Apache Spark Course – Enrol Now.
To learn more about Data Analyst with Market Risk Analytics and Modelling Course – Enrol Now.

5 Full-Stack Data Science Projects You Need to Add to Your Resume Now

5 Full-Stack Data Science Projects You Need to Add to Your Resume Now

Small or big, most of the organizations seek aspiring data scientists. The reason being this new breed of data experts helps them stay ahead of the curve and churns out industry-relevant insights.

It hardly matters if you are a fresher or a college dropout, with the right skill-set and basic understanding of nuanced concepts of machine learning, you are good to go and pursue a lucrative career in data science with a decent pay scale.

However, whenever a company hires a new data scientist, the former expects that the candidate had some prior work experience or at least have been a part in a few data science-related projects. Projects are the gateway to hone your skills and expertise in any realm.  In such projects, a budding data scientist not only learns how to develop a successful machine learning model but also solves an array of critical tasks, which needs to be fulfilled single-handedly. The tasks include preparing a problem sheet, crafting a suitable solution to the problem, collect and clean data and finally evaluate the quality of the model.

Below, we have charted down top 5 full-stack data science projects that will boost your efforts of preparing an interesting resume.

Deep Learning and AI using Python

Face Detection

In the last decade, face detection gained prominence and popularity across myriad industry domains. From smartphones to digitally unlocking your house door, this robust technology is being used at homes, offices and everywhere.

Project: Real-Time Face Recognition

Tools: OpenCV, Python

Algorithms: Convolution Neural Network and other facial detection algorithms

Spam Detection

Today, the internet plays a crucial role in our lives. Nevertheless, sharing information across the internet is no mean feat. Communication systems, such as emails, at times, contain spam, which results in decreased employee productivity and needs to be avoided.

Project: Spam Classification

Tools: Python, Matplotlib

Algorithm: NLTK

Sentiment Analysis

If you are from the Natural Language Processing and Machine Learning domain, sentiment analysis must have been the hot-trend topic. All kinds of organizations use this technology to understand customer behaviors and frame strategies. It works by combining NLP and suave machine learning technologies.

Project: Twitter Sentiment Analysis

Tools: NLTK, Python

Algorithms: Sentiment Analysis 

Time Series Prediction

Making predictions regarding the future is known as extrapolation in the classical handling of time series data. Modern researchers, however, prefer to call it time series forecasting. It is a revolutionary phenomenon of taking models perfect on historical data and using them for future prediction of observations.

Project: Web Traffic Time Series Forecasting

Tools: GCP

Algorithms: Long short-term memory (LSTM), Recurrent Neural Networks (RNN) and ARIMA-based techniques

2

Recommender Systems

Bigwigs, such as Netflix, Pandora, Amazon and LinkedIn rely on recommender systems. The latter helps users find out new and relevant content and items. In simple terms, recommender systems are algorithms that suggest users meaningful items based on his preferences and requirements.

Project: Youtube Video Recommendation System

Tools: Python, sklearn

Algorithms: Deep Neural Networks, classification algorithms

If you are a budding data scientist, follow DexLab Analytics. We are a premier data science training platform specialized in a wide array of in-demand skill training courses. For more information on data science courses in Gurgaon, feel free to drop by our website today.


The blog has been sourced fromwww.analyticsindiamag.com/5-simple-full-stack-data-science-projects-to-put-on-your-resume


Interested in a career in Data Analyst?

To learn more about Data Analyst with Advanced excel course – Enrol Now.
To learn more about Data Analyst with R Course – Enrol Now.
To learn more about Big Data Course – Enrol Now.

To learn more about Machine Learning Using Python and Spark – Enrol Now.
To learn more about Data Analyst with SAS Course – Enrol Now.
To learn more about Data Analyst with Apache Spark Course – Enrol Now.
To learn more about Data Analyst with Market Risk Analytics and Modelling Course – Enrol Now.
Top 6 Data Science Interview Red Flags

Top 6 Data Science Interview Red Flags

Excited to face your first data science interview? Probably, you must have double-checked your practical skills and theoretical knowledge. Technical interviews are tough yet interesting. Cracking them and bagging your dream job is no mean feat.

Thus, to lend you a helping hand, we’ve compiled a nifty list of some common red flags that plague data science interviews. Go through them and decide how to handle them well!

Boring Portfolio

Having a monotonous portfolio is not a crime. Nevertheless, it’s the most common allegation against data scientists by the recruiters. Given the scope, you should always exhibit your organizational and communication abilities in an interesting way to the hiring company. A well-crafted portfolio will give you instant recognition, so why not try it!

Deep Learning and AI using Python

Sloppy Code

Of course, your analytical skills, including coding is going to be put to test during any data science interview. A quick algorithm coding test will bring out the technical value you would add to the company. In such circumstances, writing a clumsy code or a code with too many bugs would be the last thing you want to do. Improving the quality of coding will accelerate your hiring process for sure.

Confusion about Job Role

No wonder if you walk up to your interviewer having no idea about your job responsibilities, your expertise and competence will be questionable. The domain of data science includes a lot of closely related job profiles. But, they differ widely in terms of skills and duties. This is why it’s very important to know your field of expertise and the skills your hiring company is looking for.

Zero Hands-on Experience

A decent, if not rich, hands-on experience in Machine Learning or Data Science projects is a requisite. Organizations prefer candidates who have some experience. The latter may include data cleaning projects, data-storytelling projects or even end-to-end data projects. So, keep this in mind. It will help you score well in the upcoming data science interview.

Lack of Knowledge over Data Science Technicalities

Data analytics, data science, machine learning and AI – are all closely associated with one another. To excel in each of these fields you need to possess high technical expertise. Being technically sound is the key. An interview can go wrong if the recruiter feels you lack command over data science technicalities, even though you have presented an excellent portfolio of projects.

Therefore, you have to be excellent in coding and harbor a vast pool of technical knowledge. Also, be updated with the latest industry trends and robust set of algorithms.

Ignoring the Basics

It happens. At times, we fumble while answering some very fundamental questions regarding our particular domain of work. However, once we come out of the interview venue, we tend to know everything. Reason: lack of presence of mind. Therefore, the key is to be confident. Don’t lose your presence of mind in the stifling interview room.

Thus, beware of these drooping gaps; being a victim of these critical objections might keep you away from bagging that dream data analyst job. Instead, work on them and win a certain edge over others while cracking the toughest data science interview session.

2

Note:

If interested in Data Science Courses in Gurgaon, check out DexLab Analytics. We are a premier training platform specialized in in-demand skills, including machine learning using Python, Alteryx and customer analytics. All our courses are industry-relevant and crafted by experts.


The blog has been sourced from upxacademy.com/eleven-most-common-objections-in-data-science-interviews-and-how-to-handle-them


Interested in a career in Data Analyst?

To learn more about Data Analyst with Advanced excel course – Enrol Now.
To learn more about Data Analyst with R Course – Enrol Now.
To learn more about Big Data Course – Enrol Now.

To learn more about Machine Learning Using Python and Spark – Enrol Now.
To learn more about Data Analyst with SAS Course – Enrol Now.
To learn more about Data Analyst with Apache Spark Course – Enrol Now.
To learn more about Data Analyst with Market Risk Analytics and Modelling Course – Enrol Now.
World’s Biggest Tech Companies 2018: A Comprehensive List

World’s Biggest Tech Companies 2018: A Comprehensive List

Talking of world’s biggest and most-valued companies, people instinctively turn their gaze to technology sector. Ever since the phenomenal dotcom boom and onset of WorldWideWeb, the tech firms have been garnering accolades owing to their huge market caps and power to disrupt conventional industries.

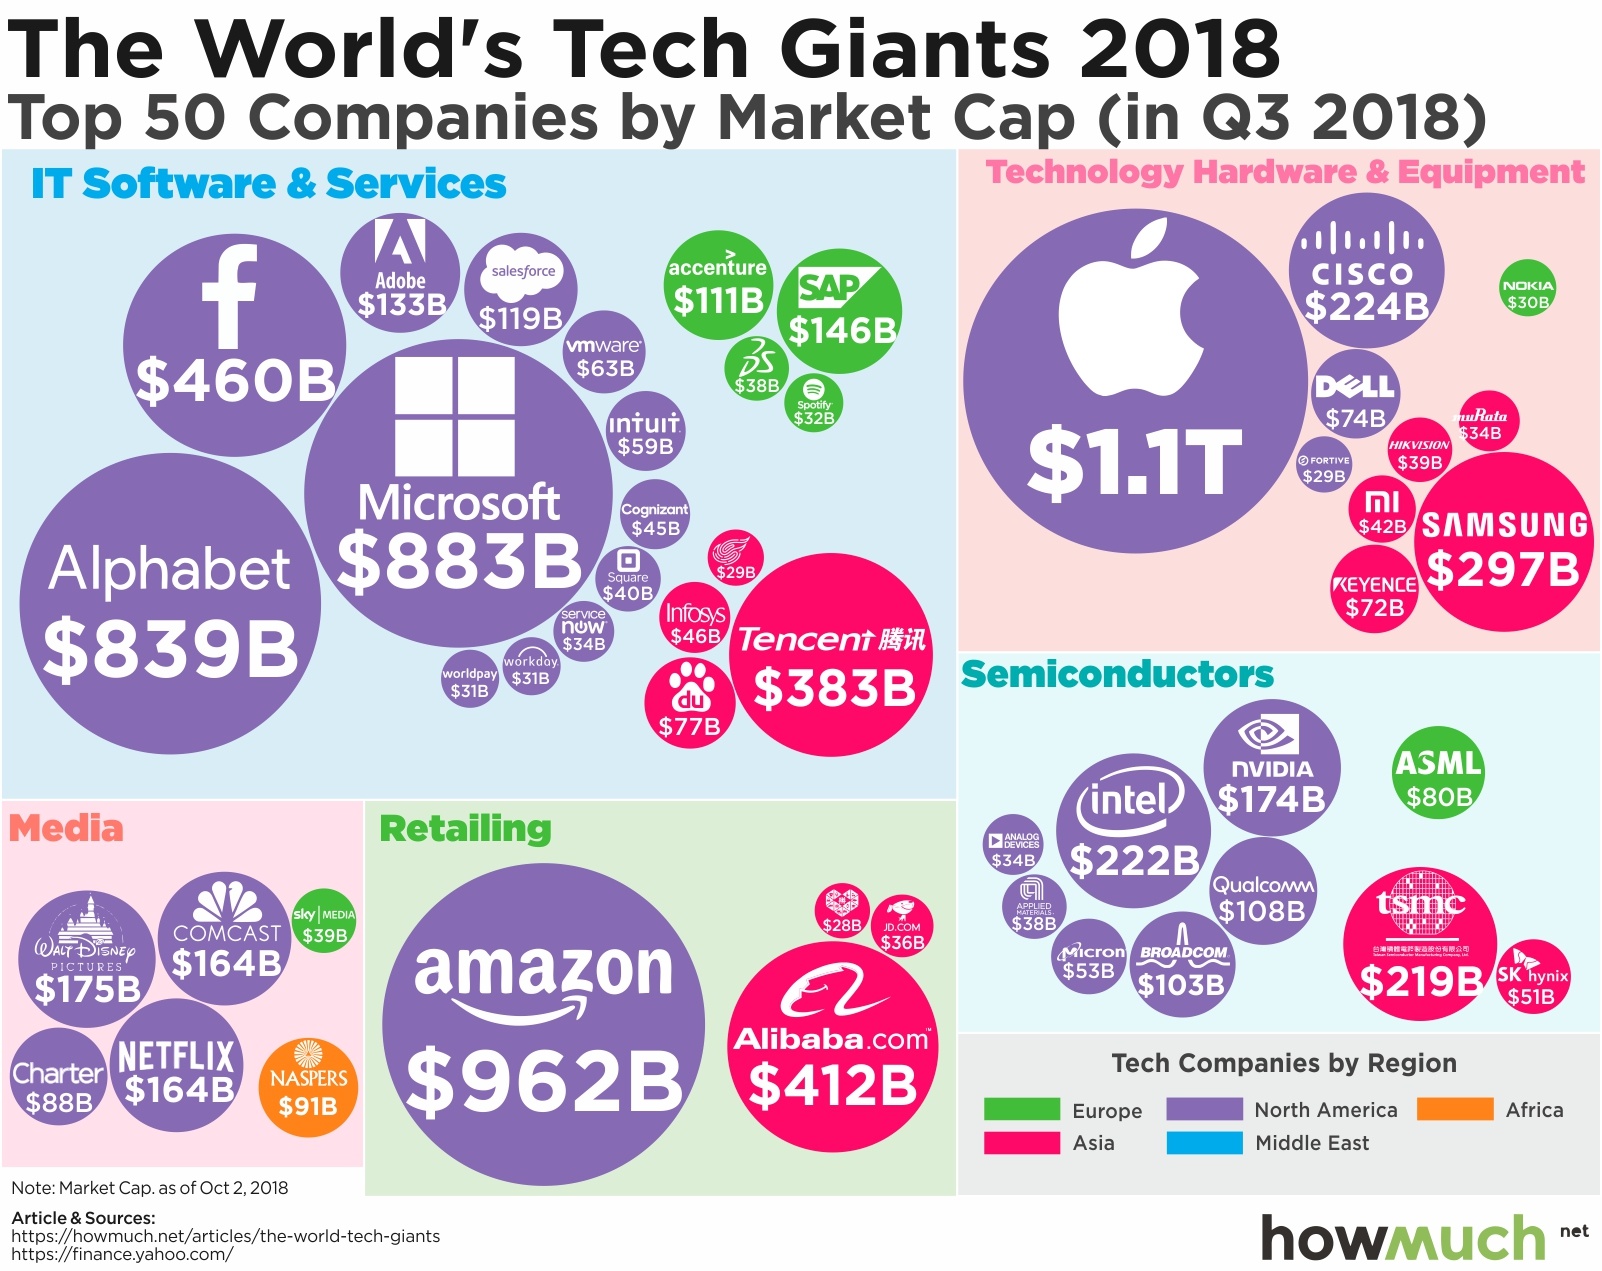
FYI: A public company’s market cap refers to market capitalization, which is a measurement of the value of its current outstanding shares. To calculate the market cap, you need to just multiply the current stock price with the outstanding number of shares. Talking about today’s market condition that would mean a lot of numbers.

To evaluate the top notch tech companies across the globe, Howmuch.net took into consideration the market cap ranking given by Forbes and split it in an unique way. Obviously, the US and China houses some of the wealthiest companies, worth hundreds of billions of dollars.

2

Below we’ve 10 most high-valued tech companies on the planet, according to their market caps as of October 2018:

  • Apple: $1.1T
  • com: $962B
  • Microsoft: $883B
  • Alphabet: $839B
  • Facebook: $460B
  • Alibaba: $412B
  • Tencent Holdings: $383B
  • Samsung Electronics: $297B
  • Cisco Systems: $224B
  • Intel: $222B

(Give credits)

“At first glance, retailing and media appear to be much more evenly distributed than they actually are,” the report indicated. “Consider how Amazon has so dominated the market that its North American competitors are so small, they don’t even make it onto the list of top 50 companies. Amazon is so big, there is literally no other company in sight.”

Key Takeaways:

  • As always, Apple tops the list of tech companies, not only as the biggest tech company but it’s also the eighth largest company in the world according to Forbes’ Global 2000 list. The company saw $247.5 billion in sales, $53 billion in profit, $367.5 billion in assets and a market cap of $927 billion for the past year.
  • The AntiTrust Regulations and growth of 5G wireless can bring forth major changes in the modern tech market, and we are eagerly waiting for such shift in focus.

As parting thoughts, we would like to say that though the current market setup has been quite steady for a while, a surge of change may soon be here. Interestingly, Chinese tech bigwig, Alibaba is mostly likely to expand its scopes and capabilities, while 5G connectivity may appear fetching. Moreover, the speculation says antitrust regulation could disrupt functionalities of some of these companies.

To stay updated about technology-related news and innovations, follow DexLab Analytics. It’s a premier institution famous for state of the art data science courses in Delhi. For more, check out their homepage: an army of data science related courses are on offer.

 
The blog has been sourced from — www.techrepublic.com/article/the-10-most-valuable-tech-companies-in-the-world
 

Interested in a career in Data Analyst?

To learn more about Data Analyst with Advanced excel course – Enrol Now.
To learn more about Data Analyst with R Course – Enrol Now.
To learn more about Big Data Course – Enrol Now.

To learn more about Machine Learning Using Python and Spark – Enrol Now.
To learn more about Data Analyst with SAS Course – Enrol Now.
To learn more about Data Analyst with Apache Spark Course – Enrol Now.
To learn more about Data Analyst with Market Risk Analytics and Modelling Course – Enrol Now.

Fundamental Concepts of Statistics for Data Science Beginners- Part One

Fundamental Concepts of Statistics for Data Science Beginners- Part One

Do you aspire to be a data scientist? Then is it essential that you have a solid understanding of the core concepts of statistics. Everyone doesn’t have a Ph.D. in Statistics. And that isn’t the only way to excel in the field of data science. But yes, knowing stats well is a prerequisite for data science.

Nowadays, popularly used libraries, like Tesorflow, liberate the user from the intricacies of complex mathematics. Still, it is advisable to be familiar with the fundamental principles on which they work, because that will enable you to use the libraries better.

In this blog, we attempt to shed light on some basic concepts, theorems and equations of statistics for data science.

Statistical Distributions:

Statistical distributions are important tools that you must arm yourself with to be a skilled data scientist. Here, we shall talk about two important distributions, namely Poisson distribution and Binomial distribution.

Poisson distribution:
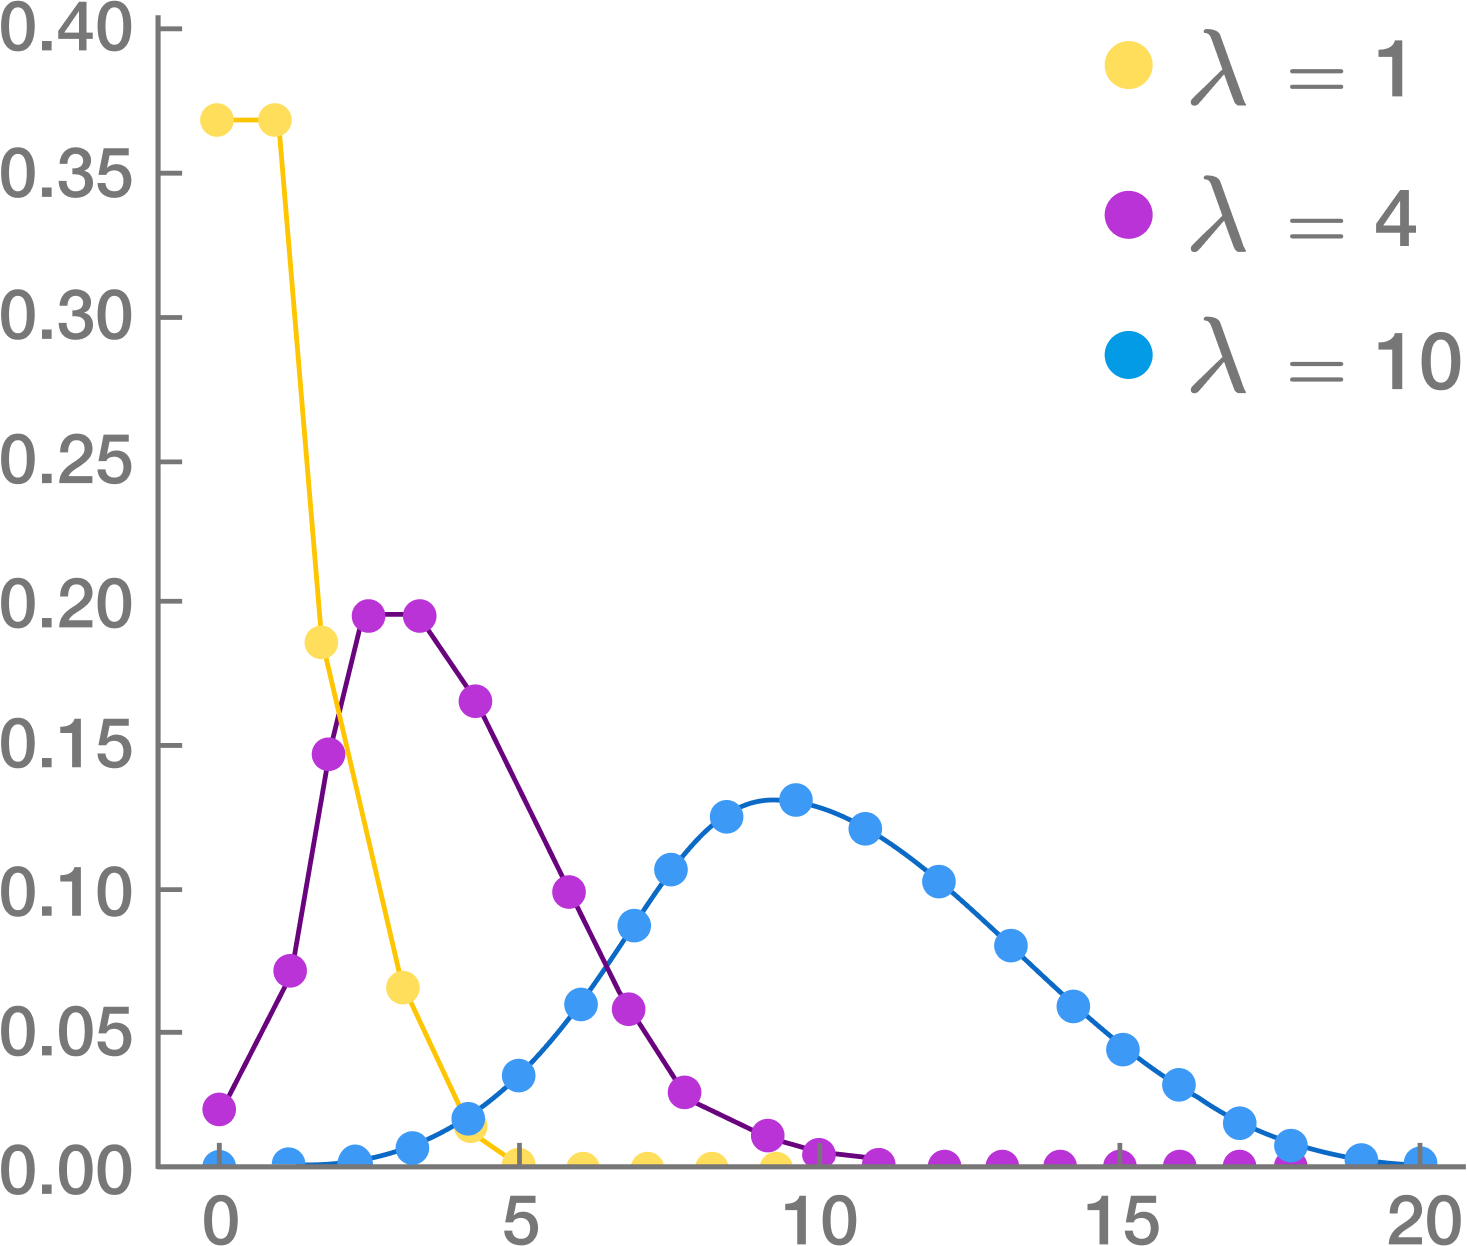
This distribution is used to find out the number of events that are expected to occur during an interval of time. For example, the number of page views in one second, the number of phone calls in a particular period of time, number of sales per hour, etc.

The symbols used in the equation are:

x: exact number of successes

e: constant equal to 2.71828 approximately

λ: average number of successes per time interval

Poisson distribution is used for calculating losses in manufacturing. Let us consider that a machine generates metal sheets that have ‘x’ flaws per yard. Suppose the error rate is 2 per yard of sheet (λ). Applying this information to Poisson distribution, we can calculate the probability of having exactly two errors in a yard.

Source: Brilliant.org

Poisson distribution is used for faster detection of anomalies.

Binomial distribution:

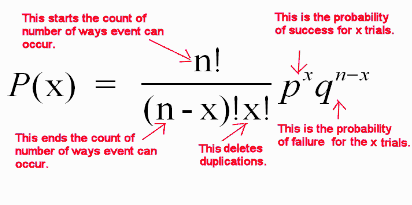
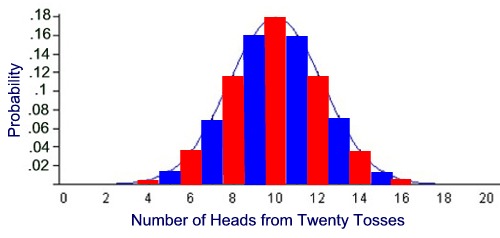
This is a very common distribution in Statistics. Suppose you have flipped a coin thrice. Using basic combinatorics for flipping a coin thrice, we see that there are eight combinations possible. We find out the probabilities of getting 0, 1, 2 or 3 heads and plot this on a graph. This gives us the binomial distribution for this particular problem. It must be remembered that Binomial distribution curve is similar to a Normal distribution Curve. Normal distribution is used when values are continuous and Binomial distribution is used for discrete values.

Source: mathnstuff.com

Binomial distribution is a discrete probability distribution where number of trials is predetermined and there are two possible outcomes– success and failure, win or lose, gain or loss. Depending on a few conditions, like the total number of trails is large, the probability of success is near 1 and the probability of failure is near 0, the trails are independent and identical, etc., the binomial distribution is approximated to a normal distribution.

Source: MathBitsNotebook

Binomial distribution has many applications in business. For example, it is estimated that 5% of tax returns for individuals with high net worth in USA is fraudulent. These frauds might be uncovered through audits. Binomial distribution is used to find out for ‘n’ number of tax returns that are audited, what is the probability for say 5 fraudulent returns to be uncovered.

There are some more probability distributions, like Bernoulli and Geometric distributions. We shall cover that and more in the following blogs. So, stay tuned and follow DexLab Analytics. The experts here offer top-quality data science courses in Delhi. Go through the data science certification details right now!


References:

upgrad.com/blog/basics-of-statistics-for-data-science

anomaly.io/anomaly-detection-poisson-distribution

analyticsvidhya.com/blog/2017/09/6-probability-distributions-data-science


Interested in a career in Data Analyst?

To learn more about Data Analyst with Advanced excel course – Enrol Now.
To learn more about Data Analyst with R Course – Enrol Now.
To learn more about Big Data Course – Enrol Now.

To learn more about Machine Learning Using Python and Spark – Enrol Now.
To learn more about Data Analyst with SAS Course – Enrol Now.
To learn more about Data Analyst with Apache Spark Course – Enrol Now.
To learn more about Data Analyst with Market Risk Analytics and Modelling Course – Enrol Now.
The Big Data Driven Future of Fashion: How Data Influences Fashion

The Big Data Driven Future of Fashion: How Data Influences Fashion

Big Data is revolutionizing every industry, including fashion. The nuanced notion of big data is altering the ways designers create and market their clothing. It’s not only aiding designers in understanding customer preferences but also helps them market their products well. Hadoop BI is one of the potent tools of technology that provides a wide pool of information for designers to design range of products that will sell.

2

How Does the Mechanism Work?

Large sets of data help draw patterns and obviously trends play a crucial role across the fashion industry. In terms of nature, fashion and trends both are social. Irrespective of the nature of data, structured or unstructured, framing trends and patterns in the fashion industry leads to emerging ideas, strategies, shapes and styles, all of which ushers you into bright and blooming future of fashion.

What Colors To Choose For Your Line?

KYC (Know Your Customer) is the key here too. A fashion house must know which colors are doing rounds amongst the customers. Big data tells a lot about which color is being popular among the customers, and based on that, you can change your offerings subject to trend, style picks and customer preferences.

Men’s or Women’s Clothing: Which to Choose?

Deciding between men’s or women fashion is a pivotal point for any designer. Keep in mind, target demographic for each designer is different, and they should know who will be their prospective customers and who doesn’t run a chance.

Big data tool derive insights regarding when customers will make purchases, how large will be the quantity and how many items are they going to buy. Choosing between men’s and women’s fashion could make all the difference in the world.

Arm yourself with business analyst training courses in Gurgaon; it’s high time to be data-friendly.

Transforming Runway Fashion into Retail Merchandise

Launching a brand in the eyes of the public garners a lot of attention, and the designs need to be stellar. But, in reality the fashion that we often see on runways is rarely donned by the ordinary customers; because, the dresses and outfits that are showcased on the ramp are a bit OTT, thus altered before being placed in the stores. So, big data aids in deciphering which attires are going to be successful, and which will fail down the line. So, use the power of big data prudently and reap benefit, unimaginable across the global retail stores.

Deciding Pricing of the Product

As soon as the garbs leave the runway, they are tagged with prices, which are then posted inside the stores, after analyzing how much the customers are willing to pay for a particular product. For averaging, big data is a saving grace. Big data easily averages the prices, and decides a single mean price, which seems to be quite justifiable.

However, remember, while pricing, each garments are designed keeping in mind a specified customer range. Attires that are incredibly expensive are sold off to only a selected affluent user base, while the pricing of items that are designed for general public are pegged down. Based on previous years’ data, big data consultants can decide the pricing policy so that there’s something for all.

The world of fashion is changing, and so is the way of functioning. From the perspective of fashion house owner, collect as much data as possible of customers and expand your offerings. Big data analytics is here to help you operate your business and modify product lines that appeals to the customers in future.

And from the perspective of a student, to harness maximum benefits from data, enroll in a data analyst course in Gurgaon. Ask the consultants of DexLab Analytics for more deets.


The article has been sourced from

channels.theinnovationenterprise.com/articles/8230-big-data-hits-the-runway-how-big-data-is-changing-the-fashion-industry

iamwire.com/2017/01/big-data-fashion-industry/147935

bbntimes.com/en/technology/big-data-is-stepping-into-the-fashion-world


Interested in a career in Data Analyst?

To learn more about Data Analyst with Advanced excel course – Enrol Now.
To learn more about Data Analyst with R Course – Enrol Now.
To learn more about Big Data Course – Enrol Now.

To learn more about Machine Learning Using Python and Spark – Enrol Now.
To learn more about Data Analyst with SAS Course – Enrol Now.
To learn more about Data Analyst with Apache Spark Course – Enrol Now.
To learn more about Data Analyst with Market Risk Analytics and Modelling Course – Enrol Now.
Bringing Back Science into “Data Science”

Bringing Back Science into “Data Science”

Far from the conventional science disciplines, like physics or mathematics, Data Science is a budding discipline: which means there are no proper definition to explain what data science is and what role it does play.

Nevertheless, the internet is full of working definitions of data science. As per Wikipedia, Data Science is

(an) interdisciplinary field about processes and systems to extract knowledge or insights from data in various forms, either structured or unstructured, which is a continuation of some of the data analysis fields such as statistics, data mining, and predictive analytics.

To that note, a very important aspect is left behind in this explanation: Data Science is a science first, which means a proper scientific method should be devised to tackle different data science practices. By scientific method, we mean a healthy process of asking questions, collecting information, framing hypothesis and analyzing the results to draw conclusions thereafter.

Go below, the process breakup is as follows..

Ask questions

Start by asking what is the business problem? How to leverage maximum gains? What ways to implement to increase return on investment? The finance industry takes help from data science for myriad reasons. One of the most striking reasons is to enhance the return on investment out of marketing campaigns.

What Sets Apart Data Science from Big Data and Data Analytics – @Dexlabanalytics.

Collect data

A predictive modeling analyst has access to vast data resources, which eventually makes the entire research and gathering data process much less complex. However, it is only in theory, because rarely data is stored in the desired format an analyst wants, making his job easier.

Data Science – then and now! – @Dexlabanalytics.

Devise a hypothesis

After getting to the heart and soul of the problem, we start to develop hypotheses. For example, you believe your firm’s profit is leveraged by an optimistic customer reaction towards your product quality and positive advertising capabilities of your firm. Through this example, we explained a nomological network, where you are in a position to infer casualties and correlations. While dealing in Data Science, assessing customer perception is very crucial, and so is the analysis of financial datasets.

Data Science: Is It the Right Answer? – @Dexlabanalytics.

Testing and experiments

Formulating a hypothesis is not enough; a predictive modeler relies on statistical modeling techniques to forecast the future in a probabilistic manner. Keep a note, this doesn’t result in indicating “X will occur”, instead it refers “Given Y, the probability of X occurring is 75%.”

Any proper experiment includes control groups and test, meaning a modeler when preparing a predictive model should divide the dataset so as to ensure availability of few data for testing predictive equation.

Now, if we talk about marketing – consider logistic regression. It offers a probability whether a binary event of interest will take place or not.

Enroll in an R Predictive Modelling Certification program to go through the mechanics of this problem. Reach us at DexLab Analytics.

Tracing Success in the New Age of Data Science – @Dexlabanalytics.

Evaluate results and infer conclusions

Now is the time to make a decision: do you prefer the quantitative approach? As social media is totally unstructured, the qualitative approach needs to be implemented using Natural Language Processing, which can be a tad difficult. Now, how about making a longitudinal analysis, while transforming data into time series? Do all these questions rake your mind? Yes? Then you are on the right track.

Keep Pace with Automation: Emerging Data Science Jobs in India – @Dexlabanalytics.

Reporting of results

This is the final battle scene for all predictive modelers. It calls for all the documents, based on which a modeler made his decision during the development process. All the assumptions taken have to be identified and highlighted beside the results.

And with it comes the end of our Science in Data Science process!

For more interesting updates and blogs, follow us at DexLab Analytics. Opt for our impressive Data Science Courses in gurgaon and lead the road of success!


Interested in a career in Data Analyst?

To learn more about Data Analyst with Advanced excel course – Enrol Now.
To learn more about Data Analyst with R Course – Enrol Now.
To learn more about Big Data Course – Enrol Now.

To learn more about Machine Learning Using Python and Spark – Enrol Now.
To learn more about Data Analyst with SAS Course – Enrol Now.
To learn more about Data Analyst with Apache Spark Course – Enrol Now.
To learn more about Data Analyst with Market Risk Analytics and Modelling Course – Enrol Now.

Harnessing Big Data for Water Management

World Water Day: Save Water with Big Data

Appalling forces are re-establishing the relationship between humans and water.

In the past, communities developed slowly, while the weather remained constant. Water sources never depleted at tumultuous rates as it has today. Water is no longer a dependable resource. That’s why many countries and cities are embracing smart technologies to manage water efficiently and preserve it for the coming generations.

As we observe the United Nations World Water Day on Wednesday, 22nd March, it is apt to assess the development being made in conserving this diminishing resource.

World-Water-Day-Save-Water-Save-Water-Save-Nature

 Today, the Internet of Things (IoT) – a blooming worldwide network of devices and appliances linked to the internet – has materialized as a propitious solution to save water and protect clean drinking water, especially in cities.  

To begin our discussion, Netherlands is on its way to develop a pioneering program to address the relevant problems of increasing sea levels, surging number of droughts and the effect of extreme weather changes on its trains, bus networks and roadways, and the efficiency with which the entire nation tackles situations like this. The ambitious project, Digital Delta draws in local and regional water jurisdictions, top-notch scientists and proliferating businesses to implement Big Data technology for upgrading the systems of its €7 billion water management, while restricting the costs of preserving water by 15%.

Prophecies about Urban Centres
data_flow

Plummeting freshwater resources: a serious challenge faced by the global population is now at its apex. An overwhelming 89 percent of the world population thrives on enhanced water supply systems, which results in a loss of more than 32 billion cubic meters of fresh water, through physical leakage. Thereby, more than 50 percent of world population will be vulnerable in water-stressed regions by 2025. And by 2040, the figures will further push the energy demand by 56%, making US the second highest energy consumer across the globe.

Saving Water Globally

In the meantime, most of the world cities should re-invent and re-structure their assets to pull together advanced functions encompassing different complex systems and to associate with new powerful allies. Urbanization comes with its own costs. Day by day, these networks are growing more complicated and even more expensive. By delving deeper into the interconnections of systems, the societies will be in a better position to grasp how to run them more efficiently.

Water has never grabbed eyeballs, as it has today. Many countries are not at all prepared to manage such burgeoning complexities of water management. Besides, water management authorities are constantly under pressure to harness their power for flood protection and drinking water standards.

Reality Check: Water demand is set to rise by 30% by 2030. Ever increasing population and swelling urbanization are the reasons behind such calamitous figures.

Smart City Technology – The Key to Urban Sustainability

AAEAAQAAAAAAAAgTAAAAJDllNmM3YjJmLWI3NTEtNDkxNS05MWYxLTYxMTM3OTUyZGE2OQ

New Jersey Institute of Technology (NJIT) revealed that by 2025 smart city technologies would multiply to an industry estimating $27.5 billion. Moreover, nearly 88 smart cities will develop by the end of 2025. Smart cities whirl around the concept of using improved, interconnecting technologies to make environment safe, lives easier and urban living cost-effective and more efficient.

Societies are enduring new weather extremes. It is the high time to use big data and analytical science to cure the growing complexities in managing our water systems. Smart technology is the only viable option that can take future generations towards a sustainable future.

Seeking data science courses online? Visit us at DexLab Analytics. We offer a wide array of highly interactive online courses in data science.


Interested in a career in Data Analyst?

To learn more about Data Analyst with Advanced excel course – Enrol Now.
To learn more about Data Analyst with R Course – Enrol Now.
To learn more about Big Data Course – Enrol Now.

To learn more about Machine Learning Using Python and Spark – Enrol Now.
To learn more about Data Analyst with SAS Course – Enrol Now.
To learn more about Data Analyst with Apache Spark Course – Enrol Now.
To learn more about Data Analyst with Market Risk Analytics and Modelling Course – Enrol Now.
Call us to know more