Data Science Training Course Archives - DexLab Analytics | Big Data Hadoop SAS R Analytics Predictive Modeling & Excel VBA

Autocorrelation- Time Series – Part 3

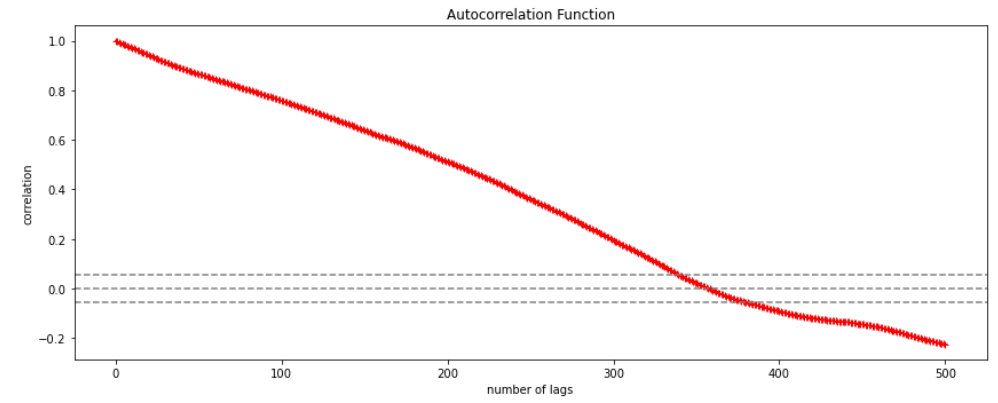
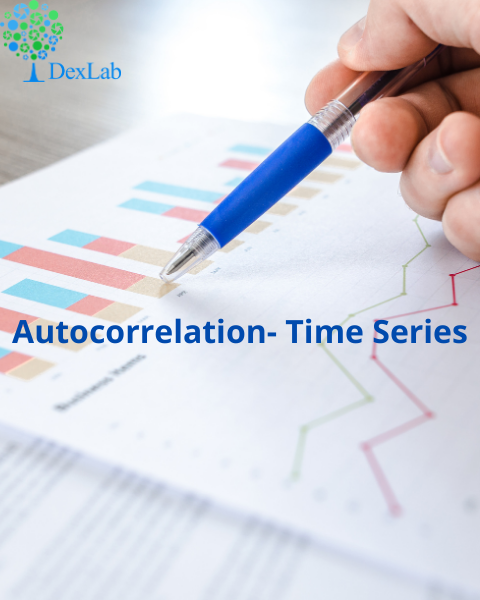
Autocorrelation is a special case of correlation. It refers to the relationship between successive values of the same variables .For example if an individual with a consumption pattern:-

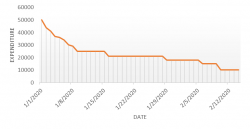
spends too much in period 1 then he will try to compensate that in period 2 by spending less than usual. This would mean that Ut is correlated with Ut+1 . If it is plotted the graph will appear as follows :

Positive Autocorrelation : When the previous year’s error effects the current year’s error in such a way that when a graph is plotted the line moves in the upward direction or when the error of the time t-1 carries over into a positive error in the following period it is called a positive autocorrelation.
Negative Autocorrelation : When the previous year’s error effects the current year’s error in such a way that when a graph is plotted the line moves in the downward direction or when the error of the time t-1 carries over into a negative error in the following period it is called a negative autocorrelation.

Now there are two ways of detecting the presence of autocorrelation
By plotting a scatter plot of the estimated residual (ei) against one another i.e. present value of residuals are plotted against its own past value.

If most of the points fall in the 1st and the 3rd quadrants , autocorrelation will be positive since the products are positive.

If most of the points fall in the 2nd and 4th quadrant , the autocorrelation will be negative, because the products are negative.
By plotting ei against time : The successive values of ei are plotted against time would indicate the possible presence of autocorrelation .If e’s in successive time show a regular time pattern, then there is autocorrelation in the function. The autocorrelation is said to be negative if successive values of ei changes sign frequently.
First Order of Autocorrelation (AR-1)
When t-1 time period’s error affects the error of time period t (current time period), then it is called first order of autocorrelation.
AR-1 coefficient p takes values between +1 and -1
The size of this coefficient p determines the strength of autocorrelation.
A positive value of p indicates a positive autocorrelation.
A negative value of p indicates a negative autocorrelation
In case if p = 0, then this indicates there is no autocorrelation.
To explain the error term in any particular period t, we use the following formula:-

Where Vt= a random term which fulfills all the usual assumptions of OLS
How to find the value of p?

One can estimate the value of ρ by applying the following formula :-
Why Pursuing a Certification Course in Machine Learning Makes Sense Than Doing Self-Study?

Why Pursuing a Certification Course in Machine Learning Makes Sense Than Doing Self-Study

If you are aware of the growth opportunities awaiting you in the Machine Learning domain, you must be in a rush to master the Machine Learning skills. Now, there are courses available that aim to sharpen the students with skills they would need to work in a challenging environment. However, some often prefer the self-study mode for developing knowledge in this highly specialized domain. No matter which way you prefer to learn, ultimately your passion and dedication would matter the most, because in both ways you need to put in the hard work and really toil hard to make any progress.

Is self-study a feasible option?

If you have already been through some course and want to go to the advanced level through self-study that’s a different issue, but, for those who are just starting out without any background in science, does it even make any sense to opt for self-study?

Given the way Machine Learning technology is moving fast and creating a demand for professionals with highly specialized industry knowledge, do you think self-study would be enough? Do you think a self-study plan to learn something you have no idea about would work? How much time would you need to devote? What should be your learning route? And how do you know this is the right path to follow?

Before we dive deeper into the discussion, we need to go through some prerequisites for Machine Learning study plan.

Machine learning is a broad field and assuming you are a beginner with no prior knowledge in this domain, you have to be familiar with mathematics, statistics, programming  languages, meaning undergoing a Python certification training</strong>, must be proficient in data handling including analysis and modeling, you have to work on algorithms. So, can you pick up all of these skills one by one via self-study? Add to the list the latest Machine Learning tools and applications you need to grasp.

There will be help available in the form of:

  • There would be vast resources, in forms of e-books, lectures, video tutorials, most of these are free and easily accessible.
  • There are forums, groups out there which you can join and access help
  • You can take part in online competitions

Think it through. How long will it take for you to get from one stage to the next?

 Even though there being no dearth of resources available you would be struggling with your progress and most importantly you would struggle to keep up with the pace the technology is moving ahead. Picking up a programming language, grasping and mastering concepts of linear algebra, probability, data is going to be a mammoth task.

Data Science Machine Learning Certification

What difference a certification course can make?

  • To begin with these courses are designed for people coming from different backgrounds, so, you having or, not having any prior knowledge in mathematics, statistics wouldn’t matter as you would be taught everything from scratch be it math or, Machine Learning Using Python.
  • The programs are designed for both working professionals as well as for beginners, all you need to do is choose the one that suits your specific level.
  • These courses are designed to transform you into an industry-ready professional and you would be under the guidance of professionals who are more than familiar with the nuances of the way the industry functions.
  • The modules would follow a strict schedule and your training path would be well planned out covering all the areas you need to master.
  • You would learn via hands-on training and get to handle projects. Nothing makes you skilled like hands-on training.

Your journey towards a smarter future needs to be through a well mapped-out path, so, be smart about it. DexLab Analytics offers industry-ready courses on Data Science, Machine Learning course in Gurgaon and AI with Python. Take advantage of the courses that are taught by instructors who have both expertise and experience. Time is indeed money, so, stop wasting time and get down to learning.


.

Probability PART-II: A Guide To Probability Theorems

Probability PART-II: A Guide To Probability Theorems

This is the second part of the probability series, in the first segment we discussed the basic concepts of probability. In this second part we will delve deeper into the topic and discuss the theorems of probability. Let’s find out what these theorems are.

Addition Theorem

    • If A and B are two events and they are not necessarily mutually exclusive then the probability of occurrence of at least one of the two events A and B i.e. P(AUB) is given by


Removing the intersections will give the probability of A or B  or both.


Example:- From a deck of cards 1 card is drawn, what is the probability the card is king or heart or both?

Total cards 52

P(KingUHeart)= P(King)+P(Heart) ─ P(King∩Heart)

  • If A and B are two mutually exclusive events then the probability that either A or B will occur is the sum of individual probabilities of the events A and B.


P(A)+P(B), here the combined probability of the two will either give P(A) or P(B)


  • If A and B are two non mutually exclusive events then the probability of occurrence of event A is given by


Where B’ is 1-P(B), that means probability of  A is calculated as P(A)=1-P(B)


Multiplication Law

The law of multiplication is used to find the joint probability or the intersection i.e. the probability of two events occurring together at the same point of time.

In the above graph we see that when the bill is paid at the same time tip is also paid and the interaction of the two can be seen in the graph.

Joint probability table

A joint probability table displays the intersection (joint) probabilities along with the marginal probabilities of a given problem where the marginal probability is computed by dividing some subtotal by the whole.

Example:- Given the following joint probability table find out the probability that the employee is female or a professional worker.

Watch this video down below that further explains the theorems.

At the end of this blog, you must have grasped the basics of the theorems discussed here. Keep on tracking the Dexlab Analytics blog where you will find more discussions on topics related to Data Science training.


.

Probability PART-I: Introducing The Concept Of Probability

Probability PART-I: Introducing The Concept Of Probability

Today we will begin discussion about a significant concept, probability, which measures the likelihood of the occurrence of an event. This is the first part of the series, where you would be introduced to the core concept. So, let’s begin.

What is probability?

It is a measure of quantifying the likelihood that an event will occur and it is written as P(x).


Key concepts of probability


A union comprises of only unique values.


Intersection comprises of common values of the two sets


  • Mutually Exclusive Events:- If the occurrence of one event preludes the occurrence of the other event(s), then it is called mutually exclusive event.

P(A∩B) = 0

  • Independent Events:- If the occurrence or non-occurrence of an event does not have any effect on the occurrence or non-occurrence of other event(s), then it is called an independent event. For example drinking tea is independent of going for shopping.
  • Collectively Exhaustive Events:– A set of collectively exhaustive events comprises of all possible elementary events for an experiment. Therefore, all sample spaces are collectively exhaustive sets.
  • Complementary Events:– A complement of event A will be A` i.e. P(A`) = 1 ─ P(A)

Properties of probability

  • Probabilities are non-negative values ranging between 0 & 1.
  • Ω = 1 i.e. combined probability of sample is 1
  • If A & B are two mutually exclusive events then P(A U B)= P(A) +P(B)
  • Probability of not happening of an event is P(A)= 1 ─ P(A)

Rules of Counting the possibilities

  • The mn counting rule:- When a customer has a set of combinations to choose from like two different engines, five different paint colors and three different interior packages , how will he calculate the total number of options available to him? The answer to the question is “ mn counting rule”. Simply multiply the given options, like in our case 2 * 5 * 3 will give us 30.This means the customer has 30 combinations to choose from when it comes to purchasing a car.
  • Sampling from a population with replacement:- Suppose that you roll a dice three times i.e. the number of trials is 3, now if we want to check how many combinations are possible in this particular experiment we use Nn = 63 = 216
  • Sampling from a population without replacement:- When the sample space shrinks after each trial then you use the following formula :-

Data Science Machine Learning Certification

Conclusion

There is a video covering the same concept attached down the blog, go through it to be more clear about this.

So, with this we wrap up our discussion on the concept of probability. If you want more informative blogs on Data Science training, then follow the Dexlab Analytics blog. Dexlab Analytics provides machine learning certification courses in gurgaon as well.


.

What Is The Role Of Big Data In The Pharmaceutical Industry?

What Is The Role Of Big Data In The Pharmaceutical Industry?

Big data is currently trending in almost all sectors as now the awareness of the hidden potential of data is on the rise. The pharmaceutical industry is a warehouse of valuable data that is constantly piling up for years and which if processed could unlock information that holds the key to the next level of innovation and help the industry save a significant amount of money in the process as well. Be it making the clinical trial process more efficient or, ensuring the safety of the patients, big data holds the clue to every issue bothering the industry. The industry has a big need for professionals who have Data science using Python training, because only they can handle the massive amount of data and channelize the information to steer the industry in the right direction.

We are here taking a look at different ways data is influencing the pharmaceutical industry.

Efficient clinical-trial procedure

Clinical trial holds so much importance as the effectiveness of a drug or, a procedure on a select group of patients is tested. The process involves many stages of testing and it could be time-consuming and not to mention the high level of risk factors involved in the process. The trials often go through delays that result in money loss and there is risk involved too as side effects of a specific drug or a component can be life-threatening. However, big data can help in so many ways here, to begin with, it could help filtering patients by analyzing several factors like genetics and select the ones who are eligible for the trials. Furthermore, the patients who are participating in clinical trials could also be monitored in real-time. Even the possible side effects could also be predicted and in turn, would save lives.

Successful sales and marketing efforts

The pharmaceutical industry can see a great difference in marketing efforts if only they use data-driven insight. Analyzing the data the companies could identify the locations and physicians ideal for the promotion of their new drug. They can also identify the needs of the patients and could target their sales representative teams towards that location. This would take the guesswork out of the process and increase the chance of getting a higher ROI. The data can also help them predict market trends as well as understand customer behavior. Another factor to consider here is monitoring the market response to a particular drug and also its performance, as this would help fine-tune marketing strategies.

Collaborative efforts

With the help of data, there could be better collaboration among the different segments that directly impact the industry. The companies could suggest different drugs that could be patient-specific and the physicians could use real-time patient data to decide whether the suggestions should be implemented in the treatment plan. There could be internal and external collaborations as well to improve the overall industry functioning. Be it reaching out to researchers or, CROs, establishing a strong link can help the industry move further.

Predictive analysis

A new drug might be effective in handling a particular health issue and could revolutionize the treatment procedure but, the presence of certain compounds might prove to be fatal for certain patients and drug toxicity if not detected at an early stage could endanger a particular patient. So, using predictive analysis a patient data could be analyzed to determine the genetic factors, disease history, as well as lifestyle. The smart algorithms thereby help identify the risk factors and makes it possible to take a personalized approach regarding medication that could prove to be more effective rather than some random medication.

Big data can increase the efficiency of the pharmaceutical industry in more ways than one, but compared to other industries somehow this industry still hasn’t been able to utilize the full potential of big data, due to factors like privacy and, monetary issues. The lack of trained professionals could also prove to be a big obstacle. Sending their select professionals for Data Science training, could prove to be a big boon for them in the future.


.

Bringing Back Science into “Data Science”

Bringing Back Science into “Data Science”

Far from the conventional science disciplines, like physics or mathematics, Data Science is a budding discipline: which means there are no proper definition to explain what data science is and what role it does play.

Nevertheless, the internet is full of working definitions of data science. As per Wikipedia, Data Science is

(an) interdisciplinary field about processes and systems to extract knowledge or insights from data in various forms, either structured or unstructured, which is a continuation of some of the data analysis fields such as statistics, data mining, and predictive analytics.

To that note, a very important aspect is left behind in this explanation: Data Science is a science first, which means a proper scientific method should be devised to tackle different data science practices. By scientific method, we mean a healthy process of asking questions, collecting information, framing hypothesis and analyzing the results to draw conclusions thereafter.

Go below, the process breakup is as follows..

Ask questions

Start by asking what is the business problem? How to leverage maximum gains? What ways to implement to increase return on investment? The finance industry takes help from data science for myriad reasons. One of the most striking reasons is to enhance the return on investment out of marketing campaigns.

What Sets Apart Data Science from Big Data and Data Analytics – @Dexlabanalytics.

Collect data

A predictive modeling analyst has access to vast data resources, which eventually makes the entire research and gathering data process much less complex. However, it is only in theory, because rarely data is stored in the desired format an analyst wants, making his job easier.

Data Science – then and now! – @Dexlabanalytics.

Devise a hypothesis

After getting to the heart and soul of the problem, we start to develop hypotheses. For example, you believe your firm’s profit is leveraged by an optimistic customer reaction towards your product quality and positive advertising capabilities of your firm. Through this example, we explained a nomological network, where you are in a position to infer casualties and correlations. While dealing in Data Science, assessing customer perception is very crucial, and so is the analysis of financial datasets.

Data Science: Is It the Right Answer? – @Dexlabanalytics.

Testing and experiments

Formulating a hypothesis is not enough; a predictive modeler relies on statistical modeling techniques to forecast the future in a probabilistic manner. Keep a note, this doesn’t result in indicating “X will occur”, instead it refers “Given Y, the probability of X occurring is 75%.”

Any proper experiment includes control groups and test, meaning a modeler when preparing a predictive model should divide the dataset so as to ensure availability of few data for testing predictive equation.

Now, if we talk about marketing – consider logistic regression. It offers a probability whether a binary event of interest will take place or not.

Enroll in an R Predictive Modelling Certification program to go through the mechanics of this problem. Reach us at DexLab Analytics.

Tracing Success in the New Age of Data Science – @Dexlabanalytics.

Evaluate results and infer conclusions

Now is the time to make a decision: do you prefer the quantitative approach? As social media is totally unstructured, the qualitative approach needs to be implemented using Natural Language Processing, which can be a tad difficult. Now, how about making a longitudinal analysis, while transforming data into time series? Do all these questions rake your mind? Yes? Then you are on the right track.

Keep Pace with Automation: Emerging Data Science Jobs in India – @Dexlabanalytics.

Reporting of results

This is the final battle scene for all predictive modelers. It calls for all the documents, based on which a modeler made his decision during the development process. All the assumptions taken have to be identified and highlighted beside the results.

And with it comes the end of our Science in Data Science process!

For more interesting updates and blogs, follow us at DexLab Analytics. Opt for our impressive Data Science Courses in gurgaon and lead the road of success!


Interested in a career in Data Analyst?

To learn more about Data Analyst with Advanced excel course – Enrol Now.
To learn more about Data Analyst with R Course – Enrol Now.
To learn more about Big Data Course – Enrol Now.

To learn more about Machine Learning Using Python and Spark – Enrol Now.
To learn more about Data Analyst with SAS Course – Enrol Now.
To learn more about Data Analyst with Apache Spark Course – Enrol Now.
To learn more about Data Analyst with Market Risk Analytics and Modelling Course – Enrol Now.

Call us to know more