Data Science Courses in Noida Archives - Page 2 of 6 - DexLab Analytics | Big Data Hadoop SAS R Analytics Predictive Modeling & Excel VBA

Business Intelligence: How to Enhance User Adoption?

Business Intelligence: How to Enhance User Adoption?

For business modernization, smart business intelligence solution is the key. Getting to the crux and leveraging vast pools of data that companies gain access to triggers encompassing digital transformation. BI tools not only let companies grasp the data but also develop actionable insights to smoothen the impactful decision-making capabilities and take companies towards future progress.

It’s not an out of ordinary kind of concept, for half a decade, companies have been utilizing these kinds of tools for better efficiency and productive outcomes, yet user adoption for BI tool remains relatively low.

2

Reasons behind Lower User Adoption of Business Intelligence:

Guys at the helm of company affairs, including Chief Information Officers, Chief Technology Officers and Chief Data Officers may think it’s high time to incorporate Business Intelligence tools for smarter operations, but it may not have the same effect on the employees. Employees may not be much inspired!

It holds truer, especially for those employees, who have been in the workforce for long and haven’t for once used such intricate, new-age tools to decipher what data says. For them, old is gold – they prefer to continue their own kind of data analysis in the same way they have been doing for so many years.

How Companies Can Improve Data-Driven Mindsets?

In order to be ahead of the curve, the data mindset of the workforce needs to be changed. If businesses have to be completely data-driven, they can’t just take Business Intelligence lightly.

Here are a few ways business can drive user adoption of BI:

Introduce BI as a necessity, not luxury

Once understanding company data was considered as an added advantage to normal work procedures. But, in this age of digital transformation, it’s no longer a luxury but a necessity. And sooner the employees realize this, the better it becomes.

Employees across organizations should have thorough access to data. It boosts decision-making. By going completely data-driven, business intelligence user adoption will automatically improve. Along with employees, businesses too will benefit a lot from such adoption.

Promote Favorable Impacts of BI

Putting light on success stories of BI implementation helps! It’s being regarded as a powerful way to encourage budding data scientists and already in-workforce employees: the powerful impression of BI and its significant impacts on key performance indicators will tell a different story to the world.

The best way of doing it would be by developing an internal case study that will elucidate how a team after incorporating Business Intelligence fulfilled their desired organizational goals. For best results, let a manager or C-level employee present the case study to the workforce. Surely, this will enhance levels of user adoption of BI.

Continuous Training is a Must

Business Intelligence calls for no one-track solutions; the concept deals with almost endless opportunities, which means continuous training initiatives should be taken up to explore every facet of this cutting edge tool.

When an employee have deeper knowledge about a particular tool, they are more likely to derive maximum benefits out of it. So, by giving continuous training, through various FAQs, webinars and video tutorials, employees can now become very easily completely data-driven.

Now, following these easy yet effective tips, business leaders can increase their lower rates of BI adoption and stride towards full digital transformation of their companies, triggering impactful future goals.

Want to know more about Data Science Courses in Noida? Drop by DexLab Analytics; for a fulfilling learning experience, opt for their Data Science Courses. They are simply excellent and student-friendly. 

 
The blog has been sourced from — www.sisense.com/blog/make-business-intelligence-necessity-drive-user-adoption
 

Interested in a career in Data Analyst?

To learn more about Data Analyst with Advanced excel course – Enrol Now.
To learn more about Data Analyst with R Course – Enrol Now.
To learn more about Big Data Course – Enrol Now.

To learn more about Machine Learning Using Python and Spark – Enrol Now.
To learn more about Data Analyst with SAS Course – Enrol Now.
To learn more about Data Analyst with Apache Spark Course – Enrol Now.
To learn more about Data Analyst with Market Risk Analytics and Modelling Course – Enrol Now.

A Comprehensive Study on Analytics and Data Science India Jobs 2018

A Comprehensive Study on Analytics and Data Science India Jobs 2018

India accounts for 1 in 10 data science job openings worldwide – with about 90,000 vacancies, India ranks as the second-biggest analytics hub, next to the US – according to a recent study compiled by two renowned skilling platforms. The latest figure shows a 76% jump from the last year.

With the advent of artificial intelligence and its overpowering influence, the demand for skill-sets in machine learning, data science and analytics is increasing rapidly. Job creation in other IT fields has hit a slow-mode in India, making it imperative for people to look towards re-skilling themselves with new emerging technologies… if they want to stay relevant in the industry. Some newer roles have also started mushrooming, with which we are not even acquainted now.

2

Top trends in analytics jobs in 2018 as follows:

  • The total number of data science and analytics jobs nearly doubled from 2017 to 2018.
  • There’s been a sharp contrast in the percentage increase of analytics job inventory in the past years – from 2015 to 2016, the number of analytics jobs increased by 52%, which increased by only 40% from 2014 to 2015.
  • Currently, if we go by the reports, nearly 50000 analytics job positions are currently available to get filled by suitable candidates. Although the exact numbers are difficult to ascertain.
  • Amazon, Goldman Sachs, Citi, E&Y, Accenture, IBM, HCL, JPMorgan Chase, KPMG and Capgemini – are 10 top-tier organizations with the highest number of analytics opening in India.

City Figures

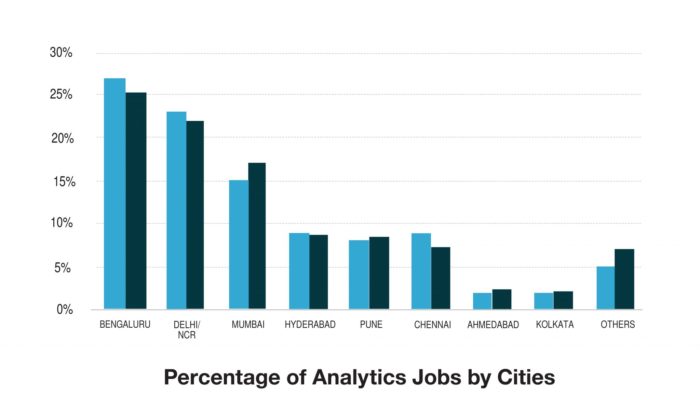
Bengaluru is the IT hub of India and accounts for the largest share of the data science and analytics jobs in India. Approximately, it accounted for 27% of jobs till the quarter of the last year.

Tier-II cities also witnessed a surging trend in such roles from 7% to 14% in between 2017 and 2018 – as startups started operating out of these locations.

Delhi/NCR ranks second contributing 22% analytics jobs in India, followed by Mumbai with 17%.

Industry Figures

Right from hospitality, manufacturing and finance to automobiles, job openings seem to be in every sector, and not just limited to hi-tech industries.

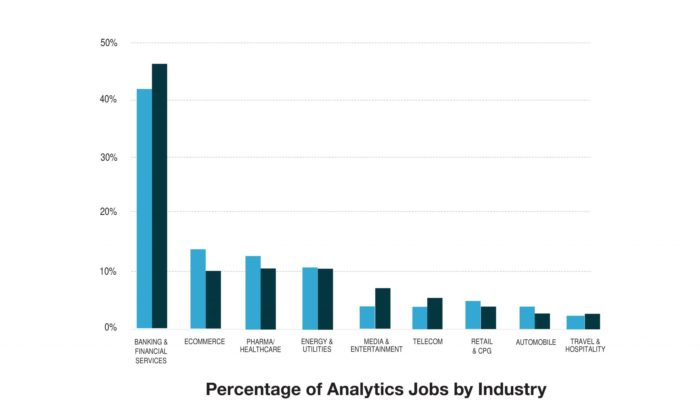
Banking and financial sector continued to be the biggest job drivers in analytics domain. Almost 41% of jobs were posted from the banking sector alone, though the share fell from last year’s 46%.

Ecommerce and media and entertainment followed the suit and contributed to analytics job inventory. Also, the energy and utilities seem to have an uptick in analytics jobs, contributing to almost 15% of all analytics jobs, 4% hike from the last year’s figure.

Education Requirement Figures

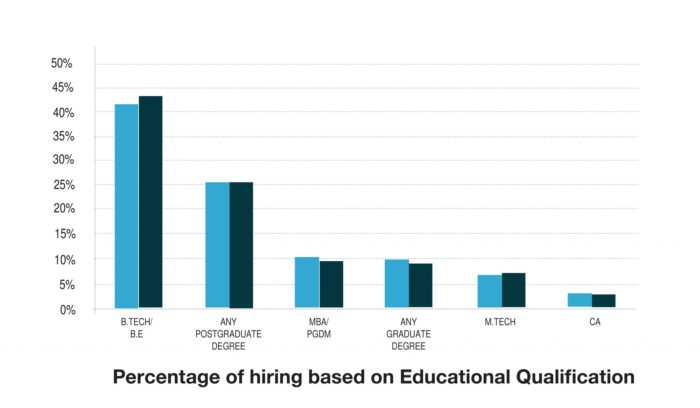
In terms of education, almost 42% of data analytics job requirements are looking for a B.Tech or B.E degree in candidates. 26% of them prefer a postgraduate degree, while only 10% seeks an MBA or PGDM.

In a nutshell, 80% of employers resort to hiring analytics professionals who have an engineering degree or a postgraduate degree.

As a result, Data analyst course has become widely popular. It’s an intensive, in-demand skill training that is intended for business, marketing and operations managers, data analyst and professionals and financial industry professionals. Find a reputable data analyst training institute in Gurgaon and start getting trained from the experts today.


The article has been sourced from:

https://qz.com/1297493/india-has-the-most-number-of-data-analytics-jobs-after-us

https://analyticsindiamag.com/analytics-and-data-science-india-jobs-study-2017-by-edvancer-aim


Interested in a career in Data Analyst?

To learn more about Data Analyst with Advanced excel course – Enrol Now.
To learn more about Data Analyst with R Course – Enrol Now.
To learn more about Big Data Course – Enrol Now.

To learn more about Machine Learning Using Python and Spark – Enrol Now.
To learn more about Data Analyst with SAS Course – Enrol Now.
To learn more about Data Analyst with Apache Spark Course – Enrol Now.
To learn more about Data Analyst with Market Risk Analytics and Modelling Course – Enrol Now.
How Aspiring Data Scientists Should Choose a Suitable Programming Language for Data Science

How Aspiring Data Scientists Should Choose a Suitable Programming Language for Data Science

Data science is a fascinating and one of the fastest growing fields in the world to work in. This is why it’s becoming increasingly popular for data scientists to consider the potentials of programming languages-they form an integral part of data science.

Possessing incredible skills of programming instantly pumps up the chances of bagging a high-profile data science job, whereas the novices, who have never studied programming in their entire life have to struggle hard.

However, this is not all – only a sack of all-round programming skills won’t help you grab the sexiest job of 21st century, there are several things to consider before you set off on becoming a successful data scientist. And they are as follows:

Generality

For a true blue data scientist, it’s not enough to possess encompassing programming skills but also the aptitude for crunching numbers. Remember, a data scientist’s day is largely spent on sourcing and processing raw data for the purpose of data cleaning – no amount of smart set of programming languages or machine learning models would be of any help.

2

Specificity

In advanced data science, learning knows no bounds – each time you get to reinvent something new. Learn to ace a wide array of packages and modules available in a chosen language. However, the extent of the use and application is subject to the domain-particular packages you are working on.

Performance

In few cases, optimizing the performance of the codes is essential, especially when tackling huge volumes of crucial data. Compiled languages are normally faster as compared to interpreted ones; in the same way, statically typed languages are more fail-proof than dynamically typed. As a result, an apparent trade-off exists against productivity.

With all these in mind, it’s time to delve into the most popular languages used in the field of data science – let’s start with R – it’s the most powerful open source language used for a gamut of statistical and data visualization applications, including neural networks, advanced plotting, non-linear regression, phylogenetics and lot more.

Next, we can’t help but brag about an excellent all-rounder – Python – a top notch programming language choice for all types of data scientists, seasoned and freshers. A large chunk of the data science process revolves around the cutting edge ETL process – this makes Python a universal language to excel at. Google’s Tensorflow is an added bonus point.

Lastly, SQL tops rank as a leading data processing language instead of being just an advanced analytical tool. Owing to its longevity and efficiency, SQL is deemed to be one of the most powerful weapons that modern data scientist should know of.

Parting Thoughts

In the end of the discussion, we now have a set of languages to consider for excelling data science – what you need to do is comprehend your usage requirements and compare generality, specificity and performance factors. This will help you surge towards a successful career minus the complexities associated.

DexLab Analytics offers top of the line Data Science Courses in Delhi for data enthusiasts. If you are interested in a data analyst course in Noida, drop by this esteemed institute and navigate through our in-demand courses.


The blog has been sourced from – 

https://medium.freecodecamp.org/which-languages-should-you-learn-for-data-science-e806ba55a81f

https://towardsdatascience.com/what-programming-language-should-aspiring-data-scientists-learn-875017ad27e0

http://bigdata-madesimple.com/how-i-chose-the-right-programming-language-for-data-science


Interested in a career in Data Analyst?

To learn more about Data Analyst with Advanced excel course – Enrol Now.
To learn more about Data Analyst with R Course – Enrol Now.
To learn more about Big Data Course – Enrol Now.

To learn more about Machine Learning Using Python and Spark – Enrol Now.
To learn more about Data Analyst with SAS Course – Enrol Now.
To learn more about Data Analyst with Apache Spark Course – Enrol Now.
To learn more about Data Analyst with Market Risk Analytics and Modelling Course – Enrol Now.
Data Aspirants, Consider These 4 Career Options & Jazz-up Number Games!

Data Aspirants, Consider These  4 Career Options & Jazz-up Number Games!

Is crunching numbers your favorite hobby?

Are you interested in deciphering how many people use smartphones, regularly?

Do you feel fascinated by the way businesses use data to frame decisions?

If yes, then you are at the right place – a career, where you could leverage this inquisitiveness and knack for numbers is just carved for you. Not necessarily it has to be data science career option, but we’ve charted down top 5 career choices for the data curious you!

Data Scientist

Tagged as the sexiest job of 21st century, data scientist jobs are irresistible. First of all, the field of data science is expanding steadfastly – IBM prediction says the demand for data scientists will increase by 28% by the end of 2020. This brings good news for job seekers, who are on toes to enter the fascinating world of data science, where the salaries are pumping up – already they have touched six figures.

The main objective of data scientists is to collect meaningful data to help businesses formulate strategic decisions. Cleaning up and structuring the data is of primary importance – followed by cutting edge tool implementation, such as algorithms, statistical models and deep learning structures – all of them aids in extracting insights out of relevant data.

Statistician

Other than data geeks, very few love the very idea of becoming a statistician. But for guys who love churning data, the role of statistician is the most fascinating in the world. They help solve the toughest problem with data, while finding and providing answers to crucial questions.

Statisticians’ aptitude for numbers knows no bounds – and the range of projects on which they work is diverse. From ascertaining unemployment rates to nabbing the discerning the effectiveness of prescription drugs to calculating the number of endangered animals living in a given area – from designing the strategies for data collection to nabbing the latest trends, statisticians need to juggle between a lot of tasks, and solve crucial problems.

Computer Scientist

The computers are lifeline of today’s businesses – so jobs related to computing power is selling like hot cakes. The field of computer science is encompassing – nerds in love with data can discover a treasure trove of career options under this umbrella term. If you are a true blue crime buff, choose computer forensics as your leading career option. Or else, are you a major computer game aficionado? Then aspire to become a game developer or architect.

 Today, software developers and architects are witnessing surging demand, and most of the jobs in this technology domain help draw salaries over $100000 annually. So, what you waiting for?!

2

Database Administrator

Data is next to oil; of late, it’s been treated as a valuable resource. Thus, we should look for ways to keep it safe and well-protected. Database administrators are ideal for this defensive job. They not only toil to set up fortified databases but also are responsible for maintenance, model up-keeping and implementing security measures. Undeniably, it’s one of the most challenging jobs in the world of data but at the same time, it’s also the most rewarding one – at present, it ranks as the world’s #7 best technology job, according to a notable US tabloid.

Done reading? Now, data-lovers, when are you taking the next step to turn your avocation into your vocation? Pretty soon, right!

Quick Note: DexLab Analytics is offering state of the art Data Science Courses at affordable prices. For more details on Data Science Certification, visit the official page today.


The blog has been sourced from – dataconomy.com/2018/06/five-careers-to-consider-for-data-enthusiasts


Interested in a career in Data Analyst?

To learn more about Data Analyst with Advanced excel course – Enrol Now.
To learn more about Data Analyst with R Course – Enrol Now.
To learn more about Big Data Course – Enrol Now.

To learn more about Machine Learning Using Python and Spark – Enrol Now.
To learn more about Data Analyst with SAS Course – Enrol Now.
To learn more about Data Analyst with Apache Spark Course – Enrol Now.
To learn more about Data Analyst with Market Risk Analytics and Modelling Course – Enrol Now.
How Data Science Is Getting Better, Day by Day?

HOW DATA SCIENCE IS GETTING BETTER, DAY BY DAY?

In the latest Star Wars movie, the character of Rose Tico – a humble maintenance techie with a talent for tinkering is relatable; her role expands and responsibilities increase as the movie gets going, just like our data scientists. A chance encounter with Finn puts her into the frontlines of action, and by the end of the movie, she’s flying ski-speeders in the new galactic civil war, one of the most critical battles in the movie – with time, her role becomes more complex and demanding, but she never quivers and embraces the challenges to get the job done.

A lot many data scientists draw similarities with Rose’s character. In the last 5 years, the job role and responsibility of data analysts has undergone an unrecognizable change – as data proliferation is increasing in capacity and complexity, the responsibility is found shifting base from dedicated consultants to cross-functional, highly-skilled data teams, proficient enough in integrating skills together. Today’s data consultants need to complete tasks collaboratively to formulate trailblazing analysis that let businesses predict future success and growth pattern, effectively.

Get excellent data science certification from DexLab Analytics.

Quite conventionally, the intense role of prediction falls on the sophisticated crop of data scientists, while business analysts are more oriented towards measuring churn. On the other hand, intricate tasks, like model construction or natural language processing are performed by an elite team of data professionals, armed with strong engineering expertise.

Said differently, the emergence of data manipulation languages, such as R and Python is surging – owing to their extensive usage and adaptability, businesses are biased towards implementing these languages for advanced analysis. Drawing inspiration from Rose’s character, each data scientist should adapt to newer technology and expectations, and enhance expertise and skills that’s needed for the new role.

However, acing the cutting edge programming languages and tools isn’t enough for the challenge – today, data teams need to visualize their results, like never before. The insights churned out of advanced machine learning are curated for consumption by business pioneers and operation teams. Thus, the results have to be crisp, clear and creatively presented. As a result, predictive tools are being combined with effective capability of Python and R with which analysts and stakeholders are quite familiar.

The whole big data industry is changing, and the demand for skilled big data analysts is sky-rocketing. In this tide of change, if you are not relying on advanced data analysis tools and predictive analytics, you are going to lag behind. Companies that analyze data, boost decision-making, and observe social media trends – changing with time – will have immense advantages over companies that don’t pay attention to these crucial parameters.

2

No second thoughts, it’s an interesting time for data aspirants to make significant impacts in the whole data community and trigger fabulous business results. For professional training or to acquire new skills – drop by DexLab Analytics – their data Science Courses in Noida are outstanding.

The blog has been sourced from  dataconomy.com/2018/02/whole-new-world-data-teams


Interested in a career in Data Analyst?

To learn more about Data Analyst with Advanced excel course – Enrol Now.
To learn more about Data Analyst with R Course – Enrol Now.
To learn more about Big Data Course – Enrol Now.

To learn more about Machine Learning Using Python and Spark – Enrol Now.
To learn more about Data Analyst with SAS Course – Enrol Now.
To learn more about Data Analyst with Apache Spark Course – Enrol Now.
To learn more about Data Analyst with Market Risk Analytics and Modelling Course – Enrol Now.
Estimator Procedure under Simple Random Sampling: EXPLAINED

Estimator Procedure under Simple Random Sampling: EXPLAINED

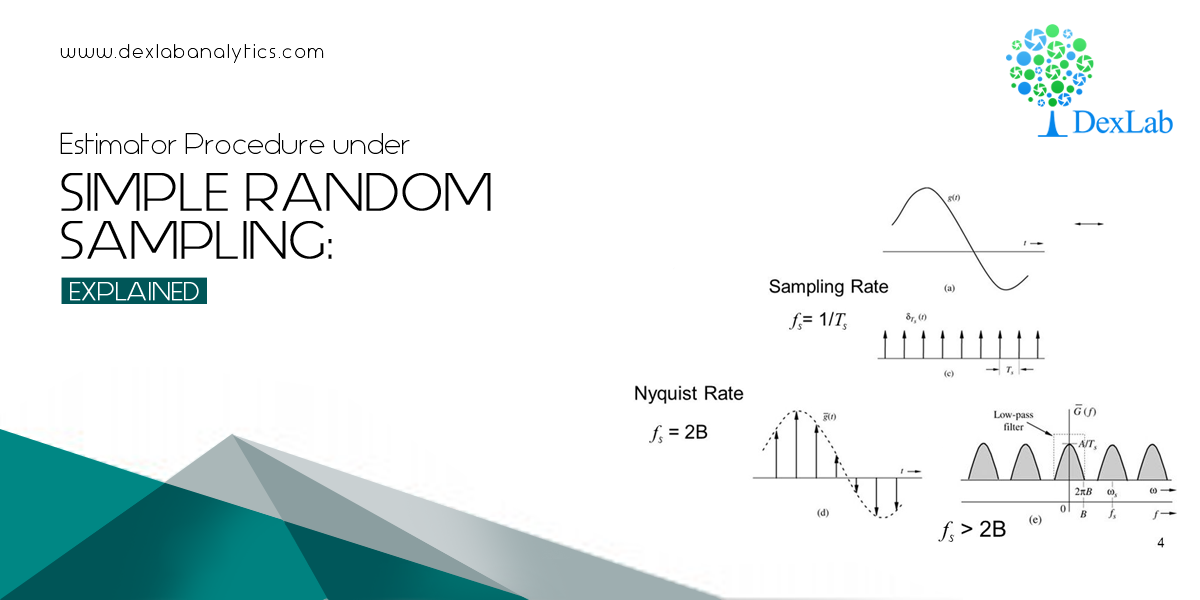
In continuation with the previous introductory blog on sampling: An ABC Guide to Sampling Theory, we will take a closer look into the concept of the estimator procedure under Simple Random Sampling with the help of mathematical examples. It will help us understand the underlying phenomenon, the manner to be precise in which the estimator function of sampling works.

Simple random sampling (SRS) is a method of selecting a sample comprising ‘n’ number of sampling units out of the population of ‘N’ number of sampling units such that every sampling unit has an equal chance of being chosen.

The Estimator Procedure under Simple Random Sampling

The process of selection of a sample under SRS (Simple Random Sampling) is random. This means, each number of the population has an equal probability of getting selected, which makes each of the observation identical and independently distributed.

The statistic chosen by the investigation of estimation of random samples need to satisfy a set of certain properties given below:

  1. Unbiasedness
  2. Consistency
  3. Sufficiency
  4. Efficiency

As a matter of fact, investigation is always about coming up with an idea regarding the population parameters based on the sample observations. The best part would be to formulate an unbiased, consistent estimator, which is also efficient. Normally, a sample mean for a set of sample observations is considered to be a very desirable estimator to form ideas about population parameters.

In detail, let’s examine the relevance of each of the properties of an estimator:

Unbiasedness of an estimator

Take a look at the below examples to understand the very idea of unbiasedness.

Example 1:

Answer:-

According to the problem, we have

Adding (1) & (2), we get,

So, from (3), we get:-

 is called an unbiased estimators for .

Now, subtracting (2) & (1), we get –

Example 2:

Assume that an investigator draws a sample from this population using SRSWR. Then show that the sample mean is an unbiased estimator for the population mean.

Now, by specification we have:-

We are redefined to show that:-

L.H.S  :

DexLab Analytics Presents #BigDataIngestion

DexLab Analytics Presents #BigDataIngestion


Data sampling is the key to business analytics and data science. On that note, DexLab Analytics offers state of the art Data Science Certification for all data enthusiasts. Recently, they have organized a new admission drive #BigDataIngestion offering exclusive 10% off on in-demand courses, including big data, machine learning and data science courses.


Interested in a career in Data Analyst?

To learn more about Data Analyst with Advanced excel course – Enrol Now.
To learn more about Data Analyst with R Course – Enrol Now.
To learn more about Big Data Course – Enrol Now.

To learn more about Machine Learning Using Python and Spark – Enrol Now.
To learn more about Data Analyst with SAS Course – Enrol Now.
To learn more about Data Analyst with Apache Spark Course – Enrol Now.
To learn more about Data Analyst with Market Risk Analytics and Modelling Course – Enrol Now.

Enjoy 10% Discount, As DexLab Analytics Launches #BigDataIngestion

Enjoy 10% Discount, As DexLab Analytics Launches #BigDataIngestion

This summer, DexLab Analytics, a pioneering analytics training institute in Delhi is back in action with a whole new admission drive for prospective students: #BigDataIngestion with exclusive discount deals on offer. With an aim to promote an intensive data culture, we have launched Summer Industrial Training on Big Data Hadoop/Data Science. An exclusive 10% discount is on offer for all interested candidates. And, the main focus of the admission drive is on Hadoop, Data Science, Machine Learning and Business Analytics certification.

Data analytics is deemed to be the sexiest job of the 21st century; it’s comes as no surprise that young aspirants are more than eager to grasp the in-demand skills. Especially for them and others, DexLab Analytics emerges as a saving grace. Our state of the art certification training is completely in sync with the vision of providing top-of-the-line quality analytics coaching through fine approaches and student-friendly curriculum.

2

That being said, #BigDataIngestion is one of its kinds; while Hadoop and Data Science modules are targeted towards B. Tech and B.E students, Data Science and Business Analytics modules are exclusively oriented for Eco, Statistics and Mathematics students. The comprehensive certification courses help students embark on a wishful journey across various big data domains and architectures, triggering high-end IT jobs, but to avail the high-flying discount offer, the students need to present a valid ID card, while enrolling for the courses.

We are glad to announce that already the institute has gathered a good reputation through its cutting edge, open-to-all demo sessions. The demo sessions has helped countless prospective students in understanding the quality of courses and the way they are being imparted. Now, the new offer announced by the team is like an icing on the cake – 10% discount on in-demand big data courses sounds too alluring! And the admission procedure is also as easy as pie; you can either drop by the institute in person, or else can opt for online registration.

In this context, the spokesperson of DexLab Analytics stated, “We are glad to play an active role in the process of development and condoning of data analytics skills amongst the data-friendly students’ community of the country. We go beyond traditional classroom training and provide hands-on industrial training that will enable you to approach your career with confidence”. He further added, “We’ve always been more than overwhelmed to contribute towards the betterment of skilled human resources of the nation, and #BigDataIngestion is no different. It’s a summer industrial training program to equip students with formidable data skills for a brighter future ahead.”

For more information or to register online, click here: DexLab Analytics Presents #BigDataIngestion

#BigDataIngestion: DexLab Analytics Offers Exclusive 10% Discount for Students This Summer

Interested in a career in Data Analyst?

To learn more about Data Analyst with Advanced excel course – Enrol Now.
To learn more about Data Analyst with R Course – Enrol Now.
To learn more about Big Data Course – Enrol Now.

To learn more about Machine Learning Using Python and Spark – Enrol Now.
To learn more about Data Analyst with SAS Course – Enrol Now.
To learn more about Data Analyst with Apache Spark Course – Enrol Now.
To learn more about Data Analyst with Market Risk Analytics and Modelling Course – Enrol Now.

An ABC Guide to Sampling Theory

An ABC Guide to Sampling Theory

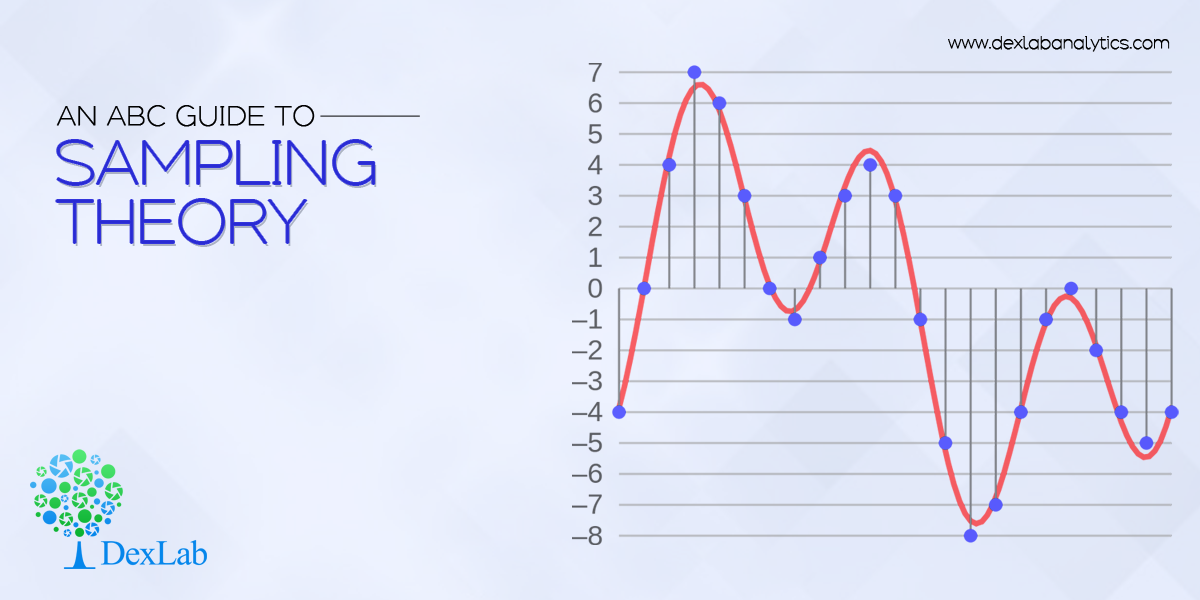
Sampling theory is a study involving collection, analysis and interpretation of data accumulated from random samples of a population. It’s a separate branch of statistics that observes the relationship existing between a population and samples drawn from the population.

In simple terms, sampling means the procedure of drawing a sample out of a population. It aids us to draw a conclusion about the characteristics of the population after carefully studying only the objects present in the sample.

Here we’ve whisked out a few sampling-related terms and their definitions that would help you understand the nuanced notion of sampling better. Let’s have a look:

Sample – It’s the finite representative subset of a population. It’s chosen from a population with an aim to scrutiny its properties and principles.

Population – When a statistical investigation focuses on the study of numerous characteristics involving items on individuals associated with a particular group, this group under study is known as the population or the universe. A group containing a finite number of objects is known as finite population, while a group with infinite or large number of objects is called infinite population.

Population parameter – It’s an obscure numerical factor of the population. It’s no brainer that the primary objective of a survey is to find the values of different measures of population distribution; and the parameters are nothing but a functional variant inclusive of all population units.

2

Estimator – Calculated based on sample values, an estimator is a functional measure.

Sampling fluctuation of an estimator – When you draw a particular sample from a given population, it contains different set of population members. As a result, the value of the estimator varies from one sample to another. This difference in values of the estimator is known as the sampling fluctuations of an estimator.

Next, we would like to discuss about the types of sampling:

There are mainly two types of random sampling, and they are as follows:

Simple Random Sampling with Replacement

In the first case, the ‘n’ units of the sample are drawn from the population in such a way that at each drawing, each of the ‘n’ numbers of the population gets the same probability 1⁄N of being selected. Hence, this methods is called the simple random sampling with replacement, clearly, the same unit of population may occur more than once inj a simple. Hence, there are N^n samples, regard being to the orders in which ‘n’ sample unit occur and each such sample has the probability 1/N^n .

Simple Random Sampling Without Replacement

In the second case each of the ‘n’ members of the sample are drawn one by one but the members once drawn are not returned back to the population and at each stage remaining amount of the population is given the same probability of being includes in the sample. This method of drawing the sample is called SRSWOR therefore under SRSWOR at any r^th number of draw there remains (N-r+1) units. And each unit has the probability of 1/((N-r+1) ) of being drawn.

Remember, if we take ‘n’ individuals at once from a given population giving equal probability to each of the observations, then the total number of possible example in (_n^N)C i.e.., combination of ‘n’ members out of ‘N’ numbers of the population will from the total no. of possible sample in SRSWOR.

The world of statistics is huge and intensively challenging. And so is sampling theory.

But, fret now. Our data science courses in Noida will help you understand the nuances of this branch of statistics. For more, visit our official site.  

P.S: This is our first blog of the series ‘sampling theory’. The rest will follow soon. Stay tuned.


Interested in a career in Data Analyst?

To learn more about Data Analyst with Advanced excel course – Enrol Now.
To learn more about Data Analyst with R Course – Enrol Now.
To learn more about Big Data Course – Enrol Now.

To learn more about Machine Learning Using Python and Spark – Enrol Now.
To learn more about Data Analyst with SAS Course – Enrol Now.
To learn more about Data Analyst with Apache Spark Course – Enrol Now.
To learn more about Data Analyst with Market Risk Analytics and Modelling Course – Enrol Now.
Here’s How Technology Made Education More Enjoyable and Interactive

Here’s How Technology Made Education More Enjoyable and Interactive

Technology is revamping education. The entire education system has undergone a massive change, thanks to technological advancement. The institutions are setting new goals and achieving their targets more effectively with the help of new tools and practices. These cutting edge methods not only enhances the learning approach, but also results in better interaction and fuller participation between teachers and students.

The tools of technology have turned students into active learners; they are now more engaged with their subjects. In fact, they even discover solutions to the problems on their own. The traditional lectures are now mixed with engaging illustrations and demonstrations, and classrooms are replaced with interactive sessions in which students and teachers both participate equally.

Let’s take a look at how technology has changed the classroom learning experience:

Online Classes

No longer, students have to sit through a classroom all day. If a student is interested in a particular course or subject, he or she can easily pursue degrees online without going anywhere. The internet has made interactions between students and teachers extremely easy. From the comfort of the home, anyone can learn anything.

DexLab Analytics offers Data Science Courses in Noida. Their online and classroom training is over the top.

Free educational resources found online

The internet is full of information. From a vast array of blogs, website content and applications, students as well as teachers can learn anything they desire to. Online study materials coupled with classroom learning help the students in strengthening their base on any subject as they get to learn concepts from different sources with examples and practice enough problems. This explains why students are so crazy for the internet!

2

Webinars and video streaming

The facilitators and educationists are nowadays looking up to video streaming to communicate ideas and knowledge to the students. Videos are anytime more helpful than other digital communications; they help deliver the needful content, boosting the learning abilities among the learners, while making them understand the subject matter to the core. Webinars (seminars over the web) replaces classroom seminars; teachers look up to new methods of video conferencing for smoother interaction with the students.

Podcasts

Podcasts are digital audio files. Users can easily download them. They are available over the internet for a bare subscription fee. It’s no big deal to create podcasts. Teachers can easily create podcasts that syncs well with students’ demand, thus paving a way for them to learn more efficiently. In short, podcasts allow students a certain flexibility to learn from anywhere, anytime.

Laptops, smartphones and tablets

For a better learning experience overall, both students and teachers are looking forward to better software and technology facilities. A wide number of web and mobile applications are now available for students to explore the wide horizon of education. The conventional paper notes are now replaced with e-notes that are uploaded on the internet and can be accessible from anywhere. Laptops and tablets are also used to manage course materials, research, schedules and presentations.

No second thoughts, by integrating technology with classroom training, students and teachers have an entire world to themselves. Sans the geographical limitations, they can now explore the bounties of new learning methods that are more fun and highly interactive.

DexLab Analytics appreciates the power of technology, and in accordance, have curated state of the art Data Science Courses that can be accessed both online and offline for students’ benefit. Check out the courses NOW!


The article has been sourced from – http://www.iamwire.com/2017/08/technology-teaching-education/156418


Interested in a career in Data Analyst?

To learn more about Data Analyst with Advanced excel course – Enrol Now.
To learn more about Data Analyst with R Course – Enrol Now.
To learn more about Big Data Course – Enrol Now.

To learn more about Machine Learning Using Python and Spark – Enrol Now.
To learn more about Data Analyst with SAS Course – Enrol Now.
To learn more about Data Analyst with Apache Spark Course – Enrol Now.
To learn more about Data Analyst with Market Risk Analytics and Modelling Course – Enrol Now.

Call us to know more