Data Science Courses in gurgaon Archives - Page 3 of 4 - DexLab Analytics | Big Data Hadoop SAS R Analytics Predictive Modeling & Excel VBA

A Regression Line Is the Best Fit for the Given PRF If the Parameters Are OLS Estimations – Elucidate

A Regression Line Is the Best Fit for the Given PRF If the Parameters Are OLS Estimations - Elucidate

Regression analysis is extensively used in business applications. It’s one of the most integral statistical techniques that help in estimating the direction and strength between two or more (financial) variables – thus determining a company’s sales and profits over the past few years.

In this blog, we have explained how a regression line is the best fit for a given PRF if the parameters are all OLS estimations.

The OLS estimators for a given regression line has been obtained as: a = y ̅ – bx ̅ and b = (Cov(x,y))/(v(x)). The regression line on the basis of these OLS estimate has been given as: Y ̂_ i-Y ̅ = b(x_i-x ̅ )….. (1)

The regression line (1) constructed above is a function of the least square i.e. the parameters of the regression equation have been selected so that the residual sum of squares is minimized. Thus, the estimators ‘a’ & ‘b’ explains the population parameters, the best relative to any other parameters. Given, the linearity of the parameters, these estimators share the minimum variations with the population parameters, i.e. they explain the maximum variations in the model, in relation to the population parameters, as compared to any other estimators, in a class of unbiased estimators.

Thus, the regression line would be the ‘best fit’ for a given PRF. If ‘a’ & ‘b’ are best linear unbiased estimators for  respectively. Thus, to show ‘best fit’, we need to prove:

  1. To ‘b’ is Best unbiased estimator for :-

From the OLS estimation; we have ‘b’ as:

i.e.b is a linear combination of w’is & y’is.

Hence; ‘b’ is a linear estimator for β. Therefore, the regression line would be linear in parameters as far as ‘b’ is concerned.

Now,

Let us test for the prevalence of this conditions:

For unbiasedness, we must have :- E(b)=β. To test this, we take expectation on both sides of (3) & get:

From (1) & (4) we can say that ‘b’ is a linear unbiased estimator for β.

To check whether ‘b’ is the best estimator or not we need to check whether it has the minimum variance in a class of linear unbiased estimator.

Thus, we need to calculate the variance for ‘b’ & show that it is the minimum in a class of unbiased estimations. But, first, we need to calculate the variance for ‘b’.

Now; we need to construct another linear unbiased estimator and find its variance.

Let another estimator be: b^*=∑ci yi….(6)  For unbiasedness ∑ci =0,∑cixi =1.

Now; from (6) we get:

∴b* is an unbiased estimator for  Now; the variance for  can be calculated as:-

Now;

Hence; from (9) we can say V(b) is the least among a class of unbiasedness estimators.

Therefore, ‘b’ is the best linear unbiased estimator for  in a class of linear unbiased estimators.

2

  1. To prove ‘a’ is the best linear unbiased estimator for α:-

Form the OLS estimation we have ‘a’ as:-

Here; ‘b’ is a function of Y and Y is a linear function of X(orUi).

‘a’ is also a linear function of Y. i.e. has linearity.

There, ‘a’ is a linear estimator for   ……. (11)

Now, for ‘a’ to be an unbiased estimator; we must have From (10) we have:-

Taking expectations on both sides of the equation; we get:

Therefore, ‘a’ is an unbiased estimator for  ……… (12)

From (11) & (12) ‘a’ is a linear unbiased estimator for

Now, if ‘a’ is to be the best estimator for then is most have the minimum variance. Thus; we first need to calculate the variance of ‘a’.

Now, 

Now; let us consider an estimator in the class of linear unbiased estimator.

Further we know,

Now;

Hence;

Now;

Therefore;

Hence; from (16) we can say that is the Min Variance Unbiased estimator in a class of unbiased estimator.

Hence; we can now safely conclude that a regression line composed of OLS estimators is the ‘best fit’ line for a given PRF, compared to any other estimator.

Thus, the best-fit regression line can be depicted as

Thus, a regression line is the best fit for a given PRF if the estimators are OLS.

End Notes

The beauty and efficiency of Regression method of forecasting never fail to amaze us. The way it crunches the data to help make better decisions and improve the current position of the business is incredible. If you are interested in the same, follow us at DexLab Analytics. A continues blog series on regression model and analysis is upcoming. Watch this space for more.

DexLab Analytics offers premium data science courses in Gurgaon crafted by the experts. After thorough research, each course is prepared keeping student’s needs and industry demands in mind. You can check out our course offerings here.


Interested in a career in Data Analyst?

To learn more about Data Analyst with Advanced excel course – Enrol Now.
To learn more about Data Analyst with R Course – Enrol Now.
To learn more about Big Data Course – Enrol Now.

To learn more about Machine Learning Using Python and Spark – Enrol Now.
To learn more about Data Analyst with SAS Course – Enrol Now.
To learn more about Data Analyst with Apache Spark Course – Enrol Now.
To learn more about Data Analyst with Market Risk Analytics and Modelling Course – Enrol Now.

Bayesian Thinking & Its Underlying Principles

Bayesian Thinking & Its Underlying Principles

In the previous blog on Bayes’ Theorem, we left off at an interesting junction where we just touched upon the ideas on prior odds ratio, likelihood ratio and the resulting Posterior Odds Ratio. However, we didn’t go into much detail of what it means in real life scenarios and how should we use them.

In this blog, we will introduce the powerful concept of “Bayesian Thinking” and explain why it is so important. Bayesian Thinking is a practical application of the Bayes’ Theorem which can be used as a powerful decision-making tool too!

We’ll consider an example to understand how Bayesian Thinking is used to make sound decisions.

For the sake of simplicity, let’s imagine a management consultation firm hires only two types of employees. Let’s say, IT professionals and business consultants. You come across an employee of this firm, let’s call him Raj. You notice something about Raj instantly. Raj is shy. Now if you were asked to guess which type of employee Raj is what would be your guess?

If your guess is that Raj is an IT guy based on shyness as an attribute, then you have already fallen for one of the inherent cognitive biases. We’ll talk more about it later. But what if it can be proved Raj is actually twice as likely to be a Business Consultant?!

This is where Bayesian Thinking allows us to keep account of priors and likelihood information to predict a posterior probability.

The inherent cognitive bias you fell for is actually called – Base Rate Neglect. Base Rate Neglect occurs when we do not take into account the underlying proportion of a group in the population. Put it simply, what is the proportion of IT professionals to Business consultants in a business management firm? It would be fair to assume for every 1 IT professional, the firm hires 10 business consultants.

Another assumption could be made about shyness as an attribute. It would be fair to assume shyness is more common in IT professionals as compared to business consultants. Let’s assume, 75% of IT professionals are in fact shy corresponding to about 15% of business consultants.

Think of the proportion of employees in the firm as the prior odds. Now, think of the shyness as an attribute as the Likelihood. The figure below demonstrates when we take a product of the two, we get posterior odds.

Plugging in the values shows us that Raj is actually twice as likely to be a Business consultant. This proves to us that by applying Bayesian Thinking we can eliminate bias and make a sound judgment.

Now, it would be unrealistic for you to try drawing a diagram or quantifying assumptions in most of the cases. So, how do we learn to apply Bayesian Thinking without quantifying our assumptions? Turns out we could, if we understood what are the underlying principles of Bayesian Thinking are.

Principles of Bayesian Thinking

Rule 1 – Remember your priors!

As we saw earlier how easy it is to fall for the base rate neglect trap. The underlying proportion in the population is often times neglected and we as human beings have a tendency to just focus on just the attribute. Think of priors as the underlying or the background knowledge which is essentially an additional bit of information in addition to the likelihood. A product of the priors together with likelihood determines the posterior odds/probability.

Rule 2 – Question your existing belief

This is somewhat tricky and counter-intuitive to grasp but question your priors. Present yourself with a hypothesis what if your priors were irrelevant or even wrong? How will that affect your posterior probability? Would the new posterior probability be any different than the existing one if your priors are irrelevant or even wrong?

Rule 3 – Update incrementally

We live in a dynamic world where evidence and attributes are constantly shifting. While it is okay to believe in well-tested priors and likelihoods in the present moment. However, always question does my priors & likelihood still hold true today? In other words, update your beliefs incrementally as new information or evidence surfaces. A good example of this would be the shifting sentiments of the financial markets. What holds true today, may not tomorrow? Hence, the priors and likelihoods must also be incrementally updated.

Conclusion

In conclusion, Bayesian Thinking is a powerful tool to hone your judgment skills. Developing Bayesian Thinking essentially tells us what to believe in and how much confident you are about that belief. It also allows us to shift our existing beliefs in light of new information or as the evidence unfolds. Hopefully, you now have a better understanding of Bayesian Thinking and why is it so important.

On that note, we would like to say DexLab Analytics is a premium data analytics training institute located in the heart of Delhi NCR. We provide intensive training on a plethora of data-centric subjects, including data science, Python and credit risk analytics. Stay tuned for more such interesting blogs and updates!

About the Author: Nish Lau Bakshi is a professional data scientist with an actuarial background and a passion to use the power of statistics to tackle various pressing, daily life problems.


Interested in a career in Data Analyst?

To learn more about Data Analyst with Advanced excel course – Enrol Now.
To learn more about Data Analyst with R Course – Enrol Now.
To learn more about Big Data Course – Enrol Now.

To learn more about Machine Learning Using Python and Spark – Enrol Now.
To learn more about Data Analyst with SAS Course – Enrol Now.
To learn more about Data Analyst with Apache Spark Course – Enrol Now.
To learn more about Data Analyst with Market Risk Analytics and Modelling Course – Enrol Now.

Upskill and Upgrade: The Mantra for Budding Data Scientists

Upskill and Upgrade: The Mantra for Budding Data Scientists

Have the right skills? Then the hottest jobs of the millennium might be waiting for you! The job profiles of data analysts, data scientists, data managers and statisticians harbour great potentials.

However, the biggest challenge in today’s age lies in preparing novice graduates for Industry 4.0 jobs. Although no one has yet cleared which roles will cease to exist and which new roles will be created, the consultants have started advising students to imbibe necessary skills and up-skill in domains that are likely to influence and carve the future jobs. Becoming adaptive is the best way to sail high in the looming technology-dominated future.

Data Science and Future

In this context, data science has proved to be one of the most promising fields of technology and science that exhibits a wide gap between demand and supply yet an absolute imperative across disciplines. “Today there is no shortage of data or computing abilities but there is a shortage of workforce equipped with the right skill set that can interpret data and get valuable insights,” revealed James Abdey, assistant professorial lecturer Statistics, London School of Economics and Political Science (LSE).

He further added that data science is a multidisciplinary field – drawing collectives from Economics, Mathematics, Finance, Statistics and more.

As a matter of fact, anyone, who has the right skill and expertise, can become a data scientist. The required skills are analytical thinking, problem-solving and decision-making aptitude. “As everything becomes data-driven, acquiring analytical and statistical skill sets will soon be imperative for all students, including those pursuing Social Sciences or Liberal Arts and also for professionals,” said Jitin Chadha, founder and director, Indian School of Business and Finance (ISBF).

DexLab Analytics is one of the most prominent deep learning training institutes seated in the heart of Delhi. We offer state-of-the-art in-demand skill training courses to all the interested candidates.

The Challenges Ahead

The dearth of expert training faculty and obsolete curriculum acts as major roadblocks to the success of data science training. Such hindrances cause difficulty in preparing graduates for Industry 4.0. In this regard, Chiraag Mehta from ISBF shared that by increasing international collaborations and intensifying industry-academia connect, they can formulate an effective solution and bring forth the best practices to the classrooms. “With international collaborations, higher education institutes can bring in the latest curriculum while a deeper industry-academia connect including, guest lecturers from industry players and internships will help students relate the theory to real-world applications, ” shared Mehta during an interview with Education Times.

2

Industry 4.0: A Brief Overview

The concept Industry 4.0 encompasses the potential of a new industrial revolution – where gathering and analyzing data across machines will become the order of the day. The rise of this new digital industrial revolution is expected to facilitate faster, more flexible and efficient processes to manufacture high-quality products at reduced costs – thus, increasing productivity, switch economies, stimulate industrial growth and reform workforce profile.

Want to know more about data science courses in Gurgaon? Feel free to reach us at DexLab Analytics.


The blog has been sourced fromtimesofindia.indiatimes.com/home/education/news/learn-to-upskill-and-be-adaptive/articleshow/68989949.cms


Interested in a career in Data Analyst?

To learn more about Data Analyst with Advanced excel course – Enrol Now.
To learn more about Data Analyst with R Course – Enrol Now.
To learn more about Big Data Course – Enrol Now.

To learn more about Machine Learning Using Python and Spark – Enrol Now.
To learn more about Data Analyst with SAS Course – Enrol Now.
To learn more about Data Analyst with Apache Spark Course – Enrol Now.
To learn more about Data Analyst with Market Risk Analytics and Modelling Course – Enrol Now.

Bayes’ Theorem: A Brief Explanation

Bayes’ Theorem: A Brief Explanation

(This is in continuation of the previous blog, which was published on 22nd April, 2019 – www.dexlabanalytics.com/blog/a-beginners-guide-to-learning-data-science-fundamentals )

In this blog, we’ll try to get a hands-on understanding of the Bayes’ Theorem. While doing so, hopefully we’ll be able to grasp a basic understanding of concepts such as Prior odds ratio, Likelihood ratio and Posterior odds ratio.

Arguably, a lot of classification problems have their root in Bayes’ Theorem. Reverend T. Bayes came up with this superior logical function, which mathematically deducts the probability of an event occurring from a larger set by “flipping” the conditional probabilities.


Consider,  E1, E2, E3,……..En to be a partition a larger set “S” and now define an Event – A, such that A is a subset of S.

Let the square be the larger set “S” containing mutually exclusive events Ei’s.  Now, let the yellow ring passing through all Ei’s be an event – A.

Using conditional probabilities, we know,

Also, the relationship:

Law of total probability states:

Rearranging the values of  &  gives us the Bayes Theorem:

The values of  are also known as prior probabilities, the event A is some event, which is known to have occurred and the conditional probability   is known as the posterior probability.

Now that, you’ve got the maths behind it, it’s time to visualise its practical application. Bayesian thinking is a method of applying Bayes’ Theorem into a practical scenario to make sound judgements.

The next blog will be dedicated to Bayesian Thinking and its principles.

For now, imagine, there have been news headlines about builders snooping around houses they work in. You’ve got a builder in to work on something in your house. There is room for all sorts of bias to influence you into believing that the builder in your house is also an opportunistic thief.

However, if you were to apply Bayesian thinking, you can deduce that only a small fraction of the population are builders and of that population, a very tiny proportion is opportunistic thieves. Therefore, the probability of the builder in your house being an opportunistic thief is actually a product of the two proportions, which is indeed very-very small.

Technically speaking, we call the resulting posterior odds ratio as a product of prior odds ratio and likelihood ratio. More on applying Bayesian Thinking coming up in the next blog.

In the meantime try this exercise and leave your comments below in the comments section.

2

In the above example on “snooping builders”, what are your:

  • Ei’s
  • Event – A
  • “S”

About the Author: Nish Lau Bakshi is a professional data scientist with an actuarial background and a passion to use the power of statistics to tackle various pressing, daily life problems.

About the Institute: DexLab Analytics is a premier data analyst training institute in Gurgaon specializing in an enriching array of in-demand skill training courses for interested candidates. Skilled industry consultants craft state-of-the-art big data courses and excellent placement assistance ensures job guarantee.

For more from the tech series, stay tuned!


Interested in a career in Data Analyst?

To learn more about Data Analyst with Advanced excel course – Enrol Now.
To learn more about Data Analyst with R Course – Enrol Now.
To learn more about Big Data Course – Enrol Now.

To learn more about Machine Learning Using Python and Spark – Enrol Now.
To learn more about Data Analyst with SAS Course – Enrol Now.
To learn more about Data Analyst with Apache Spark Course – Enrol Now.
To learn more about Data Analyst with Market Risk Analytics and Modelling Course – Enrol Now.
Study: The Demand for Data Scientists is Likely to Rise Sharply

Study: The Demand for Data Scientists is Likely to Rise Sharply

Data is like the new oil. A large number of companies are leveraging artificial intelligence and big data to mine these vast volumes of data in today’s time. Data science is a promising landmine of job opportunities – and it’s high time to consider it as a successful career avenue.

The prospect of data science is skyrocketing. Today, it is estimated that more than 50000 data science and machine learning jobs are lying vacant. Plus, nearly 40000 new jobs are to be generated in India alone by 2020. If you follow the global trends, the role of data scientist has expanded over 650% since 2012 yet only 35000 people in the US are skilled enough.

Data scientists are like the platform that connects the dots between programming and implementation of data to solve challenging business intricacies – says Pankaj Muthe, Academic Program Manager (APAC), Company Spokesperson, QlikTech. The company delivers intuitive platform solutions for embedded analytics, self-service data visualizations and guided analytics and reporting across the globe.

According to a pool of experts, data science is the hottest job trend of this century and is the second most popular degree to have at the master level next to MBA. No wonder, this new breed of science and technology is believed to be driving a new wave of innovation! Data scientists and front-end developers attracted the highest remuneration across Indian startups throughout 2017.

2

Eligibility Criteria

To become a professional data scientist, a degree in computer science/engineering or mathematics is a must. Most of the data scientists have a knack for intricate tasks and aptitude to learn challenging programming languages. Any good organization seeks interested and intelligent candidates with the zeal to learn more. The subjects in which they need to be proficient are mathematics, statistics and programming. Moreover, data science jobs need a very sound base in machine learning algorithms, statistical modeling and neural networks as well as incredible communication skills.

Today, a lot of institutes offer state-of-the-art data science online courses that prove extremely beneficial for career growth and expansion. Combining theoretical knowledge and technical aspects of data science training, these institutes provide skill and assistance to develop real-world applications. DexLab Analytics is one such institute that is located in the heart of Delhi NCR. For more, feel free to reach us at <www.dexlabanalytics.com>

Future Prospects

After land, labour and capital, data ranks as the fourth factor of production. According to the US Department of Statistics, the demand for data engineers is likely to grow by 40% by 2020. If you are looking for a flourishing career option, this is the place to be: an entry-level engineer begins their career as a business analyst and then proceeds towards becoming a project manager. Later, after years of experience, these virgin business analysts further get promoted to become chief data officers.


Interested in a career in Data Analyst?

To learn more about Data Analyst with Advanced excel course – Enrol Now.
To learn more about Data Analyst with R Course – Enrol Now.
To learn more about Big Data Course – Enrol Now.

To learn more about Machine Learning Using Python and Spark – Enrol Now.
To learn more about Data Analyst with SAS Course – Enrol Now.
To learn more about Data Analyst with Apache Spark Course – Enrol Now.
To learn more about Data Analyst with Market Risk Analytics and Modelling Course – Enrol Now.
Know All about Usage-Driven Grouping of Programming Languages Used in Data Science

Know All about Usage-Driven Grouping of Programming Languages Used in Data Science

Programming skills are indispensable for data science professionals. The main job of machine learning engineers and data scientists is drawing insights from data, and their expertise in programming languages enable them to do this crucial task properly. Research has shown that professionals of the data science field typically work with three languages simultaneously. So, which ones are the most popular? Are some languages more likely to be used together?

Recent studies explain that certain programming languages are used jointly besides other programming languages that are used independently. With the survey data collected from Kaggle’s 2018 Machine Learning and Data Science study, usage patterns of over 18,000 data science experts working with 16 programming languages were analyzed. The research revealed that these languages can actually be categorized into smaller sets, resulting in 5 main groupings. The nature of the groupings is indicative of specific roles or applications that individual groups support, like analytics, front-end work and general-purpose tasks.

2

Principal Component Analysis for Dimension Reduction

In this article, we will explain how Bob E. Hayes, PhD holder, scientist, blogger and data science writer has used principal component analysis, a type of data reduction method, to categorize 16 different programming languages. Herein, the relationship among various languages is inspected before putting them in particular groups. Basically, principal component analysis looks into statistical associations like covariance within a large collection of variables, and then justifies these correlations with the help of a few variables, called components.

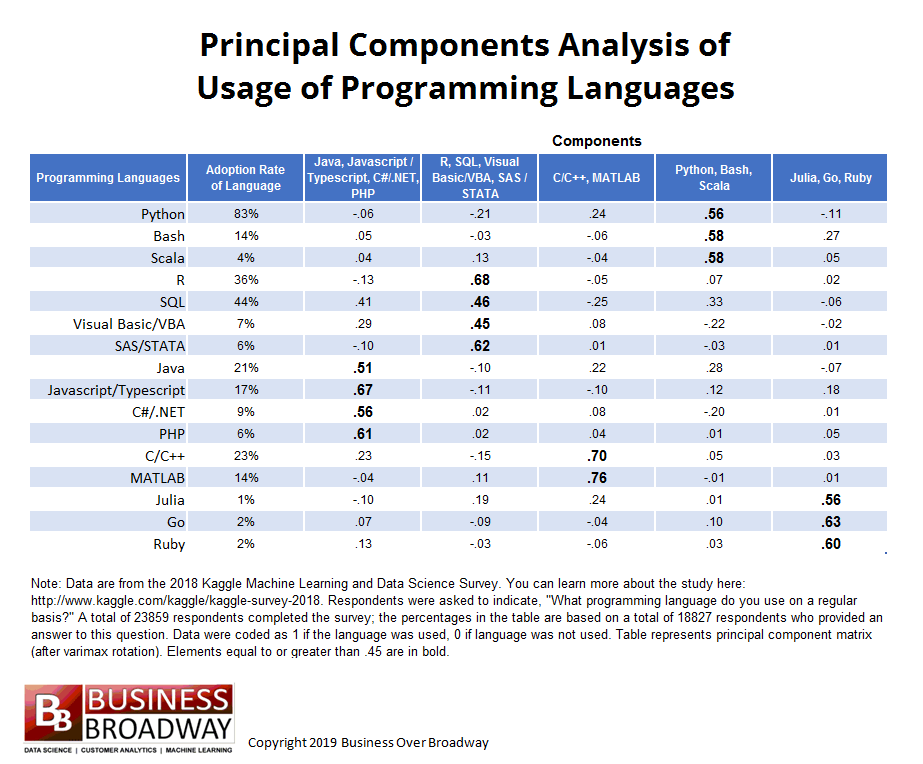
Principal component matrix presents the results of this analysis. The matrix is an nXm table, where:

n= total no. of original variables, which in this case are the number of programming languages

m= number of main components

The strength of relationship between each language and underlying components is represented by the elements of the matrix. Overall, the principal component analysis of programming language usage gives us two important insights:

  • How many underlying components (groupings of programming languages) describe the preliminary set of languages
  • The languages that go best with each programming language grouping

Result of Principal Component Analysis:

The nature of this analysis is exploratory, meaning no pre-defined structure was imposed on the data. The result was primarily driven by the type of relationship shared by the 16 languages. The aim was to explain the relationships with as less components as possible. In addition, few rules of thumb were used to establish the number of components. One was to find the number of eigen values with value greater than 1 – that number determines the number of components. Another method is to identify the breaking point in the scree plot, which is a plot of the 16 eigen values.

businessoverbroadway.com


5-factor solution was chosen to describe the relationships. This is owing to two reasons – firstly, 5 eigen values were greater than one and secondly, the scree plot showed a breaking point around 6th eigen value.

Following are two key interpretations from the principal component matrix:

  • Values greater than equal to .45 have been made bold
  • The headings of different components are named on the basis of tools that loaded highly on that component. For example, component 4 has been labeled as Python, Bash, Scala because these languages loaded highest on this component, implying respondents are likely to use Bash and Scala if they work with Python. Other 4 components were labeled in a similar manner.

Groupings of Programming Languages

The given data set is appropriately described by 5 tool grouping. Below are given 5 groupings, including the particular languages that fall within the group, meaning they are likely to be used together.

  1. Java, Javascript/Typescript, C#/.NET, PHP
  2. R, SQL, Visual Basic/VBA, SAS/STATA
  3. C/C++, MATLAB
  4. Python, Bash, Scala
  5. Julia, Go, Ruby

One programming language didn’t properly load into any of the components: SQL. However, SQL is used moderately with three programming languages, namely Java (component 1), R (component 2) and Python (component 4).

It is further understood that the groupings are determined by the functionality of different languages in the group. General-purpose programming languages, Python, Scala and Bash, got grouped under a single component, whereas languages used for analytical studies, like R and the other languages under comp. 2, got grouped together. Web applications and front-end work are supported by Java and other tools under component 1.

Conclusion:

Data science enthusiasts can succeed better in their projects and boost their chances of landing specific jobs by choosing correct languages that are suited for the job role they want. Being skilled in a single programming language doesn’t cut it in today’s competitive industry. Seasoned data professionals use a set of languages for their projects. Hence, the result of the principal component analysis implies that it’s wise for data pros to skill up in a few related programming languages rather than a single language, and focus on a specific part of data science.

For more help with your data science learning, get in touch with DexLab Analytics, a leading data analyst training institute in Delhi. Also check our Machine learning courses in Delhi to be trained in the essential and latest skills in the field.

 
Reference: http://customerthink.com/usage-driven-groupings-of-data-science-and-machine-learning-programming-languages
 

Interested in a career in Data Analyst?

To learn more about Data Analyst with Advanced excel course – Enrol Now.
To learn more about Data Analyst with R Course – Enrol Now.
To learn more about Big Data Course – Enrol Now.

To learn more about Machine Learning Using Python and Spark – Enrol Now.
To learn more about Data Analyst with SAS Course – Enrol Now.
To learn more about Data Analyst with Apache Spark Course – Enrol Now.
To learn more about Data Analyst with Market Risk Analytics and Modelling Course – Enrol Now.

Being a Statistician Matters More, Here’s Why

Being a Statistician Matters More, Here’s Why

Right data for the right analytics is the crux of the matter. Every data analyst looks for the right data set to bring value to his analytics journey. The best way to understand which data to pick is fact-finding and that is possible through data visualization, basic statistics and other techniques related to statistics and machine learning – and this is exactly where the role of statisticians comes into play. The skill and expertise of statisticians are of higher importance.

2

Below, we have mentioned the 3R’s that boosts the performance of statisticians:

Recognize – Data classification is performed using inferential statistics, descriptive and diverse other sampling techniques.

Ratify – It’s very important to approve your thought process and steer clear from acting on assumptions. To be a fine statistician, you should always indulge in consultations with business stakeholders and draw insights from them. Incorrect data decisions take its toll.

Reinforce – Remember, whenever you assess your data, there will be plenty of things to learn; at each level, you might discover a new approach to an existing problem. The key is to reinforce: consider learning something new and reinforcing it back to the data processing lifecycle sometime later. This kind of approach ensures transparency, fluency and builds a sustainable end-result.

Now, we will talk about the best statistical techniques that need to be applied for better data acknowledgment. This is to say the key to becoming a data analyst is through excelling the nuances of statistics and that is only possible when you possess the skills and expertise – and for that, we are here with some quick measures:

Distribution provides a quick classification view of values within a respective data set and helps us determine an outlier.

Central tendency is used to identify the correlation of each observation against a proposed central value. Mean, Median and Mode are top 3 means of finding that central value.

Dispersion is mostly measured through standard deviation because it offers the best scaled-down view of all the deviations, thus highly recommended.

Understanding and evaluating the data spread is the only way to determine the correlation and draw a conclusion out of the data. You would find different aspects to it when distributed into three equal sections, namely Quartile 1, Quartile 2 and Quartile 3, respectively. The difference between Q1 and Q3 is termed as the interquartile range.

While drawing a conclusion, we would like to say the nature of data holds crucial significance. It decides the course of your outcome. That’s why we suggest you gather and play with your data as long as you like for its going to influence the entire process of decision-making.

On that note, we hope the article has helped you understand the thumb-rule of becoming a good statistician and how you can improve your way of data selection. After all, data selection is the first stepping stone behind designing all machine learning models and solutions.

Saying that, if you are interested in learning machine learning course in Gurgaon, please check out DexLab Analytics. It is a premier data analyst training institute in the heart of Delhi offering state-of-the-art courses.


The blog has been sourced from www.analyticsindiamag.com/are-you-a-better-statistician-than-a-data-analyst


Interested in a career in Data Analyst?

To learn more about Data Analyst with Advanced excel course – Enrol Now.
To learn more about Data Analyst with R Course – Enrol Now.
To learn more about Big Data Course – Enrol Now.

To learn more about Machine Learning Using Python and Spark – Enrol Now.
To learn more about Data Analyst with SAS Course – Enrol Now.
To learn more about Data Analyst with Apache Spark Course – Enrol Now.
To learn more about Data Analyst with Market Risk Analytics and Modelling Course – Enrol Now.

How Deep Learning is Solving Forecasting Challenges in Retail Industry

How Deep Learning is Solving Forecasting Challenges in Retail Industry

Known to all, the present-day retail industry is obsessed with all-things-data. With Amazon leading the show, many retailers are found implementing a data-driven mindset throughout the organization. Accurate predictions are significant for retailers, and AI is good in churning out value from retail datasets. Better accuracy in forecasts has resulted in widespread positive impacts.

2

Below, we’ve chalked down how deep learning, a subset of machine learning addresses retail forecasting issues. It is a prime key to solve most common retail prediction challenges – and here is how:

  • Deep learning helps in developing advanced, customized forecasting models that are based on unstructured retail data sets. Relying on Graphic Processing Units, it helps process complex tasks – though GPUs area applied only twice during the process; once during training the model and then at the time of inference when the model is applied to new data sets.

  • Deep learning-inspired solutions help discover complex patterns in data sets. In case of big retailers, the impressive technology of Deep Learning supports multiple SKUs all at the same time, which proves productive on the part of models as they get to learn from the similarities and differences to seek correlations for promotion or competition. For example, winter gloves sell well when puffer jackets are already winning the market, indicating sales. On top of that, deep learning can also ascertain whether an item was not sold or was simply out of stock. It also possesses the ability to determine the larger problem as to why the product was not being sold or marketed.

  • For a ‘cold start’, historical data is limited but deep learning has the power to leverage other attributes and boost the forecasting. The technology works by picking similar SKUs and implement that information to bootstrap forecasting process.

Nonetheless, there exists an array of challenges associated with Deep Learning technology. The very development of high-end AI applications is at a nascent stage; it is yet to become a fully functional engineering practice.

A larger chunk of successful AI implementation depends on the expertise and experience of the breed of data scientists involved. Handpicking a qualified data scientist in today’s world is the real ordeal. Being fluent in the nuances of deep learning imposes extra challenges. Moreover, apart from being labor intensive in terms of feature engineering and data cleaning, the entire methodology of developing neural network models all manually is difficult and downright challenging. It may even take a substantial amount of time to learn the tricks and scrounge through numerous computational resources and experiments performed by data scientists. All this makes the hunt down for skilled data scientists even more difficult.

Fortunately, DexLab Analytics is here with its top of the line data science courses in Gurgaon. The courses offered by the prominent institute are intensive, well-crafted and entirely industry-relevant. For more information on data analyst course in Delhi NCR, visit our homepage.

 
The blog has been sourced from ―
www.forbes.com/sites/nvidia/2018/11/21/how-deep-learning-solves-retail-forecasting-challenges/#6cf36740db18
 

Interested in a career in Data Analyst?

To learn more about Data Analyst with Advanced excel course – Enrol Now.
To learn more about Data Analyst with R Course – Enrol Now.
To learn more about Big Data Course – Enrol Now.

To learn more about Machine Learning Using Python and Spark – Enrol Now.
To learn more about Data Analyst with SAS Course – Enrol Now.
To learn more about Data Analyst with Apache Spark Course – Enrol Now.
To learn more about Data Analyst with Market Risk Analytics and Modelling Course – Enrol Now.

Discover the Best Industries to Have a Career in Data Science

Discover-the-Best-Industries-to-Have-a-Career-in-Data-Science

Data fires up everything, nowadays. And data science is gaining exceptional traction in the job world, as data analytics, machine learning, big data, and data mining are fetching relevance in the mainstream tech world. By 2025, it is being expected that data science industry will reach $16 billion in value – this is why landing a job in data science domain is the next big thing!

The skills you will imbibe as a data scientist would be incredible, powerful and extremely valuable. You can easily a bag a dream job in corporate moguls, like Coca-Cola, Uber, Ford Motors and IBM, as well as play a significant role in any pro-social or philanthropic endeavors to make this world a better place to live in.

Check out these extremely interesting fields you could start your career in data science:

Biotechnology

No wonder, science and medicine are intricately related to each other. As the technology pushes boundaries, more and more companies are recommitting themselves towards a better public health by nabbing biotechnology. Being a data scientist, you would help in unraveling newer ways of studying large amounts of data – including machine learning, semantic and interactive technologies. Eventually, they would influence treatments, drugs-usage, testing procedures and much more.

Untitled

Energy

Power industry functions on data – and tons of it. Whether it’s about extracting mineral wealth from the earth’s crust or transporting crude oil or planning better storage facilities, the demand for data scientists is on the rise. Just as expanding oil fields ask for humongous amounts of data study, installing and refining cleaner energy production facilities relies on data about the natural environment and ways of modern construction. Data scientists are often given a ring to enhance safety standards and help companies recommit themselves towards better safety and environmental regulations.

Transportation

Recently, transportation is undergoing a robust change. For example, Tesla paved a new road of development and turned countless heads by unveiling a long-haul truck that could drive on its own. Though it’s not the first time, they are prone to lead the change.

Beyond self-driving vehicle technology, the transportation industry is looking for more efficient ways to preserve and transport energy. These advancements in technology works wonders when combined with better battery technology development – in simple terms, every individual field in transportation industry is believed to benefit from a motley team of data scientists.

jpg

Telecommunications

The internet is not only about tubes, but all about data. The future of the internet is here, with ever-increasing networks of satellites and user devices establishing communication through blockchain. Though they are yet to be used on large-scale, they have started making news. In situations like this, it would be difficult not to highlight the importance of data science and data architecture as they are becoming major influencers in the internet world. Whenever there is a dire need to make the public aware of a new product, we rely on user data – hence the role of data scientists is the key to a better future.

Today, data science is an interesting field to explore, and it is going to play an integral role as the stride in technology and globalization keeps expanding its base. If you have a keen eye for numbers, charts, patterns and analytics, this niche is perfectly suitable for you.

DexLab Analytics is a prime Data Science training institute Delhi that excels in offering advanced business analyst training courses in Gurgaon. Visit our official site for more information and make a mark in data analytics!


Interested in a career in Data Analyst?

To learn more about Data Analyst with Advanced excel course – Enrol Now.
To learn more about Data Analyst with R Course – Enrol Now.
To learn more about Big Data Course – Enrol Now.

To learn more about Machine Learning Using Python and Spark – Enrol Now.
To learn more about Data Analyst with SAS Course – Enrol Now.
To learn more about Data Analyst with Apache Spark Course – Enrol Now.
To learn more about Data Analyst with Market Risk Analytics and Modelling Course – Enrol Now.
Call us to know more