The theory of estimation is a branch in statistics that provides numerical values of the unknown parameters of the population on the basis of the measured empirical data that has a random component. This is a process of guessing the underlying properties of the population by observing the sample that has been taken from the population. The idea behind this is to calculate and find out the approximate values of the population parameter on the basis of a sample statistics.
Population:- All the items in any field of inquiry constitutes to a “Population”. For example all the employees of a factory is a population of that factory and the population mean is represented and the size of the population is represented by N.
Sample:- Selection of few items from the population constitutes to a sample and the mean of the sample is represented by and the sample size is represented by n
Statistics:- Any statistical measure calculated on the basis of sample observations is called Statistic. Like sample mean, sample standard deviation, etc.
Estimator:- In general estimator acts as a rule, a measure computed on the basis of the sample which tells us how to calculate the values of the estimate. It is a functional form of all sample observations prorating a representative value of the collected sample.
Suppose we have a random sample x_1,x_2,…,x_n on a variable x, whose distribution in the population involves an unknown parameter. It is required to find an estimate of on the basis of sample values.
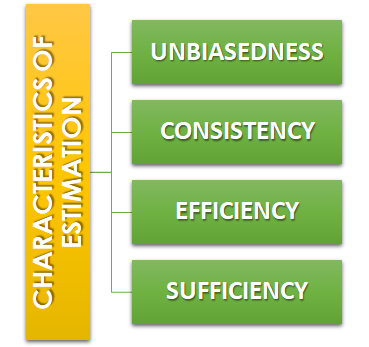
Unbiasedness:-A statistic t is said to be an unbiased estimator if E(β ̂)= βi.e. observed value is equal to the expected value. In case E(β ̂)≠ β then the estimator is biased estimator.
Consistency:- One of the most desirable property of good estimator is that its accuracy should increase when the sample becomes larger i.e. the error between the expected value and the observed value reduces as the size of the sample increases E(β ̂ )- β=0
Efficiency:-An estimator is said to be an efficient estimator if it has the smallest variance compared to all the consistent and unbiased estimators. If consistent estimator exists whose sampling variance is less than that of any other consistent estimator, it is said to be “most efficient”; and it provides a standard for the measurement of ‘efficiency’ of a statistic.
Sufficiency:- An estimator is said to be sufficient if it contains all information in the sample about .
At the end of this discussion, hopefully, you have learned what theory of estimation is. Watch the video tutorial attached below to learn more about this. DexLab Analytics is a data science training institute in gurgaon, that offers advanced courses. Follow the blog section to access more informative posts like this.
NumPy also known as numerical python, is a library consisting of multidimensional array objects and a collection of routines for processing those arrays. Using NumPy, mathematical and logical operations on arrays can be performed without it which was not possible. For example-
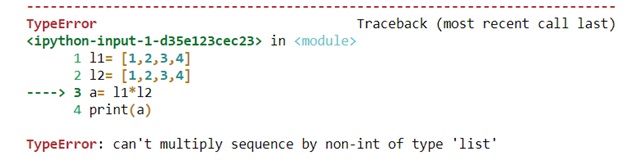
Multiplication of two lists will cause an error as a data structure like lists, tuple, dictionaries and sets do not allow mathematical operations.
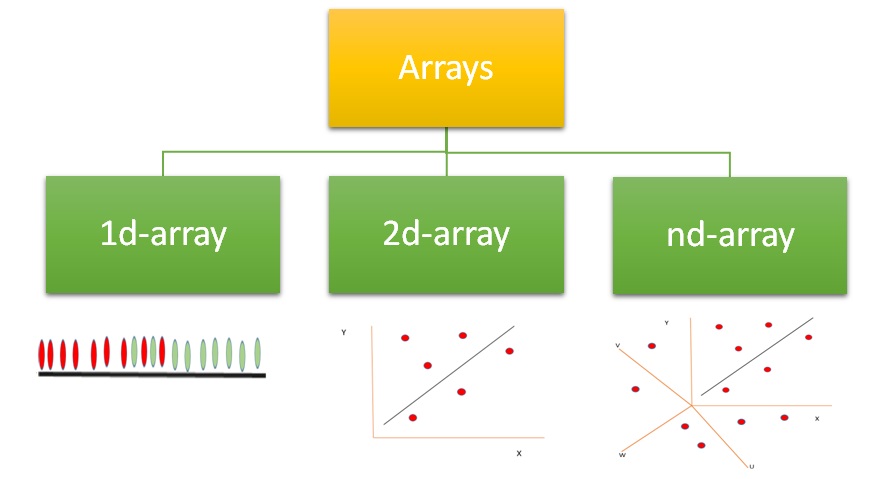
Therefore we need NumPy to covert our data structures like lists into 1d, 2d, 3d or nd arrays so that mathematical operations can be performed. U
We can use .array() methods to create these arrays.
Now let’s check out few examples and also perform few mathematical operations to have a better understanding.
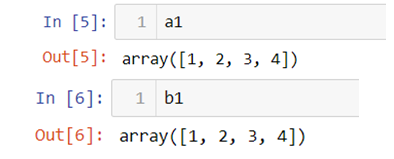
In the above code we first import NumPy library and then use .array() method to two 1d-array a1 and b1 using the list we previously created.
Now let’s multiply a1 and b1 array.
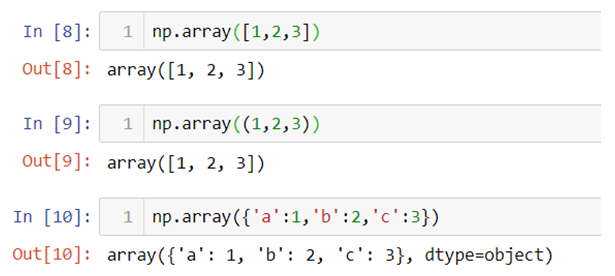
Now let’s use .array() method to directly create an array.
Arrays can be created using lists, tuples and dictionaries as you can see in the above example.
Now for 2-d arrays recall that we can also make list of lists. Let’s use that to create 2d-arrays.
2d-arrays can also be created using tuples.
Remember that we are not using these as matrices because matrix multiplication is an entirely different thing we are just trying to perform mathematical operations which were otherwise not possible.
Random Module
Numpy also has various ways with which we can create array of random numbers which then can be used in number of ways like generating a data for practice purposes or for building beautiful graphs for a presentation.
Given below is a list of type of random numbers you can generate
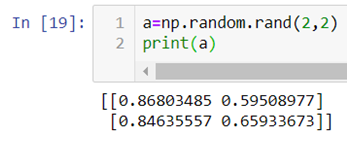
.rand() :- This particular method helps you generate uniformly distributed random numbers i.e. numbers between 0 and 1 where each number between 0 and 1 will have equal probability to be in the sample dataset.
The above code generates a 2d-array with values between 0 and 1.
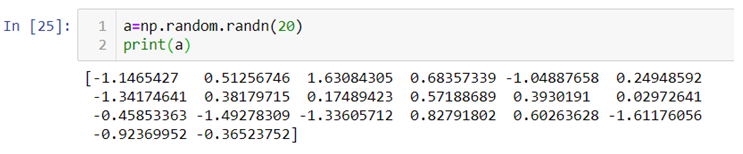
.randn():- This method generates normally distributed random numbers i.e. numbers between -3 and +3 where mean=median=mode and ploted gives a bell shaped curve.
Here the 20 random numbers are generated ranging between -3 and + 3.
Note:- Remember that the data is randomly picked from the normally distributed values between -3 and +3 so the graph is not bell shaped but the original data from which the values are being picked randomly is bell shaped with mean=median-mode.
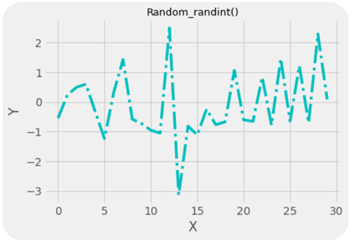
.randint():-This method generates random integers between a given range.
So, with that we come to the end of the discussion on the Numpy. Hopefully it helped you understand Numpy, for more information you can also watch the video tutorial attached down this blog. DexLab Analytics offers machine learning courses in delhi. To keep on learning more, follow DexLab Analytics blog.
In our previous blog we studied about the basic concepts of Linear Regression and its assumptions and let’s practically try to understand how it works.
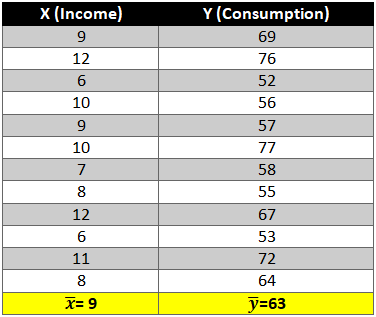
Given below is a dataset for which we will try to generate a linear function i.e.
y=b0+b1Xi
Where,
y= Dependent variable
Xi= Independent variable
b0 = Intercept (coefficient)
b1 = Slope (coefficient)
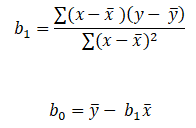
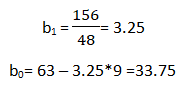
To find out beta (b0& b1) coefficients we use the following formula:-
Let’s start the calculation stepwise.
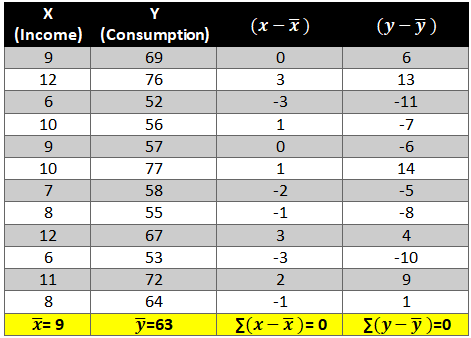
First let’s find the mean of x and y and then find out the difference between the mean values and the Xi and Yie. (x-x ̅ ) and (y-y ̅ ).
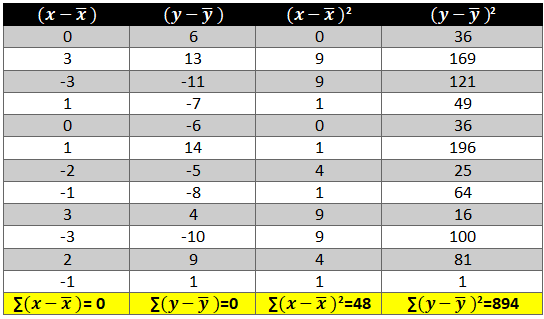
Now calculate the value of (x-x ̅ )2 and (y-y ̅ )2. The variation is squared to remove the negative signs otherwise the summation of the column will be 0.
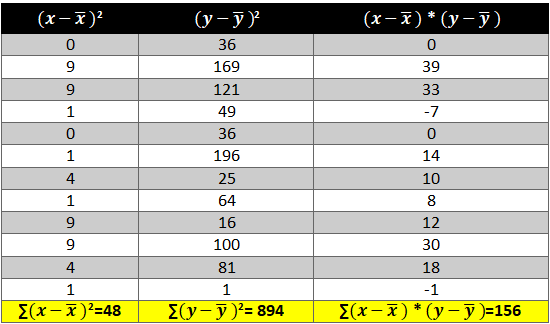
Next we need to see how income and consumption simultaneously variate i.e. (x-x ̅ )* (y-y ̅ )
Now all there is left is to use the above calculated values in the formula:-
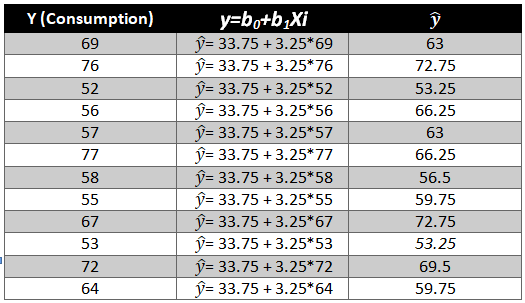
As we have the value of beta coefficients we will be able to find the y ̂(dependent variable) value.
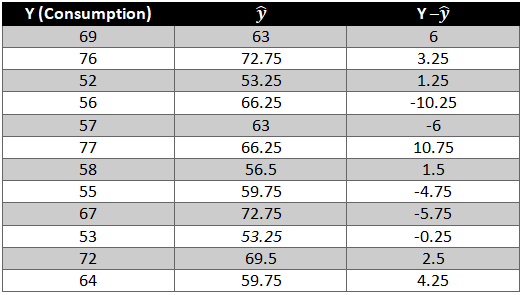
We need to now find the difference between the predicted y ̂ and observed y which is also called the error term or the error.
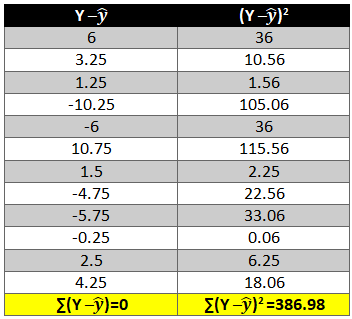
To remove the negative sign lets square the residual.
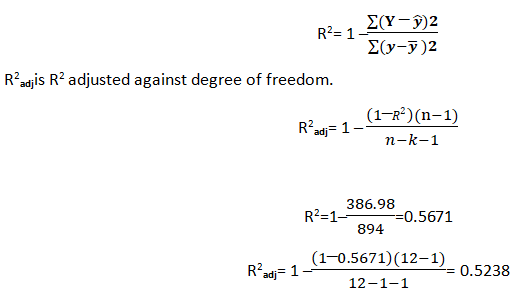
What is R2 and adjusted R2 ?
R2 also known as goodness of fit is the ratio of the difference between observed y and predicted and the observed y and the mean value of y.
Hopefully, now you have understood how to solve a Linear Regression problem and would apply what you have learned in this blog. You can also follow the video tutorial attached down the blog. You can expect more such informative posts if you keep on following the DexLab Analytics blog. DexLab Analytics provides data Science certification courses in gurgaon.
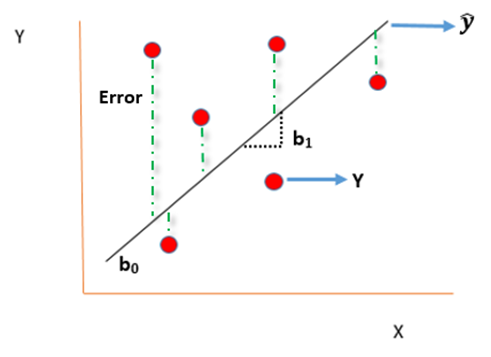
Today’s blog explores another vital statistical concept Linear Regression, let’s begin. Linear regression is normally used in statistics for predictive modeling. It tries to model a relationship between two independent (explanatory variable) and dependent (explained variable) variables X and Y by fitting a linear equation (Y=bo+b1X+Ui) to an observed data.
Assumptions of linear regression
Ui is a random real variable, where Ui is the difference between the observed dependent variable Y and predicted Y variable.
The mean of Ui in any particular period is zero.
The variance of Ui is constant in each period i.e for all values of X, Ui will show the same dispersion around their mean
The variable Ui has a normal distribution i.e the value of Ui (for each Xi) have a bell shaped symmetrical distribution about their zero mean.
The random terms of different observations are independent i.e the covariance of any Ui with any other Uj is equal to zero.
Ui is independent of the explanatory variable X.
Xi are a set of fixed values in the hypothesised process of repeated sampling which underlies the linear regression model.
In case there are more than one explanatory variables then they are not perfectly linearly correlated.
Linear Regression equation can be written as:
Where,
is the dependent variable
X is the independent variable.
b0 is the intercept (where the line crosses the vertical y-axis)
b1 is the slope
Ui is the error term (difference between ) also called residual or white noise.
Simple linear regression follows the properties of Ordinary Least Square (OLS) which are as follows:-
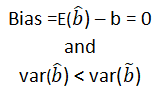
Unbiased estimator:- E()=b ie. an estimator is unbiased if its bias is 0; E() – b = 0
Minimum Variance:- An estimate is best when it has the smallest variance as compared to any other estimate obtained from other econometric method.
Efficient estimator:- When it has both the previous properties ie.
Linear estimator
Best, Linear, Unbiased estimator (BLUE)
Minimum mean squared error (MSE) estimator:- It is a combination of the unbiasedness and minimum variance properties. An estimator is a minimum MSE estimator if it has the smallest mean square error.
With that the discussion on Linear Regression wraps up here, hopefully it cleared away any confusion you might have and helped you get a grasp on the concept. We have a video discussion on this same topic, which is attached below this blog, check it out for further reference.
From Saturday, 6th June 2020, a team of senior consultants at DexLab Analytics has been conducting a national level training for more than 40 participants who are research scholars, MPhil students and professors from colleges like IIT, CSIR, BHU and NIT, among others. This one of a kind, crowd-funded training is being conducted on “Environment Air pollution Data Analysis using OpenAir package of R”.
The training is a result of the lockdown wherein DexLab Analytics is working towards its upskilling initiatives for professionals and subject matter experts across India. The training is being conducted in DexLab Analytics’TraDigital format – real time, online, classroom styled, instructor-led training.
The attendees will be taking up these interactive classes from the safety and comfort of their homes. They will be getting assignments, learning material and recordings virtually.
The one-month-long training will be conducted in R Programming, Data Science and Machine Learning using R Programming from the perspective of Environmental Science. DexLab Analytics is conducting this training module in line with the tenets of ‘Atmanirbhar India’.
DexLab Analytics is a leading data science training institute in India with a vast array of state-of-the-art analytics courses, attracting a large number of students nationwide. It offers high-in-demand professional courses like Big Data, R Programming, Python, Machine Learning, Deep Learning, Data Science, Alteryx, SQL, Business Analytics, Credit Risk modeling, Tableau, Excel etc. to help young minds be data-efficient. It has its headquarters in Gurgaon, NCR.
Artificial Intelligence (AI) is revolutionizing innumerable aspects of our lives, education being one of them. AI has transformed the way we learn, the relationship between the student and the teacher and the very manner in which our curriculum is perceived. This article, the third part of a series on the applications of artificial intelligence, delineates how AI has come to transform the education sector, as we know it.
The biggest contribution of AI to the education sector has been towards enhancing and streamlining the system of teaching students with varying needs across the spectrum, from elementary schools to adult learning centers. Students can be mentally developed in the left side of the brain with more analytical skills or they can be mentally developed in the right side of the brain with more creative and literary skills. Likewise, there may be students with different interests and passions. A strictly uniform curriculum does not suit all students of the same class because people differ in their learning ability and interests.
AI-Enabled Hyper-Personalization
AI is thus being used to customise curricula according to specific needs of each student of a single class. This is being done through the power of machine learning via a method called hyper-personalization. The AI powered system studies and examines the profile of a student and prescribes suitable curricula for her/him. According to a report, it is expected that by the year 2024 onwards, almost 50 percent of learning management tools will be powered by AI capabilities. These AI-enabled e-Learning tools will touch over $6 Billion in market size by 2024.
Smart Learning Tools
Machine Learning and AI are also defining the way hyperper sonalized and on-demand digital content is created to digitise the learning environment. Now students do not have to rote-learn chapter after chapter from textbooks. They are absorbing learning material in the form of condensed bits of information in the form of smaller study guides, chapter summaries, flashcards, as well as short smart notes designed for better reading and comprehension. Learning is therefore becoming gradually paperless. AI systems also have an online interactive interface that helps in putting in place a system of feedback from students to professors regarding areas they are facing trouble understanding.
Digital Conversations
AI systems are also being used to develop the system of tutoring with personalized conversational education assistants. These autonomous conversational agents are capable of answering questions, providing assistance with learning or assignments, and strengthening concepts by throwing up additional information and learning material to reinforce the curriculum. “These intelligent assistants are also enhancing adaptive learning features so that each of the students can learn at their own pace or time frames”.
Adoption of Voice Assistants
In addition, educators are relying heavily on using voice assistants in the classroom environment. Voice assistants such as Amazon Alexa, Google Home, Apple Siri, and Microsoft Cortana have transformed the way students interact with their study material. In the higher education environment, universities and colleges are distributing voice assistants to students in place of traditionally printed handbooks or hard-to-navigate websites.
Assisting Educators
AI powered systems are not only helping students with course work, they are also empowering teachers with teaching material and new innovative ways to educationally express themselves. It is easier to explain a theory with the help of picture cues and graphical representation than mere definitions. The Internet has become a treasure trove of teaching material for teachers to borrow from. Also, teachers are burdened with responsibilities “such as essay evaluation, grading of exams…ordering and managing classroom materials, booking and managing field trips, responding to parents, assisting with conversation and second-language related issues…Educators often spend up to 50% of their time on non-teaching tasks.”AI powered systems can help streamline these tasks and handle repetitive and routine work, digitise interaction with parents and guardians and leave educators with more time to teach students.
The fields of Artificial Intelligence, Machine Learning and Data Science cover a vast area of study and they should not be confused with each other. They are distinct branches of computational sciences and technologies.
Artificial Intelligence
Artificial intelligence is an area of computer science wherein the computer systems are built such that they can perform tasks with the same agility as that done through human intelligence. These tasks range from speech recognition to image recognition and decision making systems among others.
This intelligence in computer systems is developed by human beings using technologies like Natural Processing Language (NLP) or computer vision among others. Data forms an important part of AI systems. Big Data, vast stashes of data generated for computer systems to analyze and study to find patterns in is imperative to Artificial Intelligence.
Machine learning
Machine learning is a subset of artificial intelligence. Machine learning is used to predict future courses of action based on historical data. It is the computer system’s ability to learn from its environment and improve on its findings.
For instance, if you have marked an email as spam once, the computer system will automatically learn to mark as spam all future emails from that particular address. To construct these algorithms developers need large amounts of data. The larger the data sets, the better the predictions. A subset of Machine Learning is Deep Learning, modeled after the neural networks of the human brain.
Data Science:
Data science is a field wherein data scientists derive valuable and actionable insights from large volumes of data. The science is based on tools developed with the knowledge of various subjects like mathematics, computer programming, statistical modeling and machine learning.
The insights derived by data scientists help companies and business organizations grow their business. Data science involves analysis of data and modelling of data among other techniques like data extraction, data exploration, data preparation and data visualization. As data volumes grow more and more vast, the scope of data science is also growing each passing day, data that needs to be analyzed to grow business.
Data Science, Machine Learning and Artificial Intelligence
Data Science, Artificial Intelligence and Machine Learning are all related in that they all rely on data. To process data for Machine Learning and Artificial Intelligence, you need a data scientist to cull out relevant information and process it before feeding it to predictive models used for Machine Learning. Machine Learning is the subset of Artificial Intelligence – which relies on computers understanding data, learning from it and making decisions based on their findings of patterns (virtually impossible for the human eye to detect manually) in data sets. Machine Learning is the link between Data Science and Artificial Intelligence. Artificial Intelligence uses Machine Learning to help Data Science get solutions to specific problems.
Big data is all around us, be it generated by our news feed or the photos we upload on social media. Data is the new oil and therefore, today, more than ever before, there is a need to study, organize and extract knowledgeable and actionable insights from it. For this, the role of data scientists has become even more crucial to our world. In this article we discuss the various skills, both technical and non-technical a data scientist needs to master to acquire a standing in a competitive market.
Technical Skills
Python and R
Knowledge of these two is imperative for a data scientist to operate. Though organisations might want knowledge of only one of the two programming languages, it is beneficial to know both. Python is becoming more popular with most organisations. Machine Learning using Python is taking the computing world by storm.
GitHub
Git and GitHub are tools for developers and data scientists which greatly help in managing various versions of the software. “They track all changes that are made to a code base and in addition, they add ease in collaboration when multiple developers make changes to the same project at the same time.”
Preparing for Production
Historically, the data scientist was supposed to work in the domain of machine learning. But now data science projects are being more often developed for production systems. “At the same time, advanced types of models now require more and more compute and storage resources, especially when working with deep learning.”
Cloud
Cloud software rules the roost when it comes to data science and machine learning. Keeping your data on cloud vendors like AWS, Microsoft Azure or Google Cloud makes it easily accessible from remote areas and helps quickly set up a machine learning environment. This is not a mandatory skill to have but it is beneficial to be up to date with this very crucial aspect of computing.
Deep Learning
Deep learning, a branch of machine learning, tailored for specific problem domains like image recognition and NLP, is an added advantage and a big plus point to your resume. Even if the data scientist has a broad knowledge of deep learning, “experimenting with an appropriate data set will allow him to understand the steps required if the need arises in the future”. Deep learning training institutes are coming up across the globe, and more so in India.
Math and Statistics
Knowledge of various machine learning techniques, with an emphasis on mathematics and algebra, is integral to being a data scientist. A fundamental grounding in the mathematical foundation for machine learning is critical to a career in data science, especially to avoid “guessing at hyperparameter values when tuning algorithms”. Knowledge of Calculus linear algebra, statistics and probability theory is also imperative.
SQL
Structured Query Language (SQL) is the most widely used database language and a knowledge of the same helps data scientist in acquiring data, especially in cases when a data science project comes in from an enterprise relational database. “In addition, using R packages like sqldf is a great way to query data in a data frame using SQL,” says a report.
AutoML
Data Scientists should have grounding in AutoML tools to give them leverage when it comes to expanding the capabilities of a resource, which could be in short supply. This could deliver positive results for a small team working with limited resources.
Data Visualization
Data visualization is the first step to data storytelling. It helps showcase the brilliance of a data scientist by graphically depicting his or her findings from data sets. This skill is crucial to the success of a data science project. It explains the findings of a project to stakeholders in a visually attractive and non-technical manner.
Non-Technical Skills
Ability to solve business problems
It is of vital importance for a data scientist to have the ability to study business problems in an organization and translate those to actionable data-driven solutions. Knowledge of technical areas like programming and coding is not enough. A data scientist must have a solid foundation in knowledge of organizational problems and workings.
Effective business communication
A data scientist needs to have persuasive and effective communication skills so he or she can face probing stakeholders and meet challenges when it comes to communicating the results of data findings. Soft skills must be developed and inter personal skills must be honed to make you a creatively competent data scientist, something that will set you apart from your peers.
Agility
Data scientist need to be able to work with Agile methodology in that they should be able to work based on the Scrum method. It improves teamwork and helps all members of the team remain in the loop as does the client. Collaboration with team members towards the sustainable growth of an organization is of utmost importance.
Experimentation
The importance of experimentation cannot be stressed enough in the field of data science. A data scientist must have a penchant for seeking out new data sets and practise robustly with previously unknown data sets. Consider this your pet project and practise on what you are passionate about like sports.
This article, the second part of a series, is on the application of artificial intelligence in the field of healthcare. The first part of the series mapped the applications of AI and deep learning in agriculture, with an emphasis on precision farming.
AI has been taking the world by storm and its most crucial application is to the two fields mentioned above. Its application to the field of healthcare is slowly expanding, covering fields of practice such as radiology and oncology.
Stroke Prevention
In a study published in Circulation, a researcher from the British Heart Foundation revealed that his team had trained an artificial intelligence model to read MRI scans and detect compromised blood flow to and from the heart.
And an organisation called the Combio Health Care developed a clinical support system to assist doctors in detecting the risk of strokes in incoming patients.
Brain-Computer Interfaces
Neurological conditions or trauma to the nervous system can adversely affect a patient’s motor sensibilities and his or her ability to meaningfully communicate with his or her environment, including the people around.
AI powered Brain-Computer Interfaces can restore these fundamental experiences. This technology can improve lives drastically for the estimated 5,00,000 people affected by spinal injuries annually the world over and also help out patients affected by ALS, strokes or locked-in syndrome.
Radiology
Radiological imagery obtained from x-rays or CT scanners put radiologists in danger of contracting infection through tissue samples which come in through biopsies. AI is set to assist the next generation of radiologists to completely do away with the need for tissue samples, experts predict.
A report says “(a)rtificial intelligence is helping to enable “virtual biopsies” and advance the innovative field of radiomics, which focuses on harnessing image-based algorithms to characterize the phenotypes and genetic properties of tumors.”
Cancer Treatment
One reason why AI, has made immense advancements in the field of medical oncology is the vast amount of data generated during cancer treatment.
Machine learning algorithms and their ability to study and synthesize highly complex datasets may be able to shed light on new options for targeting therapies to a patient’s unique genetic profile.
Developing countries
Most developing counties suffer from health care systems working on shoe-string budgets with a lack of critical healthcare providers and technicians. AI-powered machines can help plug the deficit of expert professionals.
For example, AI imaging tools can study chest x-rays for signs of diseases like tuberculosis, with an impressive rate of accuracy comparable to human beings. However, algorithm developers must bear in mind the fact that “(t)he course of a disease and population affected by the disease may look very different in India than in the US, for example,” the report says. So an algorithm based on a single ethnic populace might not work for another.