Data Science Certification Archives - Page 2 of 7 - DexLab Analytics | Big Data Hadoop SAS R Analytics Predictive Modeling & Excel VBA

World’s Biggest Tech Companies 2018: A Comprehensive List

World’s Biggest Tech Companies 2018: A Comprehensive List

Talking of world’s biggest and most-valued companies, people instinctively turn their gaze to technology sector. Ever since the phenomenal dotcom boom and onset of WorldWideWeb, the tech firms have been garnering accolades owing to their huge market caps and power to disrupt conventional industries.

FYI: A public company’s market cap refers to market capitalization, which is a measurement of the value of its current outstanding shares. To calculate the market cap, you need to just multiply the current stock price with the outstanding number of shares. Talking about today’s market condition that would mean a lot of numbers.

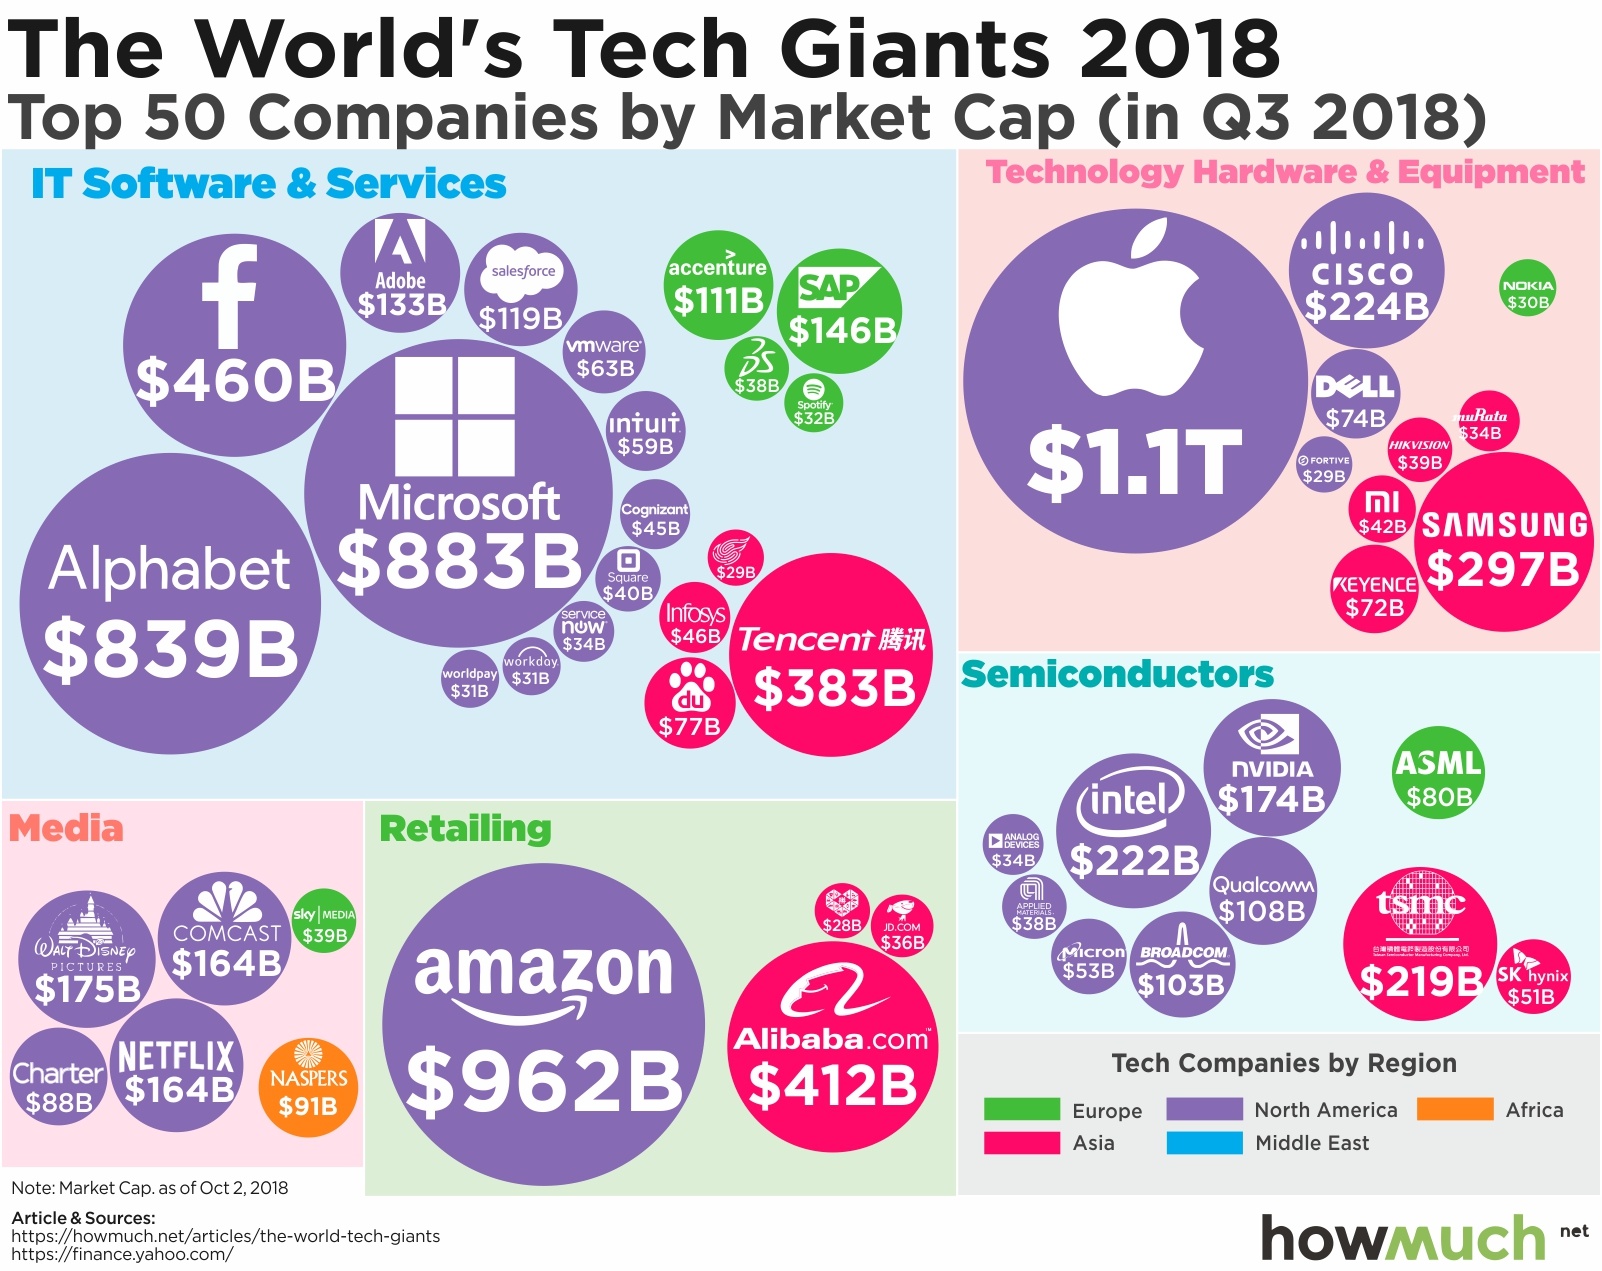
To evaluate the top notch tech companies across the globe, Howmuch.net took into consideration the market cap ranking given by Forbes and split it in an unique way. Obviously, the US and China houses some of the wealthiest companies, worth hundreds of billions of dollars.

2

Below we’ve 10 most high-valued tech companies on the planet, according to their market caps as of October 2018:

  • Apple: $1.1T
  • com: $962B
  • Microsoft: $883B
  • Alphabet: $839B
  • Facebook: $460B
  • Alibaba: $412B
  • Tencent Holdings: $383B
  • Samsung Electronics: $297B
  • Cisco Systems: $224B
  • Intel: $222B

(Give credits)

“At first glance, retailing and media appear to be much more evenly distributed than they actually are,” the report indicated. “Consider how Amazon has so dominated the market that its North American competitors are so small, they don’t even make it onto the list of top 50 companies. Amazon is so big, there is literally no other company in sight.”

Key Takeaways:

  • As always, Apple tops the list of tech companies, not only as the biggest tech company but it’s also the eighth largest company in the world according to Forbes’ Global 2000 list. The company saw $247.5 billion in sales, $53 billion in profit, $367.5 billion in assets and a market cap of $927 billion for the past year.
  • The AntiTrust Regulations and growth of 5G wireless can bring forth major changes in the modern tech market, and we are eagerly waiting for such shift in focus.

As parting thoughts, we would like to say that though the current market setup has been quite steady for a while, a surge of change may soon be here. Interestingly, Chinese tech bigwig, Alibaba is mostly likely to expand its scopes and capabilities, while 5G connectivity may appear fetching. Moreover, the speculation says antitrust regulation could disrupt functionalities of some of these companies.

To stay updated about technology-related news and innovations, follow DexLab Analytics. It’s a premier institution famous for state of the art data science courses in Delhi. For more, check out their homepage: an army of data science related courses are on offer.

 
The blog has been sourced from — www.techrepublic.com/article/the-10-most-valuable-tech-companies-in-the-world
 

Interested in a career in Data Analyst?

To learn more about Data Analyst with Advanced excel course – Enrol Now.
To learn more about Data Analyst with R Course – Enrol Now.
To learn more about Big Data Course – Enrol Now.

To learn more about Machine Learning Using Python and Spark – Enrol Now.
To learn more about Data Analyst with SAS Course – Enrol Now.
To learn more about Data Analyst with Apache Spark Course – Enrol Now.
To learn more about Data Analyst with Market Risk Analytics and Modelling Course – Enrol Now.

Best Data Science Interview Questions to Get Hired Right Away

Best Data Science Interview Questions to Get Hired Right Away

Data scientists are big data ninjas. They tackle colossal amounts of messy data, and utilize their imposing skills in statistics, mathematics and programming to collect, manage and analyze data. Next, they combine all their analytic abilities – including, industry expertise, encompassing knowledge and skepticism to unravel integral business solutions of meaningful challenges.

But how do you think they become such competent data wranglers? Years of experience or substantial pool of knowledge, or both? In this blog, we have penned down the most important interview data questions on data science – it will only aid you crack tough job interviews but also will test your knowledge about this promising field of study.

2

DexLab Analytics offers incredible Data Science Courses in Delhi. Start learning from the experts!

What do you mean by data science?

Data is a fine blend of statistics, technical expertise and business acumen. Together they are used to analyze datasets and predict the future trend.

Which is more appropriate for text analytics – R or Python?

Python includes a very versatile library, known as Pandas, which helps analysts use advanced level of data analysis tools and data structures. R doesn’t have such a feature. Therefore, Python is the one that’s highly suitable for text analytics.

Explain a Recommender System.

Today, a recommender system is extensively deployed across multiple fields – be it music recommendations, movie preferences, search queries, social tags, research and analysis – the recommender system works on a person’s past to build a model to predict future buying or movie-viewing or reading pattern in the individual.

What are the advantages of R?

  • A wide assortment of tools available for data analysis
  • Perform robust calculations on matrix and array
  • A well-developed yet simple programming language is R
  • It supports an encompassing set of machine learning applications
  • It poses as a middleman between numerous tools, software and datasets
  • Helps in developing ace reproducible analysis
  • Offers a powerful package ecosystem for versatile needs
  • Ideal for solving complex data-oriented challenges

What are the two big components of Big Data Hadoop framework?

HDFS – It is the abbreviated form of Hadoop Distributed File System. It’s the distributed database that functions over Hadoop. It stores and retrieves vast amounts of data in no time.

YARN – Stands for Yet Another Resource Negotiator. It aims to allocate resources dynamically and manage workloads.

How do you define logistic regression?

Logistic regression is nothing but a statistical technique that analyzes a dataset and forecasts significant binary outcomes. The outcome has to be in either zero or one or a yes or no.

How machine learning is used in real-life?

Following are the real-life scenarios where machine learning is used extensively:

  • Robotics
  • Finance
  • Healthcare
  • Social media
  • Ecommerce
  • Search engine
  • Information sharing
  • Medicine

What do you mean by Power Analysis?

Power analysis is best defined as the process of determining sample size required for determining an impact of a given size from a cause coupled with a certain level of assurance. It helps you understand the sample size estimate and in the process aids you in making good statistical judgments.

To get an in-depth understanding on data science, enroll for our intensive Data Science Certification – the course curriculum is industry-standard, backed by guaranteed placement assistance.

The blog has been sourced fromintellipaat.com/interview-question/data-science-interview-questions

Interested in a career in Data Analyst?

To learn more about Data Analyst with Advanced excel course – Enrol Now.
To learn more about Data Analyst with R Course – Enrol Now.
To learn more about Big Data Course – Enrol Now.

To learn more about Machine Learning Using Python and Spark – Enrol Now.
To learn more about Data Analyst with SAS Course – Enrol Now.
To learn more about Data Analyst with Apache Spark Course – Enrol Now.
To learn more about Data Analyst with Market Risk Analytics and Modelling Course – Enrol Now.

5 Big Challenges That Data Scientists Face Each Day

5 Big Challenges That Data Scientists Face Each Day

Data is lucrative; the world is revolving around how we churn out data. As a result, there’s been a high demand for data scientists. But of course, as rightfully said there’s no gain without pain – the promising field of data science is laden with many challenges, which needs to be overcome by expert consultants under needful guidance and with deft expertise.

Below, we’ve mentioned top 5 data science challenges, and how to handle them well…

Address the Specifics

Successful data scientists don’t try to do everything on their own. Instead, they individually focus on a single specific area. “I would encourage new professionals to understand that data science is a bit like medicine—it’s a vast and vague term that encapsulates wildly different practices under one roof,” said Tal Kedar, CTO at Optimove. “Data scientists [can have] very different engineering skill sets [and be] experienced with very different platforms and tools.”

For data science certification, look no further. DexLab Analytics is a prime data science training institute catering to the needs of enthusiast students. 

2

Be Guided By Your Intuition

Being a data scientist not only exposes you to the question of ‘how’, but also ‘why’. No longer do you just sift through data to make connections, instead you have to use your comprehensive knowledge to develop ‘mental model’, which can be accepted or rejected by your data.

Cross-Department Expertise is Appreciable

“The best data scientists are not just statisticians or machine learning experts; they are also an authority in the field or business where they are applying those skills,” said Kedar. It’s no hard fact, data scientists are arguably the best bridge between technical and non-technical teams. Quite naturally, whichever career they chose next, their skills will be treated as an asset to the next company in question.

Seamless Flow of Communication

Communication amongst the data teams is crucial – data scientists need to explain technical concepts to audiences from other departments, including executives and stakeholders, who might not belong from technical backgrounds. “It can be exciting to share all of the technical complexities that got you to your conclusions,” said Andrew Seitz, senior data analyst at Snowflake. “But what your stakeholders need are the key findings and action items. Save the details for the appendix (or Q&A).”

Raw Data Play

The biggest challenge for data scientists is to find ways of using the data – how the process of data extraction, data cleaning, data analysis and data modeling are carried out. Data scientists need to possess broad domain expertise in all programming languages, such as Python, R and SQL.

The work life of a data scientist revolves around creating clean data sets loaded with useful information on which machine learning algorithms can be applied. This kind of job is mostly treated as an art instead of science, because a majority of hard work and effort goes unnoticed when observing the final product, just like an artist’s craft.

The scope and capability of data science is encompassing, so are the challenges. But, of course, most of the challenges can be mitigated with considerable preparation and communication. How? With an intensive Python data science course – from the expert consultants of DexLab Analytics.


The blog has been sourced fromwww.forbes.com/sites/laurencebradford/2018/09/06/8-real-challenges-data-scientists-face/#8adbc206d999


Interested in a career in Data Analyst?

To learn more about Data Analyst with Advanced excel course – Enrol Now.
To learn more about Data Analyst with R Course – Enrol Now.
To learn more about Big Data Course – Enrol Now.

To learn more about Machine Learning Using Python and Spark – Enrol Now.
To learn more about Data Analyst with SAS Course – Enrol Now.
To learn more about Data Analyst with Apache Spark Course – Enrol Now.
To learn more about Data Analyst with Market Risk Analytics and Modelling Course – Enrol Now.

3 Potent IoT Challenges That Keeps Data Scientists Always on Toes

3 Potent IoT Challenges That Keeps Data Scientists Always on Toes

The job responsibility of data scientists is no mean feat. They stay under a lot of pressure. A wide number of stumbling blocks are laid in front of them, which makes it really difficult for them to secure the long-shot business goals and objectives.

As prevention is better than cure – being aware of the challenges always help data scientists plot the shortest and smartest route to success, and we can’t agree more. Brace yourselves! Below, we’ve enumerated some of the challenges data scientists face while getting started with an IoT project:

2

Inferior Data Quality

Messy data is life and soul of data scientists. Irrespective of business scale, the job of every data scientist is to organize data in the correct manner. But, however organizing them may require adequate time as well as hard work.

A fundamental rule – avoid manual data, wherever possible. Intelligent data compilation is the final key to high quality data, which is a prerequisite for favorable company operation. It includes crisp communication, regular anomaly detection, logic determination and well-defined industry standards. Another way to tame your data can be through application integration tools – they are a fabulous way to automate data entry and lessen escalation of typographical errors, individual eccentricities, staggering spellings and more from the data.

Once data is in the right format and quality, data scientists can start slicing off the data they don’t need any more, which takes us to the next step.

For Data Science Certification, drop by DexLab Analytics.

Shedding Out Excessive Data

Though big data is found in abundance, too much of data can also pose a substantial challenge. This is why employing superior data selection techniques and minimizing features are supported, they help eliminate unwanted chaos cutting through what matters the most.

What happens is that when data becomes excessively large, we often end up developing high-end predictive models that fails to deliver productive results. But, on the other hand, if you track the events, giving importance to validation and testing routines, the outcomes will spell perfection. And that’s what we are looking forward to.

Predictive Analytics is the Key

IoT has made predictive analytics a daunting reality. Owing to its critical business significance, predictive analytics is quickly accelerating along the priority ladder of IoT stakeholders. However, take a note, this breed of analytics may not be fruitful in every instance. It’s imperative to begin your analytics endeavor by clearly defining your module’s objective, followed by needed research and valuation.

Next, you need to sync in with subject matter pundits to ascertain which predictions will lead you closer to fulfilling the business objectives. Following to this, you have to be sure that you have all the data required to make prediction. In other cases, you can re-set goals, anytime.

Find the best Data Science Courses in Noida… At DexLab Analytics. Get detailed information on the website.


The blog has been sourced from — www.networkworld.com/article/3305329/internet-of-things/3-iot-challenges-that-keep-data-scientists-up-at-night.html


Interested in a career in Data Analyst?

To learn more about Data Analyst with Advanced excel course – Enrol Now.
To learn more about Data Analyst with R Course – Enrol Now.
To learn more about Big Data Course – Enrol Now.

To learn more about Machine Learning Using Python and Spark – Enrol Now.
To learn more about Data Analyst with SAS Course – Enrol Now.
To learn more about Data Analyst with Apache Spark Course – Enrol Now.
To learn more about Data Analyst with Market Risk Analytics and Modelling Course – Enrol Now.

Explaining the Job Nitty Gritty of a Data Scientist

Explaining the Job Nitty Gritty of a Data Scientist

What do data scientists do? Since the inception of the term data science, we’ve heard about how it transforms all major sectors, including retail, agriculture, health, legal, telecommunications and automobile industry, but little do we know what exactly the job entails.

Following a recent DataCamp podcast DataFramed, we found out a set of key things about data scientists, and they are as follows:

2

Not only tech, but other industries are being explored

A prominent data scientist from Convoy shared insights about how their company is leveraging data science to revolutionize North American trucking industry. Then again, data science is also deemed to make a significant impact on cancer research. So, from this we can understand that data science is not only limited within the walls of technology but has started to seep through different industry verticals.

via GIPHY

It’s beyond AI and self-driving cars

Sure, deep learning and machine learning are powerful applications, but not all data scientists are lost waddling around these top notch techniques. Instead, most of the regular data scientists earn their daily bread and butter through data accumulation and cleaning, creating reports and dashboards, data viz, statistical inference, communicating and convincing decision-makers about key outcomes.

Skill evolution

“Which skill is more important for a data scientist: the ability to use the most sophisticated deep learning models, or the ability to make good PowerPoint slides?” – The latter is crucial, so is communicating results.

However, these skills are likely to change very quickly. In a very short span of time. Rapid development across diverse open-source ecosystem is evident; as a result any kind of skill or expertise is unlikely to last long.

For quick Data Science Certification, drop by DexLab Analytics.

Specialization is the key

It’s better to break down data science into three main components: Business Intelligence, which talks about pulling out data and presenting it to the right people in the form of reports, dashboards and mails; Decision Science, which is all about gathering company data and analyzing it for decision-making; and Machine Learning, which deals with the ways in which we can use data science models and put them into production.

Choosing a distinct career path is an emerging trend and it’s gaining a lot of popularity for all the right reasons.

Ethics is a driving factor

No wonder, this profession is full of uncertainty; at a time, when most of our daily interactions are influenced by algorithms designed by data scientists, what role do you think ethics play? On this context, this is what Omuji Miller, the senior machine learning data scientist at GitHub has to say:

‘We need to have that ethical understanding, we need to have that training, and we need to have something akin to a Hippocratic oath. And we need to actually have proper licenses so that if you actually do something unethical, perhaps you have some kind of penalty, or disbarment, or some kind of recourse, something to say this is not what we want to do as an industry, and then figure out ways to remediate people who go off the rails and do things because people just aren’t trained and they don’t know.’

Soon, we’re approaching a state where the need to maintain ethical standards would come from within data science itself and advocates, legislators and other stakeholders. Hope this consensus comes soon.

The data science revolution is quite the order of the day, and it’s going to stay for a while. So, if you want to ace up your data skills, we’ve superior Data Science Courses in Delhi. Just, visit our website and pore over our course offerings.


The blog has been sourced from — hbr.org/2018/08/what-data-scientists-really-do-according-to-35-data-scientists


Interested in a career in Data Analyst?

To learn more about Data Analyst with Advanced excel course – Enrol Now.
To learn more about Data Analyst with R Course – Enrol Now.
To learn more about Big Data Course – Enrol Now.

To learn more about Machine Learning Using Python and Spark – Enrol Now.
To learn more about Data Analyst with SAS Course – Enrol Now.
To learn more about Data Analyst with Apache Spark Course – Enrol Now.
To learn more about Data Analyst with Market Risk Analytics and Modelling Course – Enrol Now.

Fundamental Concepts of Statistics for Data Science Beginners- Part One

Fundamental Concepts of Statistics for Data Science Beginners- Part One

Do you aspire to be a data scientist? Then is it essential that you have a solid understanding of the core concepts of statistics. Everyone doesn’t have a Ph.D. in Statistics. And that isn’t the only way to excel in the field of data science. But yes, knowing stats well is a prerequisite for data science.

Nowadays, popularly used libraries, like Tesorflow, liberate the user from the intricacies of complex mathematics. Still, it is advisable to be familiar with the fundamental principles on which they work, because that will enable you to use the libraries better.

In this blog, we attempt to shed light on some basic concepts, theorems and equations of statistics for data science.

Statistical Distributions:

Statistical distributions are important tools that you must arm yourself with to be a skilled data scientist. Here, we shall talk about two important distributions, namely Poisson distribution and Binomial distribution.

Poisson distribution:
This distribution is used to find out the number of events that are expected to occur during an interval of time. For example, the number of page views in one second, the number of phone calls in a particular period of time, number of sales per hour, etc.

The symbols used in the equation are:

x: exact number of successes

e: constant equal to 2.71828 approximately

λ: average number of successes per time interval

Poisson distribution is used for calculating losses in manufacturing. Let us consider that a machine generates metal sheets that have ‘x’ flaws per yard. Suppose the error rate is 2 per yard of sheet (λ). Applying this information to Poisson distribution, we can calculate the probability of having exactly two errors in a yard.

Source: Brilliant.org

Poisson distribution is used for faster detection of anomalies.

Binomial distribution:

This is a very common distribution in Statistics. Suppose you have flipped a coin thrice. Using basic combinatorics for flipping a coin thrice, we see that there are eight combinations possible. We find out the probabilities of getting 0, 1, 2 or 3 heads and plot this on a graph. This gives us the binomial distribution for this particular problem. It must be remembered that Binomial distribution curve is similar to a Normal distribution Curve. Normal distribution is used when values are continuous and Binomial distribution is used for discrete values.

Source: mathnstuff.com

Binomial distribution is a discrete probability distribution where number of trials is predetermined and there are two possible outcomes– success and failure, win or lose, gain or loss. Depending on a few conditions, like the total number of trails is large, the probability of success is near 1 and the probability of failure is near 0, the trails are independent and identical, etc., the binomial distribution is approximated to a normal distribution.

Source: MathBitsNotebook

Binomial distribution has many applications in business. For example, it is estimated that 5% of tax returns for individuals with high net worth in USA is fraudulent. These frauds might be uncovered through audits. Binomial distribution is used to find out for ‘n’ number of tax returns that are audited, what is the probability for say 5 fraudulent returns to be uncovered.

There are some more probability distributions, like Bernoulli and Geometric distributions. We shall cover that and more in the following blogs. So, stay tuned and follow DexLab Analytics. The experts here offer top-quality data science courses in Delhi. Go through the data science certification details right now!


References:

upgrad.com/blog/basics-of-statistics-for-data-science

anomaly.io/anomaly-detection-poisson-distribution

analyticsvidhya.com/blog/2017/09/6-probability-distributions-data-science


Interested in a career in Data Analyst?

To learn more about Data Analyst with Advanced excel course – Enrol Now.
To learn more about Data Analyst with R Course – Enrol Now.
To learn more about Big Data Course – Enrol Now.

To learn more about Machine Learning Using Python and Spark – Enrol Now.
To learn more about Data Analyst with SAS Course – Enrol Now.
To learn more about Data Analyst with Apache Spark Course – Enrol Now.
To learn more about Data Analyst with Market Risk Analytics and Modelling Course – Enrol Now.

The Big Data Driven Future of Fashion: How Data Influences Fashion

The Big Data Driven Future of Fashion: How Data Influences Fashion

Big Data is revolutionizing every industry, including fashion. The nuanced notion of big data is altering the ways designers create and market their clothing. It’s not only aiding designers in understanding customer preferences but also helps them market their products well. Hadoop BI is one of the potent tools of technology that provides a wide pool of information for designers to design range of products that will sell.

2

How Does the Mechanism Work?

Large sets of data help draw patterns and obviously trends play a crucial role across the fashion industry. In terms of nature, fashion and trends both are social. Irrespective of the nature of data, structured or unstructured, framing trends and patterns in the fashion industry leads to emerging ideas, strategies, shapes and styles, all of which ushers you into bright and blooming future of fashion.

What Colors To Choose For Your Line?

KYC (Know Your Customer) is the key here too. A fashion house must know which colors are doing rounds amongst the customers. Big data tells a lot about which color is being popular among the customers, and based on that, you can change your offerings subject to trend, style picks and customer preferences.

Men’s or Women’s Clothing: Which to Choose?

Deciding between men’s or women fashion is a pivotal point for any designer. Keep in mind, target demographic for each designer is different, and they should know who will be their prospective customers and who doesn’t run a chance.

Big data tool derive insights regarding when customers will make purchases, how large will be the quantity and how many items are they going to buy. Choosing between men’s and women’s fashion could make all the difference in the world.

Arm yourself with business analyst training courses in Gurgaon; it’s high time to be data-friendly.

Transforming Runway Fashion into Retail Merchandise

Launching a brand in the eyes of the public garners a lot of attention, and the designs need to be stellar. But, in reality the fashion that we often see on runways is rarely donned by the ordinary customers; because, the dresses and outfits that are showcased on the ramp are a bit OTT, thus altered before being placed in the stores. So, big data aids in deciphering which attires are going to be successful, and which will fail down the line. So, use the power of big data prudently and reap benefit, unimaginable across the global retail stores.

Deciding Pricing of the Product

As soon as the garbs leave the runway, they are tagged with prices, which are then posted inside the stores, after analyzing how much the customers are willing to pay for a particular product. For averaging, big data is a saving grace. Big data easily averages the prices, and decides a single mean price, which seems to be quite justifiable.

However, remember, while pricing, each garments are designed keeping in mind a specified customer range. Attires that are incredibly expensive are sold off to only a selected affluent user base, while the pricing of items that are designed for general public are pegged down. Based on previous years’ data, big data consultants can decide the pricing policy so that there’s something for all.

The world of fashion is changing, and so is the way of functioning. From the perspective of fashion house owner, collect as much data as possible of customers and expand your offerings. Big data analytics is here to help you operate your business and modify product lines that appeals to the customers in future.

And from the perspective of a student, to harness maximum benefits from data, enroll in a data analyst course in Gurgaon. Ask the consultants of DexLab Analytics for more deets.


The article has been sourced from

channels.theinnovationenterprise.com/articles/8230-big-data-hits-the-runway-how-big-data-is-changing-the-fashion-industry

iamwire.com/2017/01/big-data-fashion-industry/147935

bbntimes.com/en/technology/big-data-is-stepping-into-the-fashion-world


Interested in a career in Data Analyst?

To learn more about Data Analyst with Advanced excel course – Enrol Now.
To learn more about Data Analyst with R Course – Enrol Now.
To learn more about Big Data Course – Enrol Now.

To learn more about Machine Learning Using Python and Spark – Enrol Now.
To learn more about Data Analyst with SAS Course – Enrol Now.
To learn more about Data Analyst with Apache Spark Course – Enrol Now.
To learn more about Data Analyst with Market Risk Analytics and Modelling Course – Enrol Now.

Business Intelligence: How to Enhance User Adoption?

Business Intelligence: How to Enhance User Adoption?

For business modernization, smart business intelligence solution is the key. Getting to the crux and leveraging vast pools of data that companies gain access to triggers encompassing digital transformation. BI tools not only let companies grasp the data but also develop actionable insights to smoothen the impactful decision-making capabilities and take companies towards future progress.

It’s not an out of ordinary kind of concept, for half a decade, companies have been utilizing these kinds of tools for better efficiency and productive outcomes, yet user adoption for BI tool remains relatively low.

2

Reasons behind Lower User Adoption of Business Intelligence:

Guys at the helm of company affairs, including Chief Information Officers, Chief Technology Officers and Chief Data Officers may think it’s high time to incorporate Business Intelligence tools for smarter operations, but it may not have the same effect on the employees. Employees may not be much inspired!

It holds truer, especially for those employees, who have been in the workforce for long and haven’t for once used such intricate, new-age tools to decipher what data says. For them, old is gold – they prefer to continue their own kind of data analysis in the same way they have been doing for so many years.

How Companies Can Improve Data-Driven Mindsets?

In order to be ahead of the curve, the data mindset of the workforce needs to be changed. If businesses have to be completely data-driven, they can’t just take Business Intelligence lightly.

Here are a few ways business can drive user adoption of BI:

Introduce BI as a necessity, not luxury

Once understanding company data was considered as an added advantage to normal work procedures. But, in this age of digital transformation, it’s no longer a luxury but a necessity. And sooner the employees realize this, the better it becomes.

Employees across organizations should have thorough access to data. It boosts decision-making. By going completely data-driven, business intelligence user adoption will automatically improve. Along with employees, businesses too will benefit a lot from such adoption.

Promote Favorable Impacts of BI

Putting light on success stories of BI implementation helps! It’s being regarded as a powerful way to encourage budding data scientists and already in-workforce employees: the powerful impression of BI and its significant impacts on key performance indicators will tell a different story to the world.

The best way of doing it would be by developing an internal case study that will elucidate how a team after incorporating Business Intelligence fulfilled their desired organizational goals. For best results, let a manager or C-level employee present the case study to the workforce. Surely, this will enhance levels of user adoption of BI.

Continuous Training is a Must

Business Intelligence calls for no one-track solutions; the concept deals with almost endless opportunities, which means continuous training initiatives should be taken up to explore every facet of this cutting edge tool.

When an employee have deeper knowledge about a particular tool, they are more likely to derive maximum benefits out of it. So, by giving continuous training, through various FAQs, webinars and video tutorials, employees can now become very easily completely data-driven.

Now, following these easy yet effective tips, business leaders can increase their lower rates of BI adoption and stride towards full digital transformation of their companies, triggering impactful future goals.

Want to know more about Data Science Courses in Noida? Drop by DexLab Analytics; for a fulfilling learning experience, opt for their Data Science Courses. They are simply excellent and student-friendly. 

 
The blog has been sourced from — www.sisense.com/blog/make-business-intelligence-necessity-drive-user-adoption
 

Interested in a career in Data Analyst?

To learn more about Data Analyst with Advanced excel course – Enrol Now.
To learn more about Data Analyst with R Course – Enrol Now.
To learn more about Big Data Course – Enrol Now.

To learn more about Machine Learning Using Python and Spark – Enrol Now.
To learn more about Data Analyst with SAS Course – Enrol Now.
To learn more about Data Analyst with Apache Spark Course – Enrol Now.
To learn more about Data Analyst with Market Risk Analytics and Modelling Course – Enrol Now.

A Comprehensive Study on Analytics and Data Science India Jobs 2018

A Comprehensive Study on Analytics and Data Science India Jobs 2018

India accounts for 1 in 10 data science job openings worldwide – with about 90,000 vacancies, India ranks as the second-biggest analytics hub, next to the US – according to a recent study compiled by two renowned skilling platforms. The latest figure shows a 76% jump from the last year.

With the advent of artificial intelligence and its overpowering influence, the demand for skill-sets in machine learning, data science and analytics is increasing rapidly. Job creation in other IT fields has hit a slow-mode in India, making it imperative for people to look towards re-skilling themselves with new emerging technologies… if they want to stay relevant in the industry. Some newer roles have also started mushrooming, with which we are not even acquainted now.

2

Top trends in analytics jobs in 2018 as follows:

  • The total number of data science and analytics jobs nearly doubled from 2017 to 2018.
  • There’s been a sharp contrast in the percentage increase of analytics job inventory in the past years – from 2015 to 2016, the number of analytics jobs increased by 52%, which increased by only 40% from 2014 to 2015.
  • Currently, if we go by the reports, nearly 50000 analytics job positions are currently available to get filled by suitable candidates. Although the exact numbers are difficult to ascertain.
  • Amazon, Goldman Sachs, Citi, E&Y, Accenture, IBM, HCL, JPMorgan Chase, KPMG and Capgemini – are 10 top-tier organizations with the highest number of analytics opening in India.

City Figures

Bengaluru is the IT hub of India and accounts for the largest share of the data science and analytics jobs in India. Approximately, it accounted for 27% of jobs till the quarter of the last year.

Tier-II cities also witnessed a surging trend in such roles from 7% to 14% in between 2017 and 2018 – as startups started operating out of these locations.

Delhi/NCR ranks second contributing 22% analytics jobs in India, followed by Mumbai with 17%.

Industry Figures

Right from hospitality, manufacturing and finance to automobiles, job openings seem to be in every sector, and not just limited to hi-tech industries.

Banking and financial sector continued to be the biggest job drivers in analytics domain. Almost 41% of jobs were posted from the banking sector alone, though the share fell from last year’s 46%.

Ecommerce and media and entertainment followed the suit and contributed to analytics job inventory. Also, the energy and utilities seem to have an uptick in analytics jobs, contributing to almost 15% of all analytics jobs, 4% hike from the last year’s figure.

Education Requirement Figures

In terms of education, almost 42% of data analytics job requirements are looking for a B.Tech or B.E degree in candidates. 26% of them prefer a postgraduate degree, while only 10% seeks an MBA or PGDM.

In a nutshell, 80% of employers resort to hiring analytics professionals who have an engineering degree or a postgraduate degree.

As a result, Data analyst course has become widely popular. It’s an intensive, in-demand skill training that is intended for business, marketing and operations managers, data analyst and professionals and financial industry professionals. Find a reputable data analyst training institute in Gurgaon and start getting trained from the experts today.


The article has been sourced from:

https://qz.com/1297493/india-has-the-most-number-of-data-analytics-jobs-after-us

https://analyticsindiamag.com/analytics-and-data-science-india-jobs-study-2017-by-edvancer-aim


Interested in a career in Data Analyst?

To learn more about Data Analyst with Advanced excel course – Enrol Now.
To learn more about Data Analyst with R Course – Enrol Now.
To learn more about Big Data Course – Enrol Now.

To learn more about Machine Learning Using Python and Spark – Enrol Now.
To learn more about Data Analyst with SAS Course – Enrol Now.
To learn more about Data Analyst with Apache Spark Course – Enrol Now.
To learn more about Data Analyst with Market Risk Analytics and Modelling Course – Enrol Now.

Call us to know more