data Science certification courses Archives - DexLab Analytics | Big Data Hadoop SAS R Analytics Predictive Modeling & Excel VBA

An Introduction to Sampling and its Types

An Introduction to Sampling and its Types

Sampling is a technique in which a predefined number of observation is taken from a large population for the purpose of statistical analysis and research.

There are two types of sampling techniques:-

Random Sampling

Random sampling is a sampling technique in which each observation has an equal probability of being chosen. This kind of sample should be an unbiased representation of the population.

Types of random sampling

  1. Simple Random Sampling:- Simple random sampling is a technique in which any observation can be chosen and each observation has an equal probability of being selected.
  2. Stratified Random Sampling:- In this sampling technique we create sub-group of the population with similar attributes and characteristics and then out of those sub-groups we then include each category in our sample with the probability of choosing each observation from the sub-group being equal.

  3. Systematic Sampling:- This is a sampling technique where the first observation is selected randomly and then every kth element is chosen randomly to be included in our sample.
    k= 2, here the first observation is selected randomly and after that every second element is included in the sample.

  4. Cluster Sampling:- This is a sampling technique in which the data is grouped into small sub-groups called clusters with random categories and then from those clusters random observation is selected which then is included in the sample.

Two clusters are created from which then random observation will be chosen to form the sample.

Non-Random Sampling :- It is a sampling technique in which an element of biasedness is introduced which means that an observation is selected for the sample on the basis of not probability but choice.

Types of non-random sampling:-

  1. Convenience Sampling:- When a sample observation is drawn from the population based on how comfortable it is for you to take the observation it is called convenience sampling. For example when you have a survey sheet that is to be filled by students from all the departments of your college but you only ask your friends to fill the survey sheet.
  2. Judgment Sampling:– When the sample observation drawn from the population is based on your professional judgment or past experience, it is called judgment sampling.
  3. Quota Sampling:– When you draw a sample observation from the population that is based on some specific attribute, it is called quota sampling. For example, taking sample of people over and above 50 years.
  4. Snow Ball Sampling:– When survey subjects are selected based on referral from other survey respondents, it is called snow ball sampling.

Sampling and Non-sampling errors

Sampling errors:- It occurs when the sample is not representative of the entire population.  For example a sample of 10 people with or without COVID-19 cannot tell whether or not the entire population of a country is COVID positive.

Non-sampling error:-This kind of error occurs during data collection. For example, during data collection if you falsely specified a name, it will be considered a non-sampling error.

So, with that this discussion on Sampling wraps up, hopefully, at the end of this you have learned what Sampling is, what are its variations and how do they all work. If you need further clarification, then check out our video tutorial on Sampling attached down the blog. DexLab Analytics provides the best data science course in gurgaon, keep following the blog section to stay updated.


.

Hypothesis Testing: An Introduction

Hypothesis Testing: An Introduction

You must be familiar with the phrase hypothesis testing, but, might not have a very clear notion regarding what hypothesis testing is all about. So, basically the term refers to testing a new theory against an old theory. But, you need to delve deeper to gain in-depth knowledge.

Hypothesis are tentative explanations of a principal operating in nature. Hypothesis testing is a statistical method which helps you prove or disapprove a pre-existing theory.

Hypothesis testing can be done to check whether the average salary of all the employees has increased or not based on the previous year’s data, testing can be done to check if the percentage of passengers increased or not in the business class due to introduction of a new service and testing can also be done to check the differences in the productivity varied land.

There are two key concepts in testing of hypothesis:-

Null Hypothesis:- It means the old theory is correct, nothing new is happening, the system is in control, old standard is correct etc. This is the theory you want to check if is true or not. For example if a ice-cream factory owner says that their ice-cream contains 90% milk, this can be written as:-

Alternative Hypothesis:- It means new theory is correct, something is happening, system is out of control, there are new standards etc. This is the theory you check against the null hypothesis. For example you say that ice-cream does not contain 90% milk, this can be written as:-

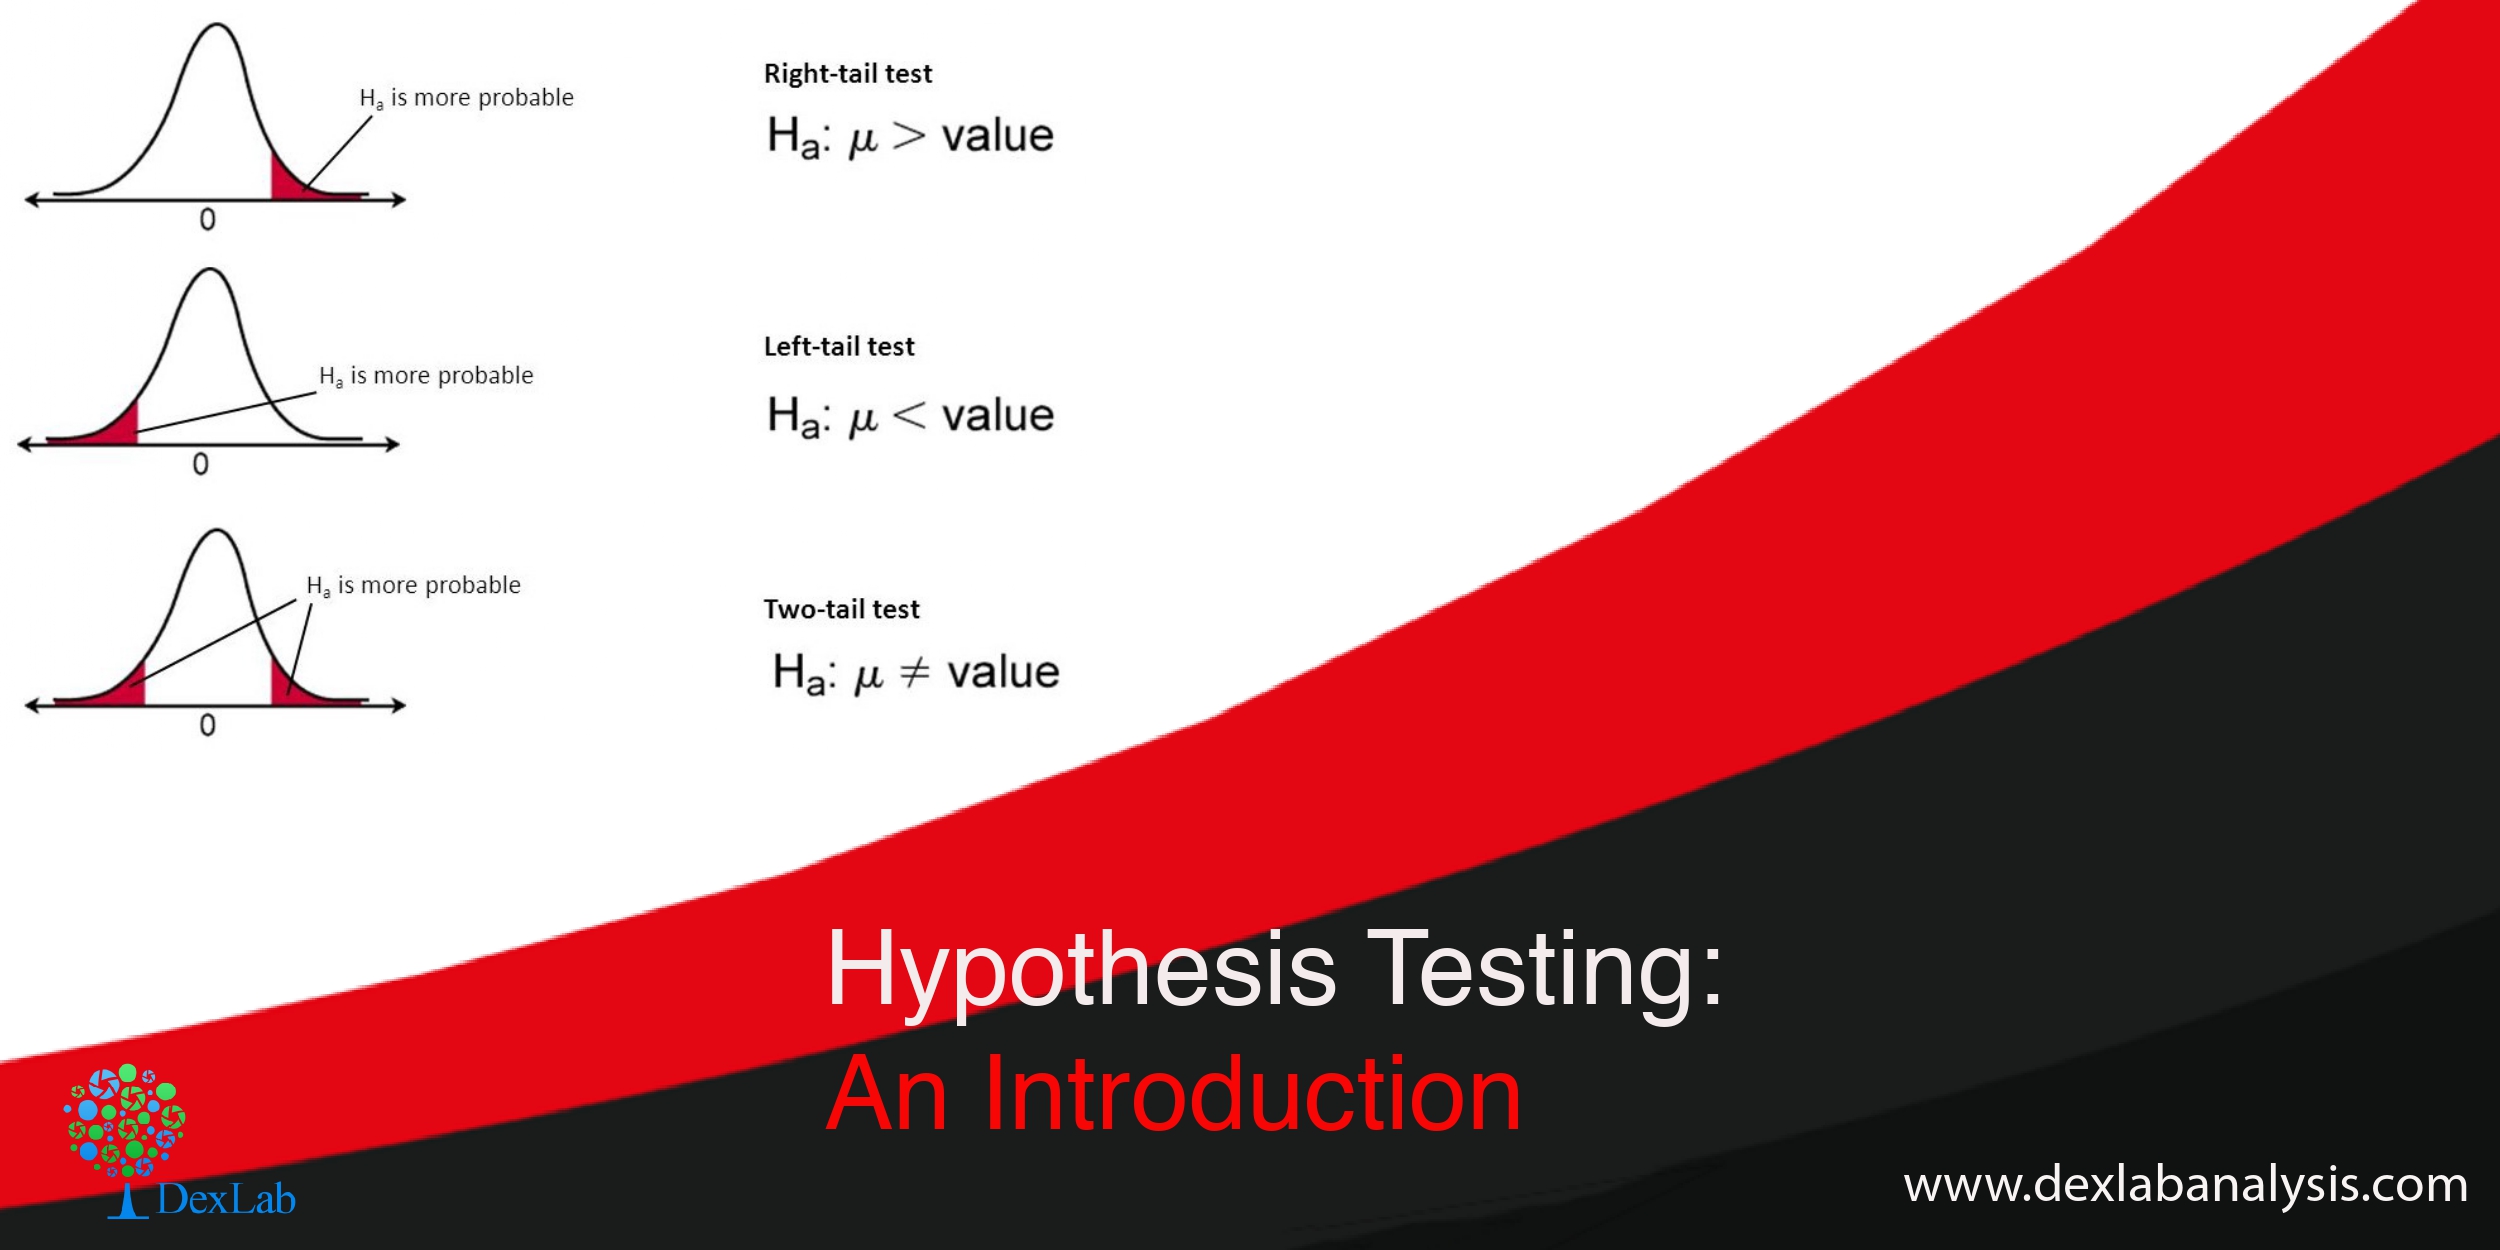
Two-tailed, right tailed and left tailed test

Two-tailed test:- When the test can take any value greater or less than 90% in the alternative it is called two-tailed test ( H190%) i.e. you do not care if the alternative is more or less all you want to know is if it is equal to 90% or no.

Right tailed test:-When your test can take any value greater than 90% (H1>90%) in the alternative hypothesis it is called right tailed test.

Left tailed test:-When your test can take any value less than 90% (H1<90%) in the alternative hypothesis it is called left tailed test.

Type I error and Type II error

->When we reject the null hypothesis when it is true we are committing type I error. It is also called significance level.

->When we accept the null hypothesis when it is false we are committing type II error.

Steps involved in hypothesis testing

  1. Build a hypothesis.
  2. Collect data
  3. Select significance level i.e. probability of committing type I error
  4. Select testing method i.e. testing of mean, proportion or variance
  5. Based on the significance level find the critical value which is nothing but the value which divides the acceptance region from the rejection region
  6. Based on the hypothesis build a two-tailed or one-tailed (right or left) test graph
  7. Apply the statistical formula
  8. Check if the statistical test falls in the acceptance region or the rejection region and then accept or reject the null hypothesis

Example:- Suppose the average annual salary of the employees in a company in 2018 was 74,914. Now you want to check whether the average salary  of the employees has increased or not in 2019. So, a sample of 112 people were taken and it was found out  that the average annual salary of the employees in 2019 is 78,795. σ=14.530.

We will apply hypothesis testing of mean when  known with 5% of significance level.

The test result shows that 2.75 falls beyond the critical value of 1.9 we reject the null hypothesis which basically means that the average salary has increased significantly in 2019 compared to 2018.

So, now that we have reached at the end of the discussion, you must have grasped the fundamentals of hypothesis testing. Check out the video attached below for more information. You can find informative posts on Data Science course, on Dexlab Analytics blog.


.

Call us to know more